| Param | Original file | Final file |
|---|---|---|
| Filename | modeM0/AS1G06_157T01_9000000772_05960cztM0_level2.evt | modeM0/AS1G06_157T01_9000000772_05960cztM0_level2_quad_clean.evt |
| Size (bytes) | 2,760,759,360 | 366,033,600 |
| Size | 2.6 GB | 349.1 MB |
| Events in quadrant A | 14,032,095 | 2,413,055 |
| Events in quadrant B | 13,182,078 | 2,450,768 |
| Events in quadrant C | 32,355,925 | 2,027,609 |
| Events in quadrant D | 22,111,380 | 2,223,945 |
| Mode M9 | |||
|---|---|---|---|
| Quadrant | BADHDUFLAG | Total packets | Discarded packets |
| A | 0 | 38 | 0 |
| B | 0 | 38 | 0 |
| C | 0 | 38 | 0 |
| D | 0 | 38 | 0 |
| Mode M0 | |||
|---|---|---|---|
| Quadrant | BADHDUFLAG | Total packets | Discarded packets |
| A | 0 | 61872 | 22 |
| B | 0 | 59157 | 31 |
| C | 0 | 116574 | 125 |
| D | 0 | 86606 | 52 |
| Mode SS | |||
|---|---|---|---|
| Quadrant | BADHDUFLAG | Total packets | Discarded packets |
| A | 0 | 586 | 0 |
| B | 0 | 586 | 0 |
| C | 0 | 586 | 0 |
| D | 0 | 586 | 0 |
| Quadrant | Total seconds | Saturated seconds | Saturation percentage |
|---|---|---|---|
| A | 28614 | 475 | 1.660027% |
| B | 28610 | 271 | 0.947221% |
| C | 28605 | 7950 | 27.792344% |
| D | 28609 | 2547 | 8.902793% |
Noise dominated data is calculated using 1-second bins in cleaned event files. If a bin has >2000 counts, and if more than 50% of those come from <1% of pixels, then it is considered to be noise-dominated and hence unusable.
| Quadrant | # 1 sec bins | Bins with >0 counts | Bins with >2000 counts | High rate bins dominated by noise | Noise dominated (total time) | Noise dominated (detector-on time) | Marked lightcurve |
|---|---|---|---|---|---|---|---|
| A | 32512 | 28624 | 152 | 152 | 0.47% | 0.53% | 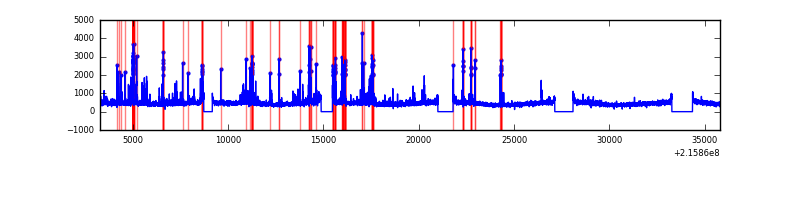 |
| B | 32512 | 28624 | 3 | 3 | 0.01% | 0.01% |  |
| C | 32512 | 28613 | 6394 | 6394 | 19.67% | 22.35% | 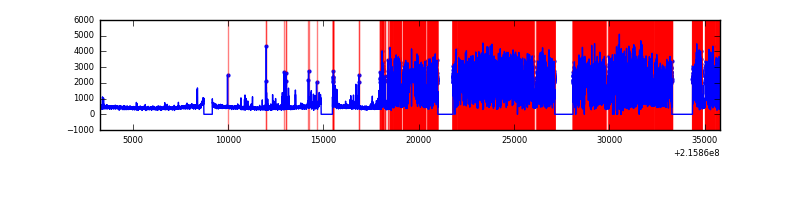 |
| D | 32512 | 28625 | 2494 | 2494 | 7.67% | 8.71% | 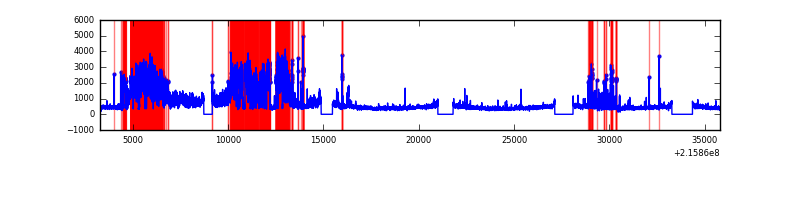 |
Top three noisy pixels from each quadrant. If the there are fewer than three noisy pixels in the level2.evt file, extra rows are filled as -1
| Pixel properties | Quadrant properties | ||||||
|---|---|---|---|---|---|---|---|
| Quadrant | DetID | PixID | Counts | Sigma | Mean | Median | Sigma |
| A | 4 | 2 | 1308374 | 2008.74 | 3203 | 3132 | 649.8 |
| A | 13 | 251 | 233912 | 355.16 | 3203 | 3132 | 649.8 |
| A | 8 | 192 | 130527 | 196.06 | 3203 | 3132 | 649.8 |
| B | 15 | 204 | 168986 | 268.8 | 3253 | 3176 | 616.9 |
| B | 0 | 214 | 132377 | 209.45 | 3253 | 3176 | 616.9 |
| B | 4 | 81 | 120590 | 190.34 | 3253 | 3176 | 616.9 |
| C | 9 | 247 | 21639367 | 34576.39 | 2718 | 2727 | 625.8 |
| C | 9 | 54 | 46659 | 70.21 | 2718 | 2727 | 625.8 |
| C | 14 | 206 | 35857 | 52.94 | 2718 | 2727 | 625.8 |
| D | 1 | 20 | 9027642 | 12171.59 | 3051 | 2958 | 741.5 |
| D | 10 | 172 | 1209959 | 1627.88 | 3051 | 2958 | 741.5 |
| D | 8 | 195 | 86695 | 112.94 | 3051 | 2958 | 741.5 |
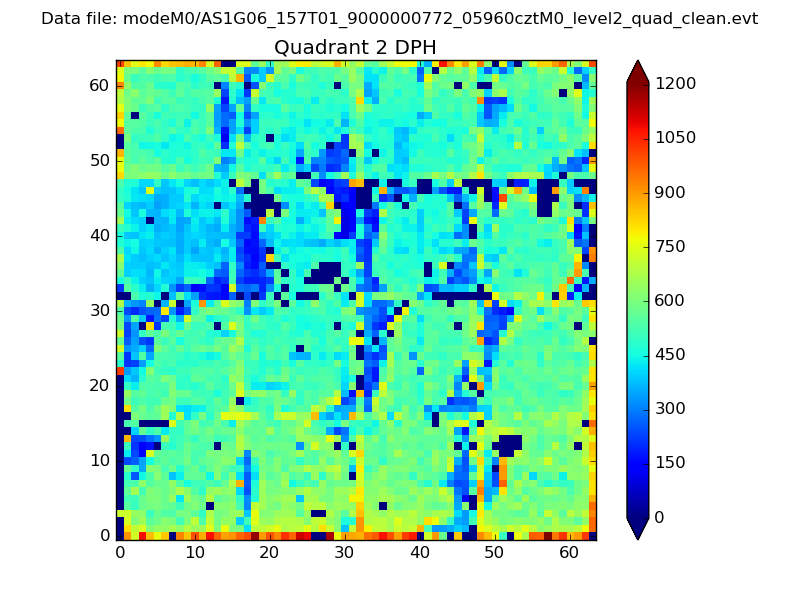
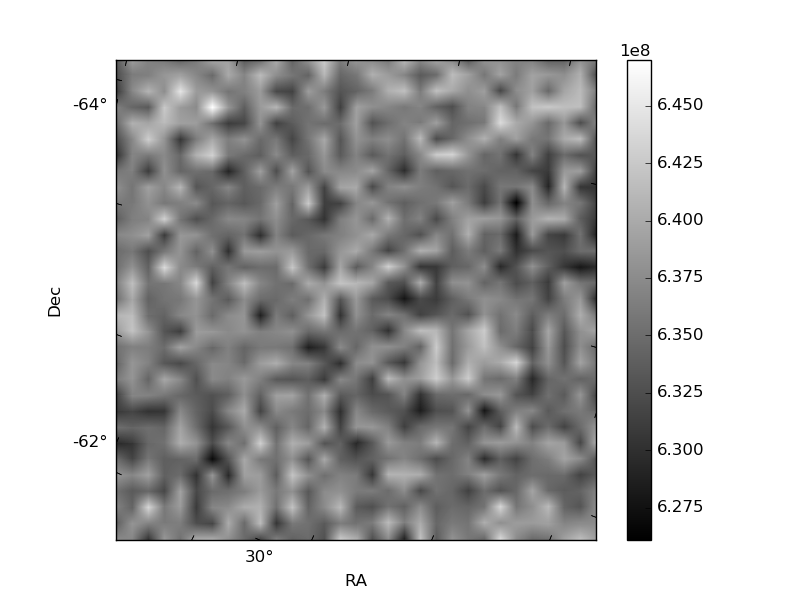
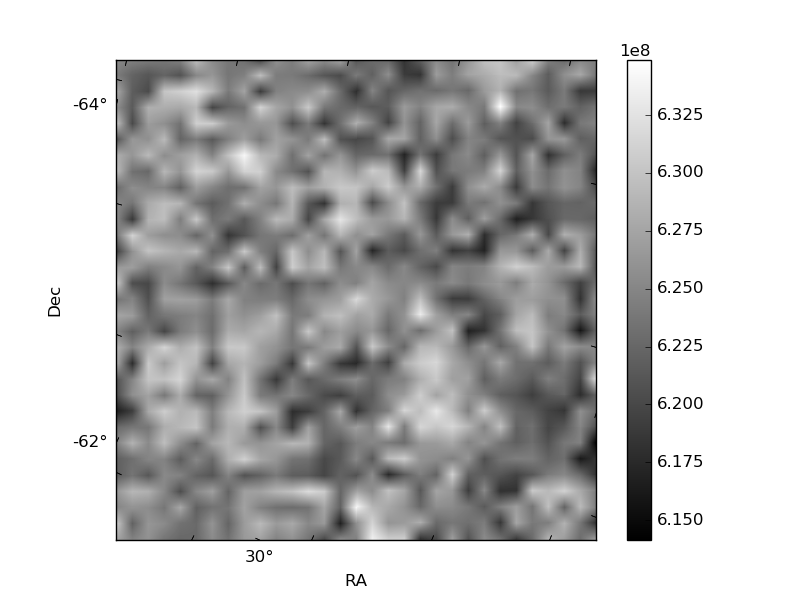
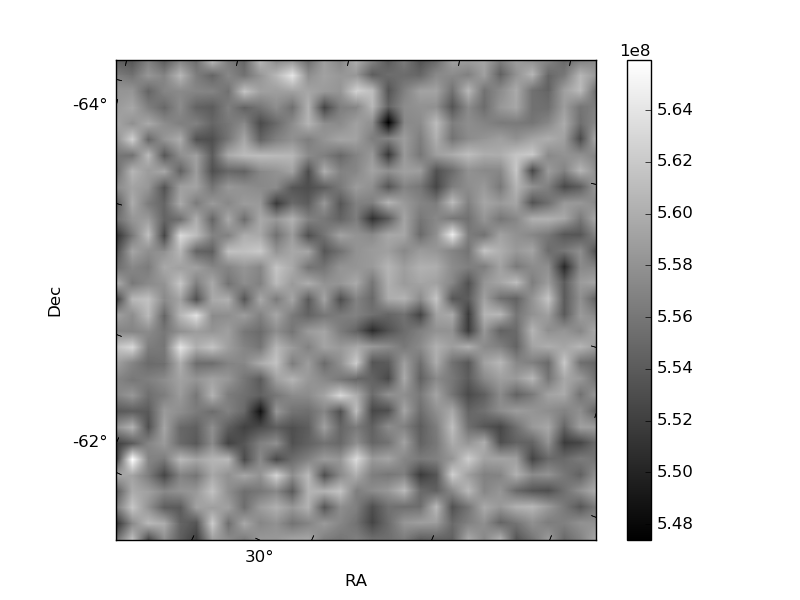
Histogram calculated using DETX and DETY for each event in the final _common_clean file
| Quadrant A | 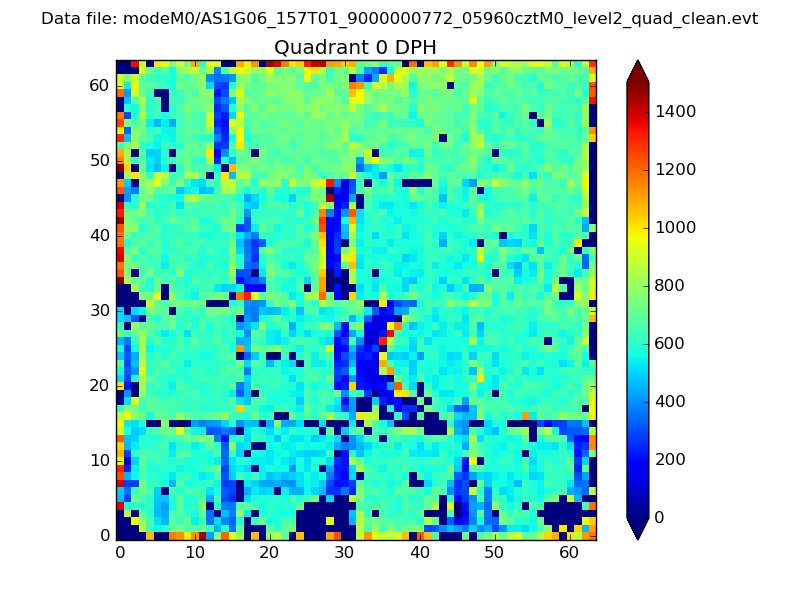 |
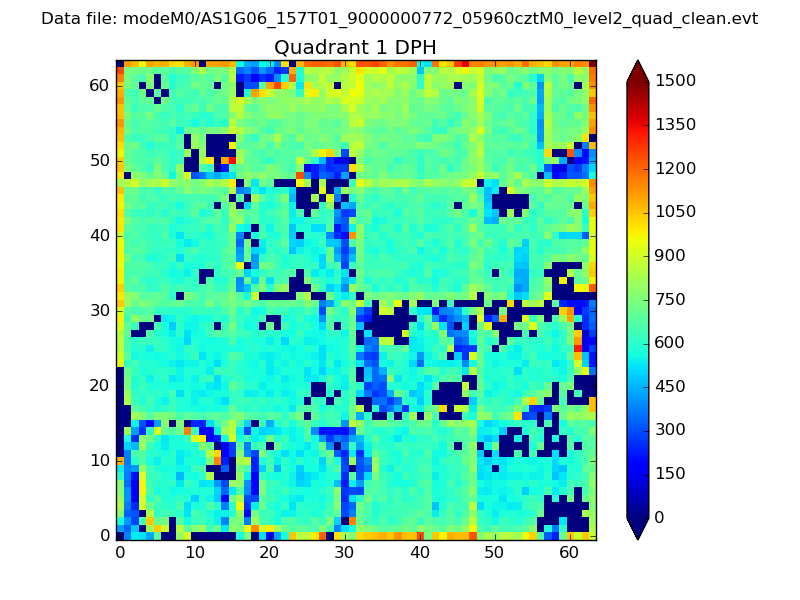 |
Quadrant B |
|---|---|---|---|
| Quadrant D | 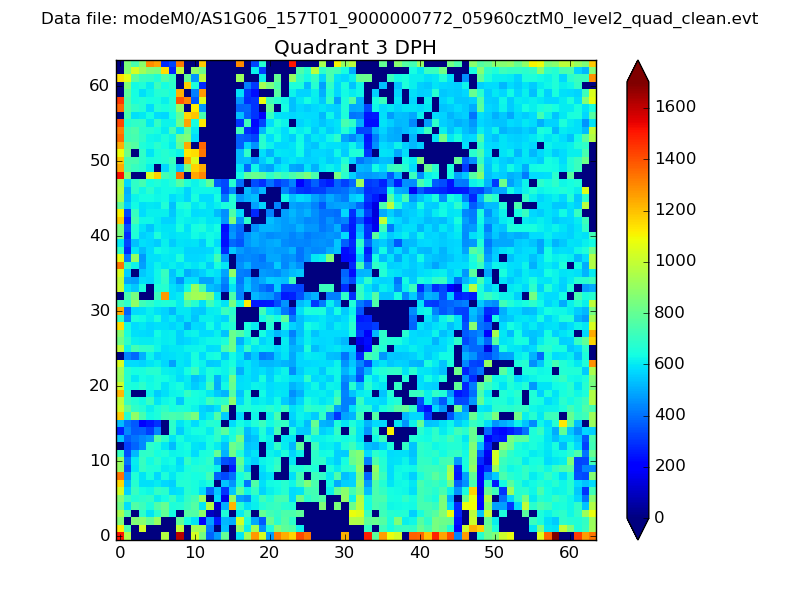 |
 |
Quadrant C |
| Plot type | Count rate plots | Images |
|---|---|---|
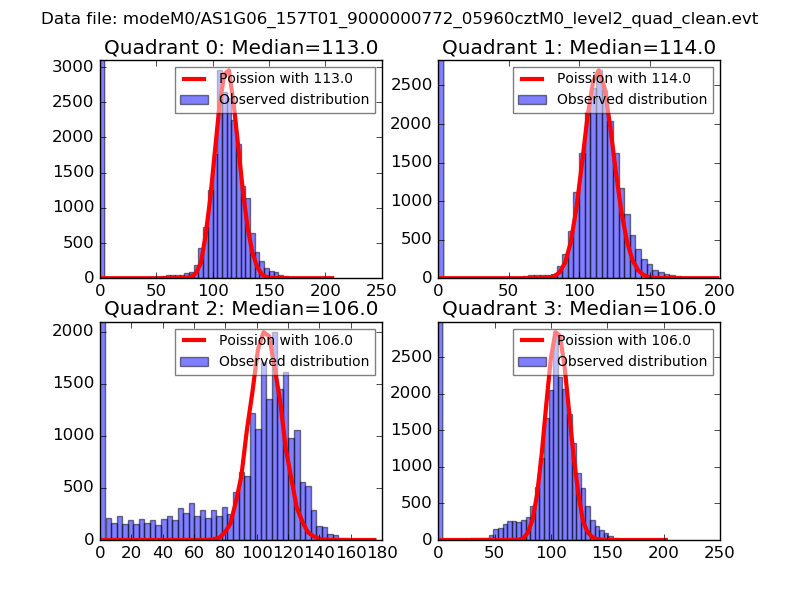
| Comparison with Poisson distribution Blue bars denote a histogram of data divided into 1 sec bins. Red curve is a Poisson curve with rate = median count rate of data. |
 |
 |
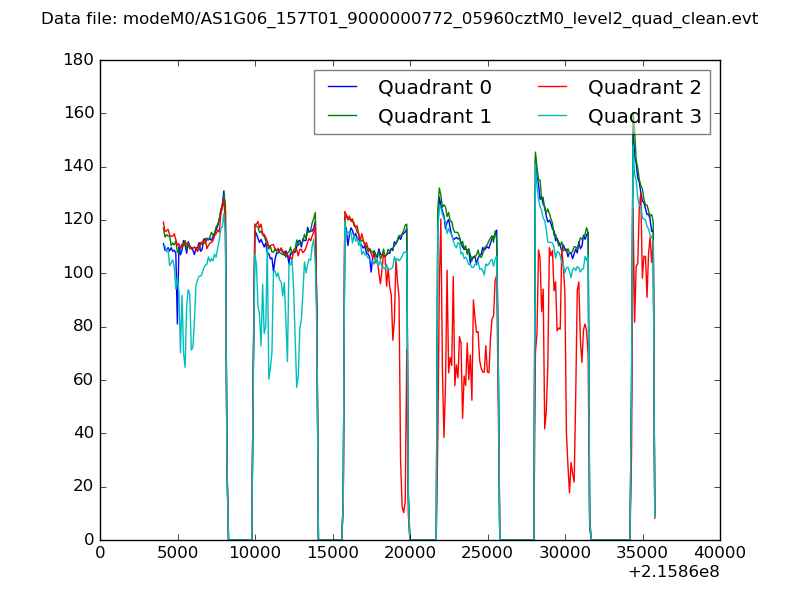
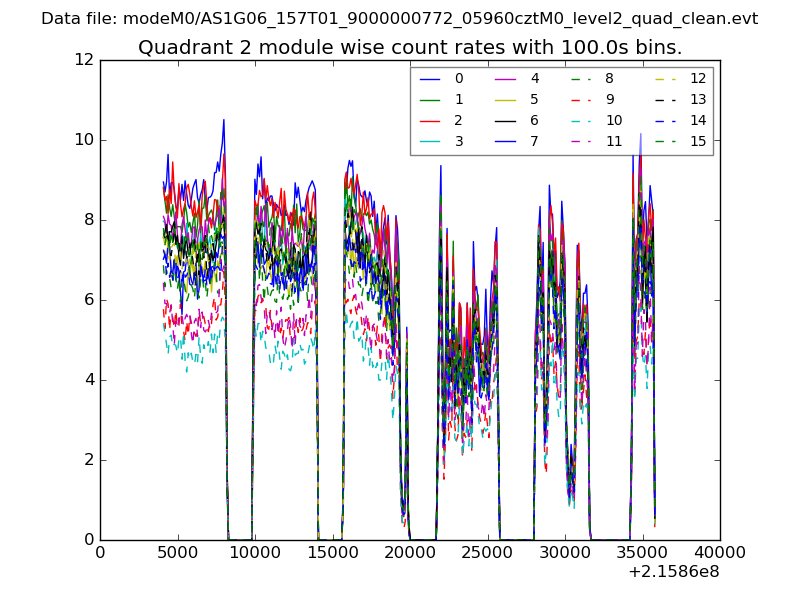
| Quadrant-wise count rates Data is divided into 100 sec bins |
 |
|
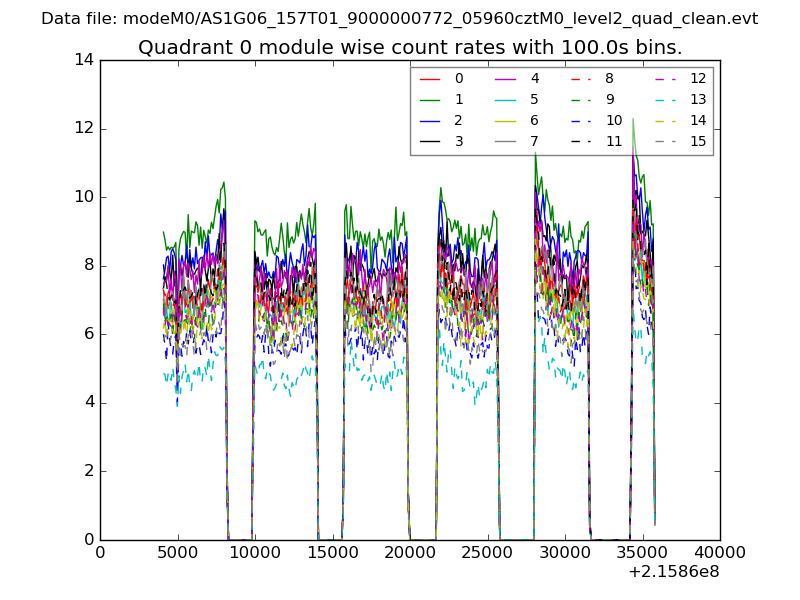
| Module-wise count rates for Quadrant A Data is divided into 100 sec bins |
 |
 |
| Module-wise count rates for Quadrant B Data is divided into 100 sec bins |
 |
 |
| Module-wise count rates for Quadrant C Data is divided into 100 sec bins |
 |
 |
| Module-wise count rates for Quadrant D Data is divided into 100 sec bins |
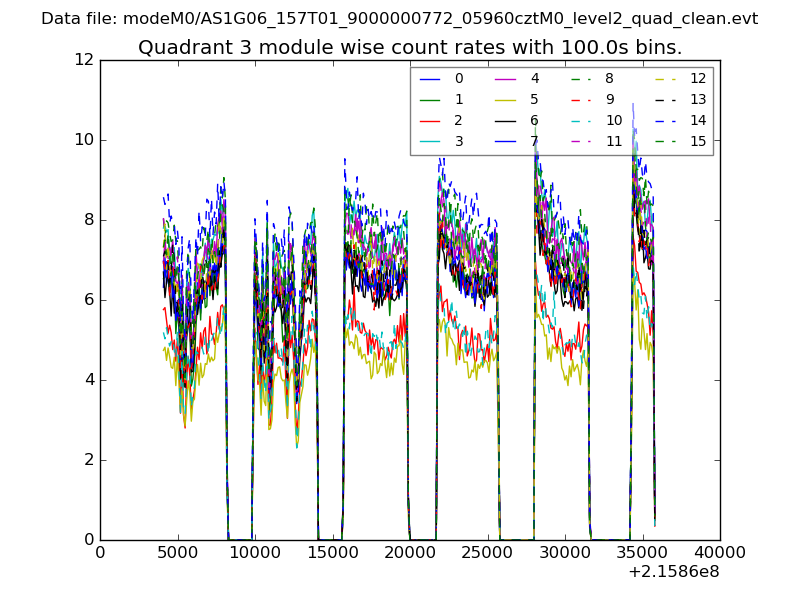 |
 |
| Parameter | Plot |
|---|---|
| CZT HV Monitor | 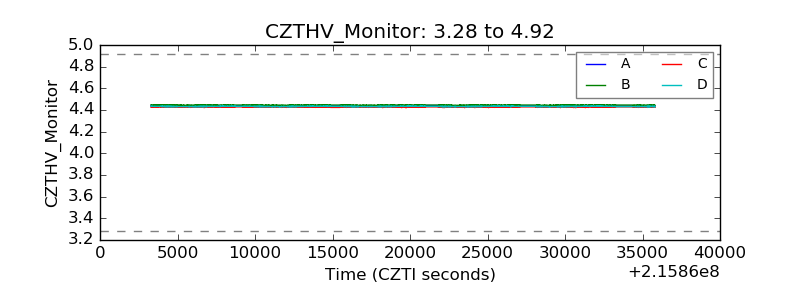 |
| D_VDD | 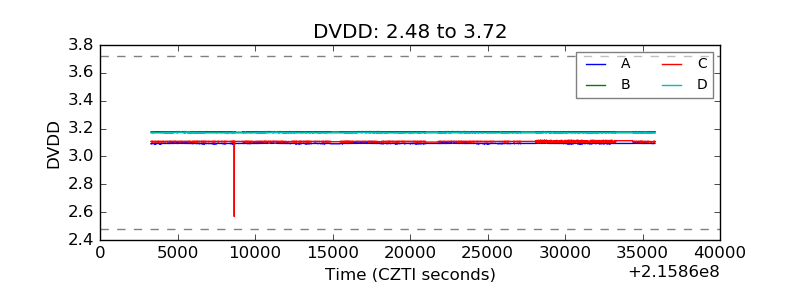 |
| Temperature 1 | 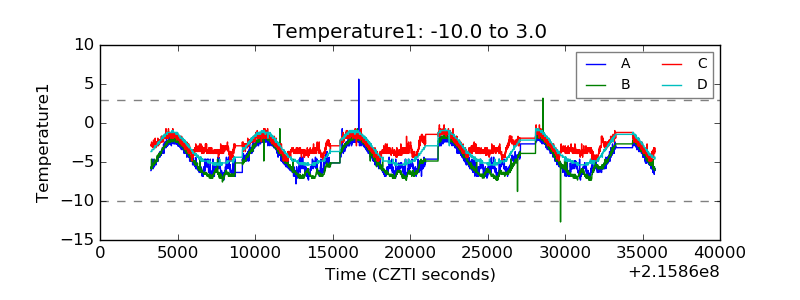 |
| Veto HV Monitor | 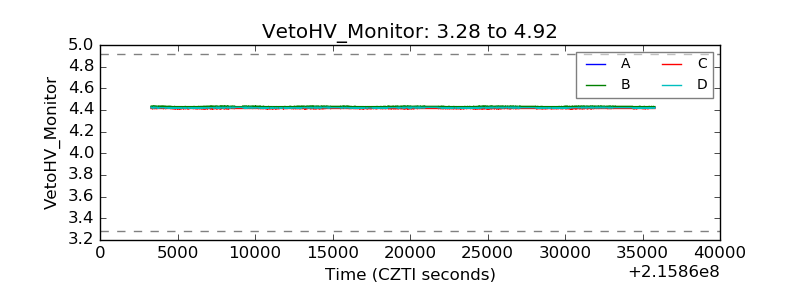 |
| Veto LLD | 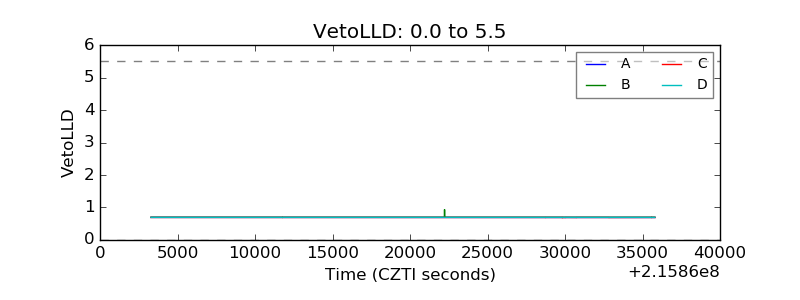 |
| Alpha Counter | 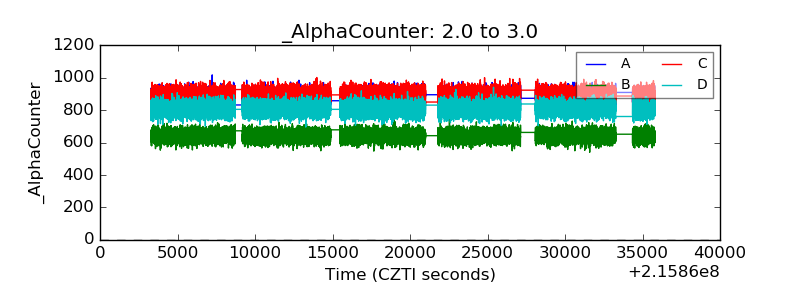 |
| _CPM_Rate | 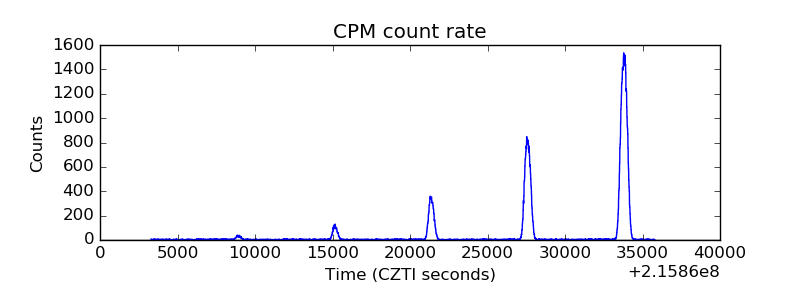 |
| CZT Counter | 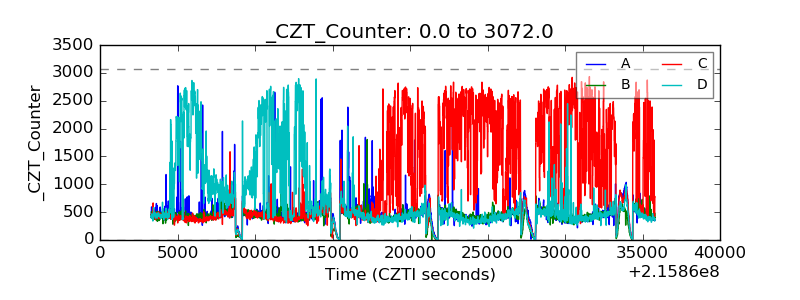 |
| +2.5 Volts monitor |  |
| +5 Volts monitor |  |
| _ROLL_ROT | 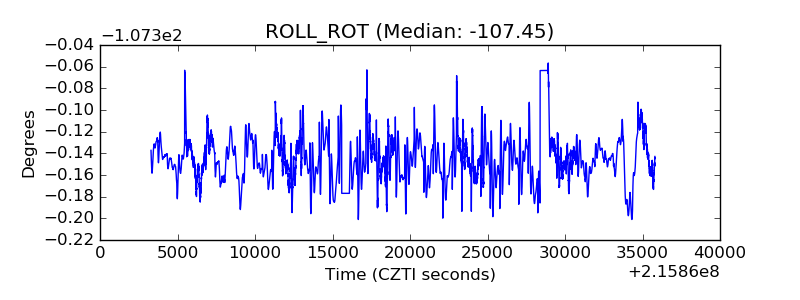 |
| _Roll_DEC | 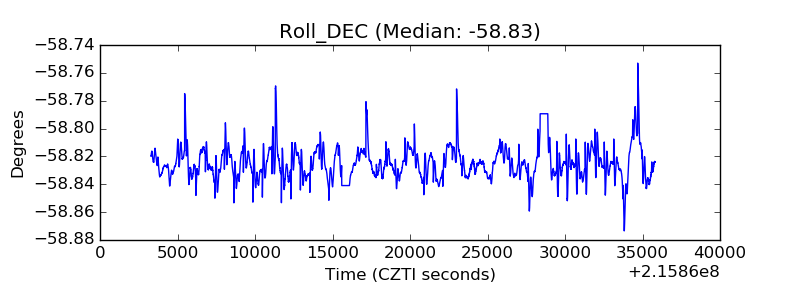 |
| _Roll_RA | 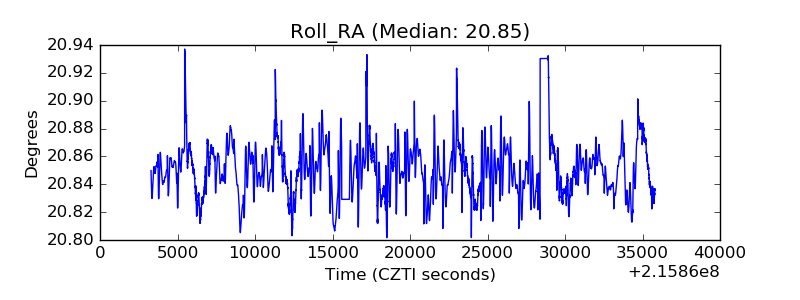 |
| Veto Counter |  |