| Param | Original file | Final file |
|---|---|---|
| Filename | modeM0/AS1G06_157T01_9000000772_05961cztM0_level2.evt | modeM0/AS1G06_157T01_9000000772_05961cztM0_level2_quad_clean.evt |
| Size (bytes) | 3,965,460,480 | 554,509,440 |
| Size | 3.7 GB | 528.8 MB |
| Events in quadrant A | 23,173,957 | 3,571,415 |
| Events in quadrant B | 20,696,521 | 3,628,832 |
| Events in quadrant C | 43,185,220 | 3,166,015 |
| Events in quadrant D | 30,021,736 | 3,352,400 |
| Mode M9 | |||
|---|---|---|---|
| Quadrant | BADHDUFLAG | Total packets | Discarded packets |
| A | 0 | 50 | 0 |
| B | 0 | 50 | 0 |
| C | 0 | 50 | 0 |
| D | 0 | 50 | 0 |
| Mode M0 | |||
|---|---|---|---|
| Quadrant | BADHDUFLAG | Total packets | Discarded packets |
| A | 0 | 100222 | 7 |
| B | 0 | 92891 | 7 |
| C | 0 | 160520 | 7 |
| D | 0 | 121549 | 7 |
| Mode SS | |||
|---|---|---|---|
| Quadrant | BADHDUFLAG | Total packets | Discarded packets |
| A | 0 | 912 | 0 |
| B | 0 | 912 | 0 |
| C | 0 | 912 | 0 |
| D | 0 | 912 | 0 |
| Quadrant | Total seconds | Saturated seconds | Saturation percentage |
|---|---|---|---|
| A | 44749 | 1251 | 2.795593% |
| B | 44749 | 832 | 1.859259% |
| C | 44749 | 9475 | 21.173658% |
| D | 44749 | 3039 | 6.791213% |
Noise dominated data is calculated using 1-second bins in cleaned event files. If a bin has >2000 counts, and if more than 50% of those come from <1% of pixels, then it is considered to be noise-dominated and hence unusable.
| Quadrant | # 1 sec bins | Bins with >0 counts | Bins with >2000 counts | High rate bins dominated by noise | Noise dominated (total time) | Noise dominated (detector-on time) | Marked lightcurve |
|---|---|---|---|---|---|---|---|
| A | 49959 | 44753 | 333 | 333 | 0.67% | 0.74% | 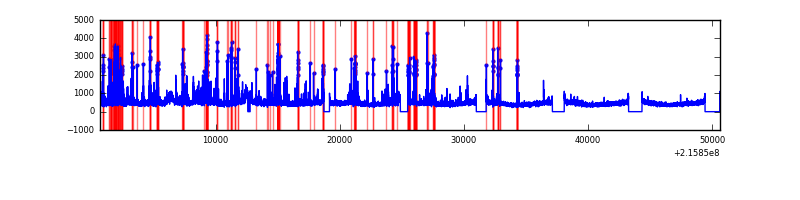 |
| B | 49959 | 44754 | 5 | 5 | 0.01% | 0.01% | 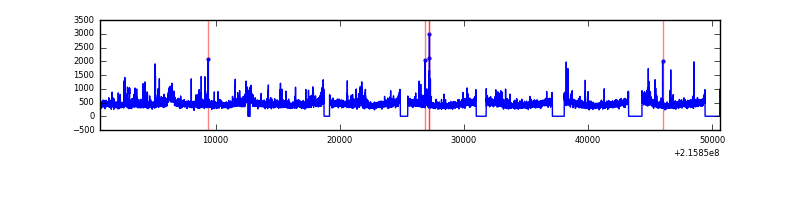 |
| C | 49959 | 44756 | 7335 | 7335 | 14.68% | 16.39% | 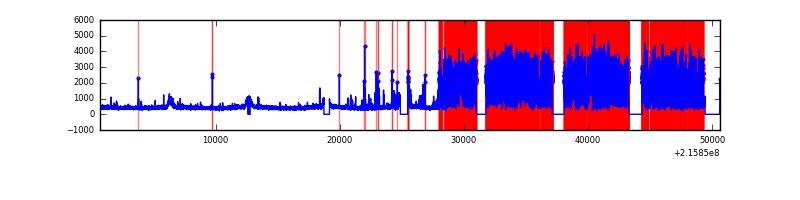 |
| D | 49959 | 44754 | 2552 | 2552 | 5.11% | 5.70% | 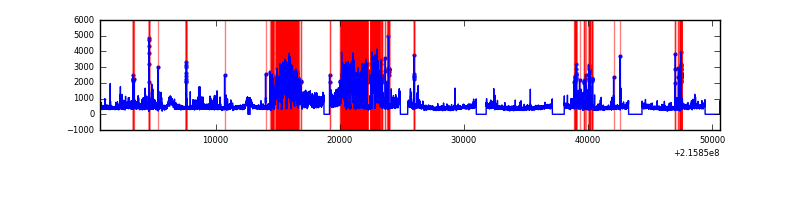 |
Top three noisy pixels from each quadrant. If the there are fewer than three noisy pixels in the level2.evt file, extra rows are filled as -1
| Pixel properties | Quadrant properties | ||||||
|---|---|---|---|---|---|---|---|
| Quadrant | DetID | PixID | Counts | Sigma | Mean | Median | Sigma |
| A | 4 | 2 | 2748874 | 2675.91 | 5047 | 4924 | 1025.4 |
| A | 13 | 251 | 760039 | 736.39 | 5047 | 4924 | 1025.4 |
| A | 8 | 192 | 171727 | 162.67 | 5047 | 4924 | 1025.4 |
| B | 4 | 81 | 201095 | 201.3 | 5129 | 5005 | 974.1 |
| B | 15 | 204 | 187371 | 187.21 | 5129 | 5005 | 974.1 |
| B | 0 | 219 | 164778 | 164.02 | 5129 | 5005 | 974.1 |
| C | 9 | 247 | 25468025 | 24479.37 | 4500 | 4509 | 1040.2 |
| C | 9 | 54 | 74273 | 67.07 | 4500 | 4509 | 1040.2 |
| C | 14 | 206 | 37778 | 31.98 | 4500 | 4509 | 1040.2 |
| D | 1 | 20 | 9101177 | 7678.89 | 4869 | 4721 | 1184.6 |
| D | 10 | 172 | 1213002 | 1019.99 | 4869 | 4721 | 1184.6 |
| D | 2 | 63 | 621622 | 520.76 | 4869 | 4721 | 1184.6 |
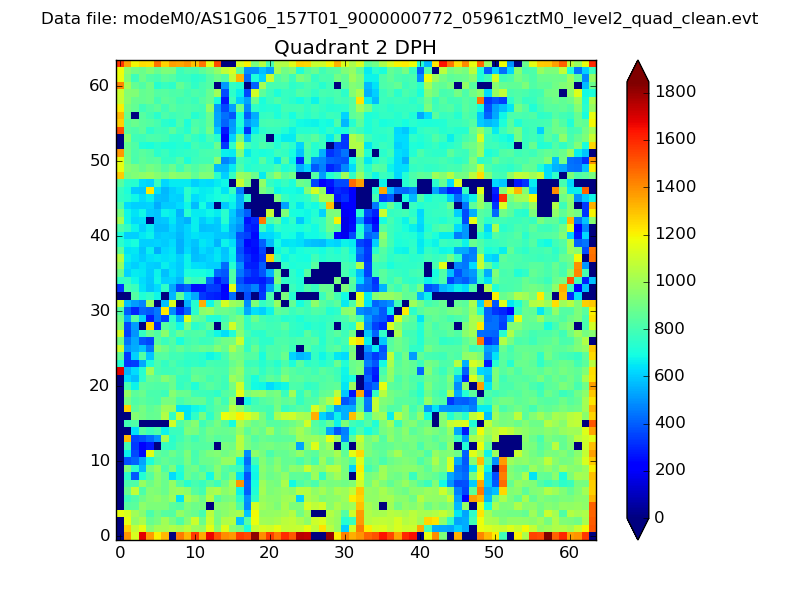
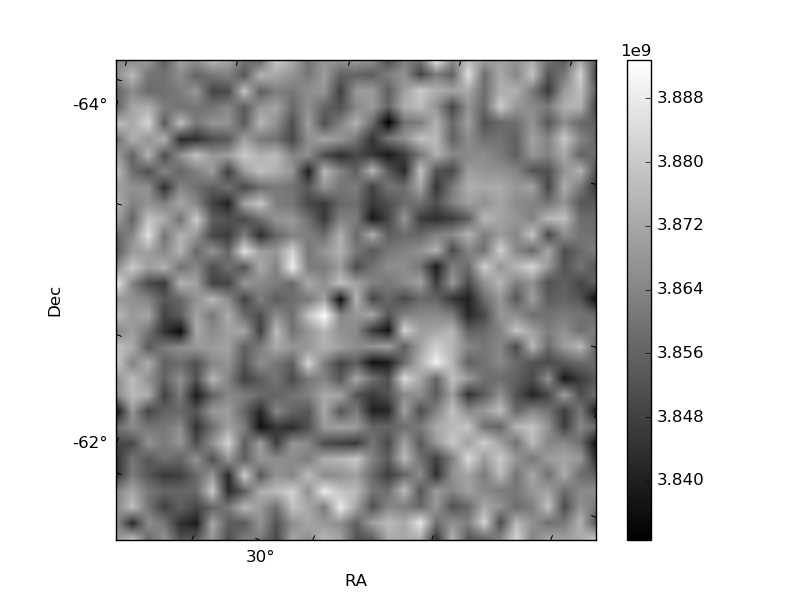
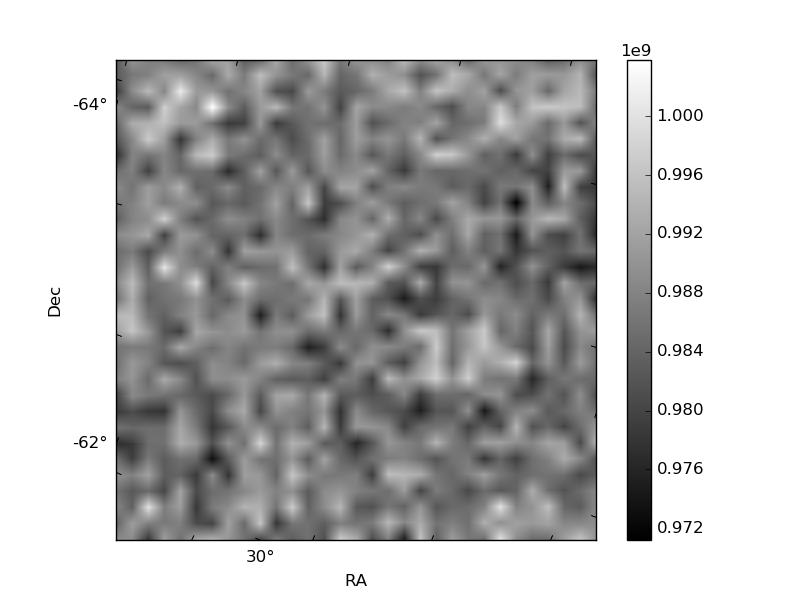
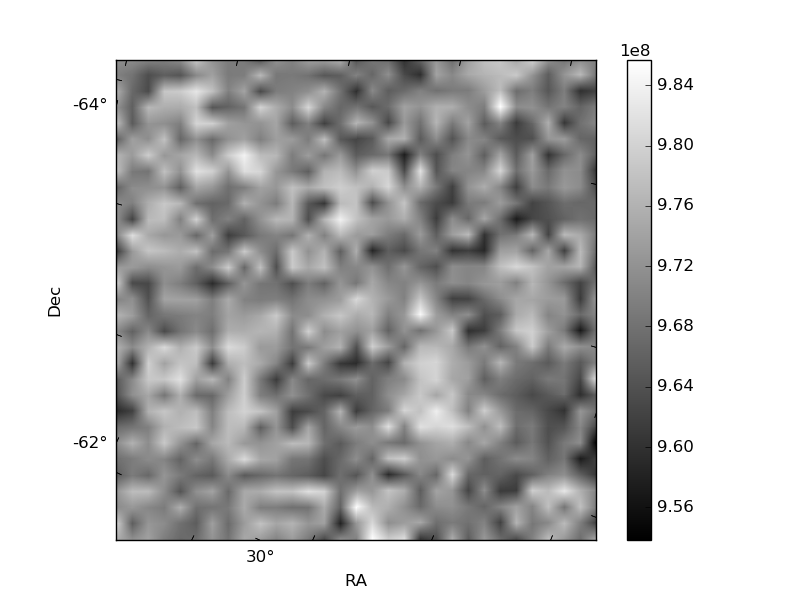
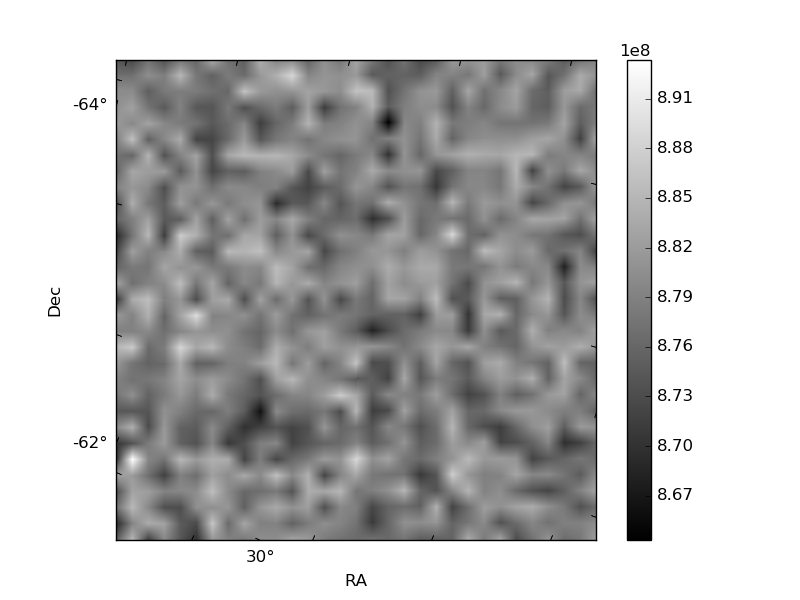
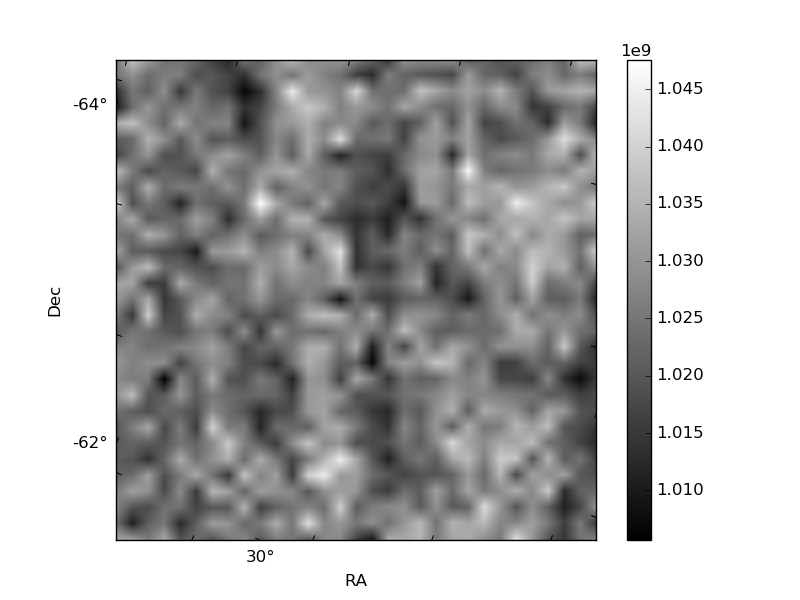
Histogram calculated using DETX and DETY for each event in the final _common_clean file
| Quadrant A | 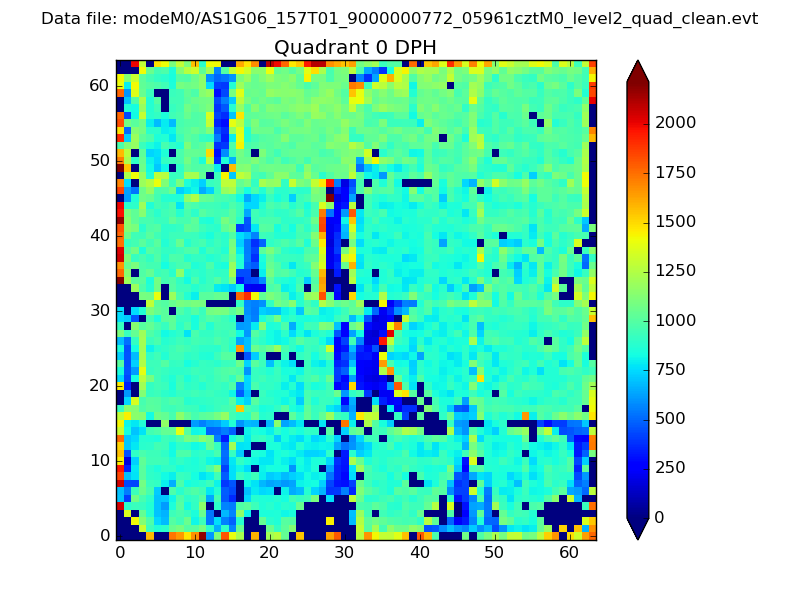 |
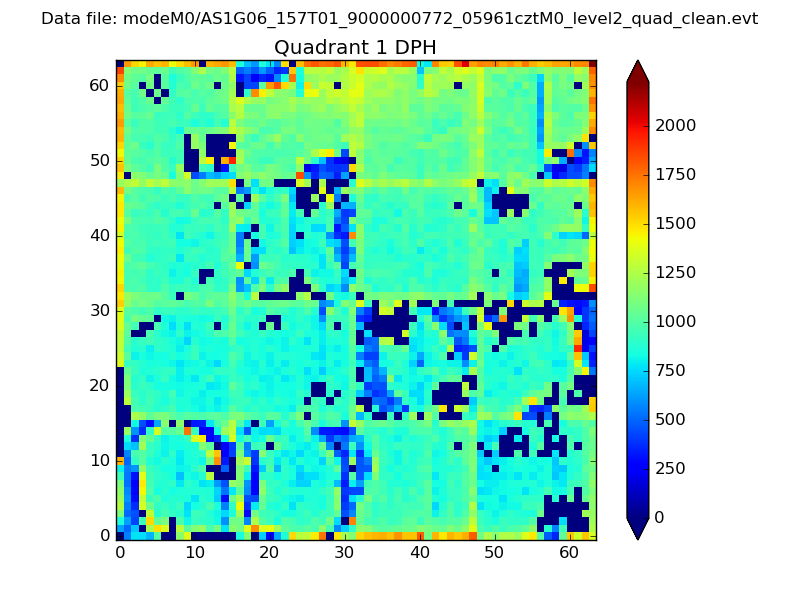 |
Quadrant B |
|---|---|---|---|
| Quadrant D | 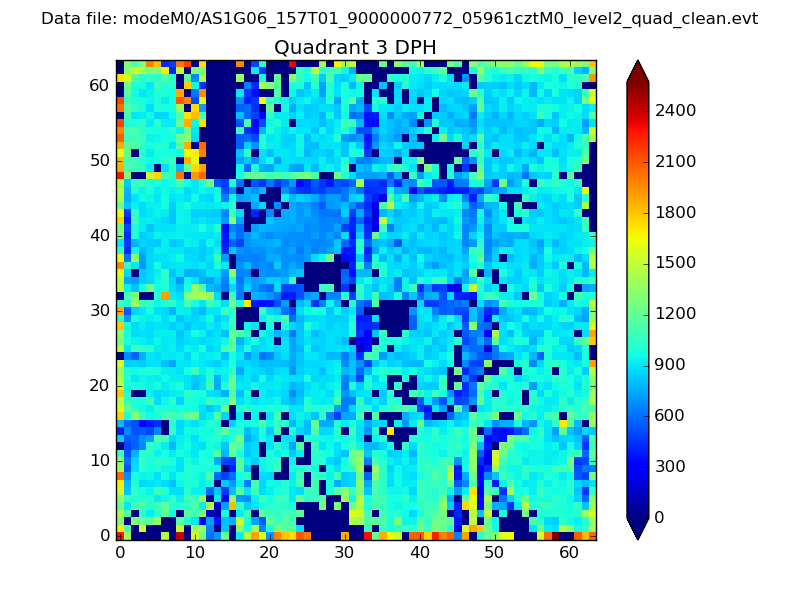 |
 |
Quadrant C |
| Plot type | Count rate plots | Images |
|---|---|---|
| Comparison with Poisson distribution Blue bars denote a histogram of data divided into 1 sec bins. Red curve is a Poisson curve with rate = median count rate of data. |
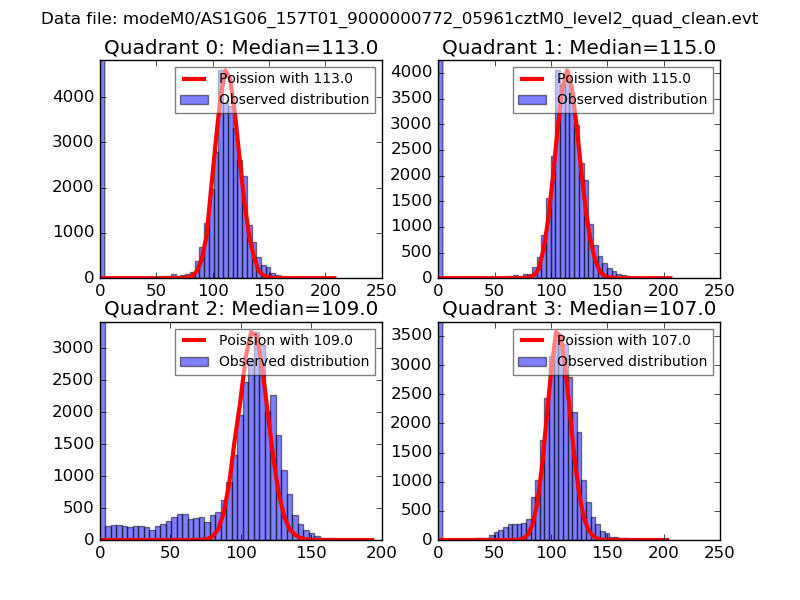 |
 |
| Quadrant-wise count rates Data is divided into 100 sec bins |
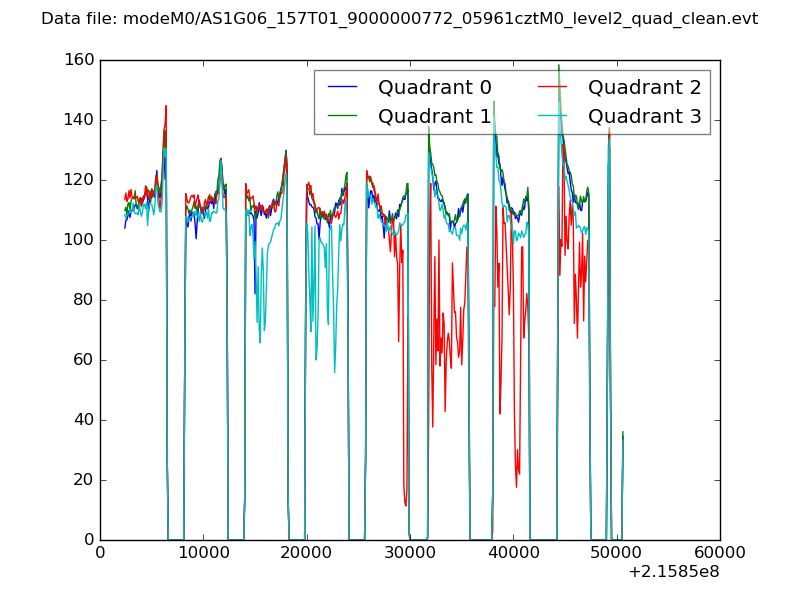 |
|
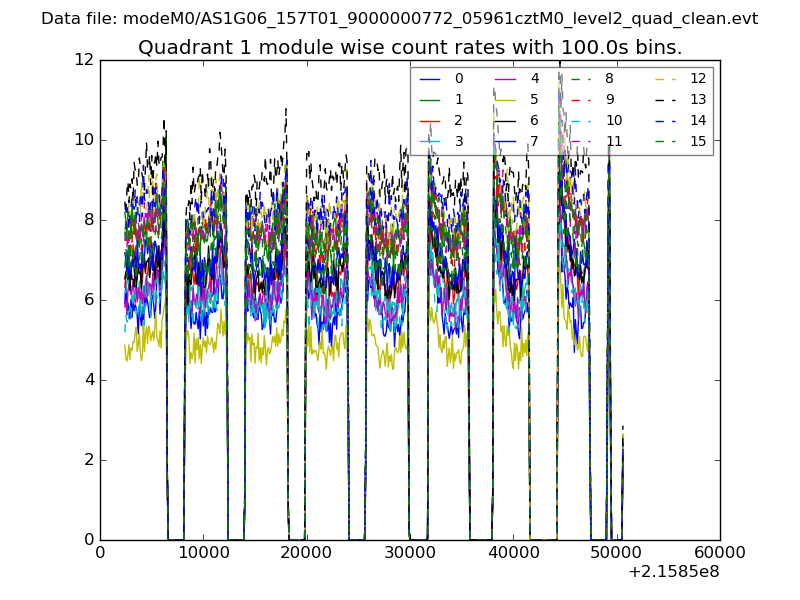
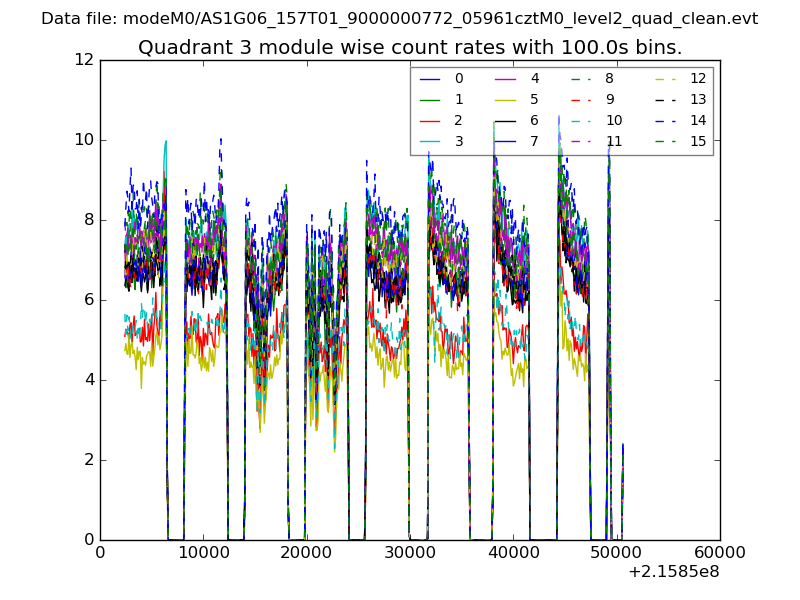
| Module-wise count rates for Quadrant A Data is divided into 100 sec bins |
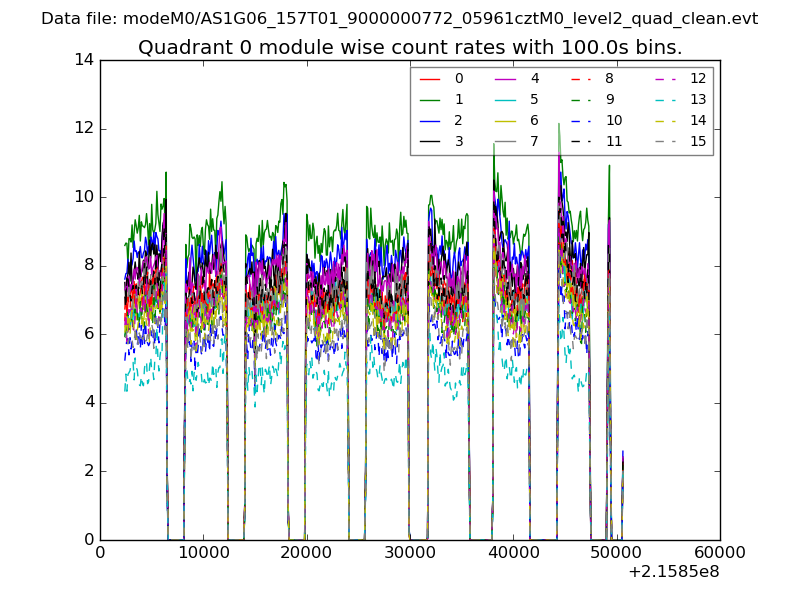 |
 |
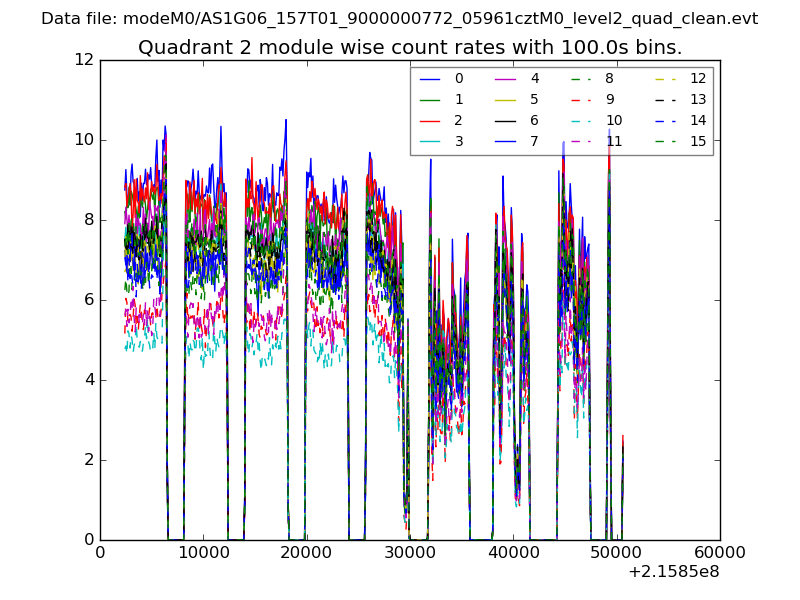
| Module-wise count rates for Quadrant B Data is divided into 100 sec bins |
 |
 |
| Module-wise count rates for Quadrant C Data is divided into 100 sec bins |
 |
 |
| Module-wise count rates for Quadrant D Data is divided into 100 sec bins |
 |
 |
| Parameter | Plot |
|---|---|
| CZT HV Monitor | 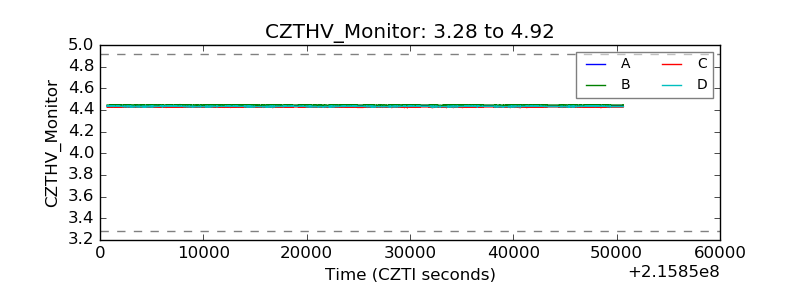 |
| D_VDD | 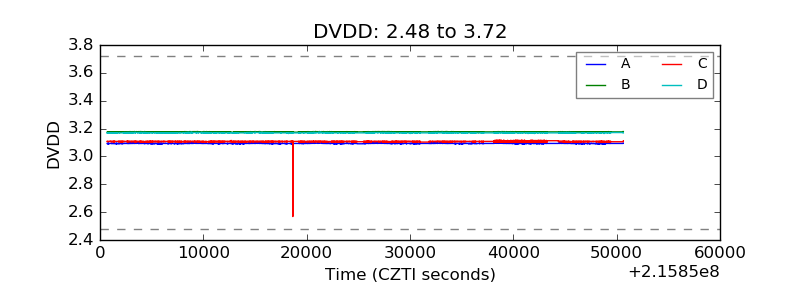 |
| Temperature 1 | 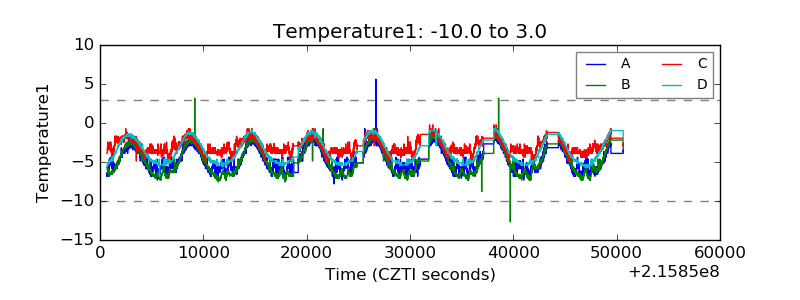 |
| Veto HV Monitor | 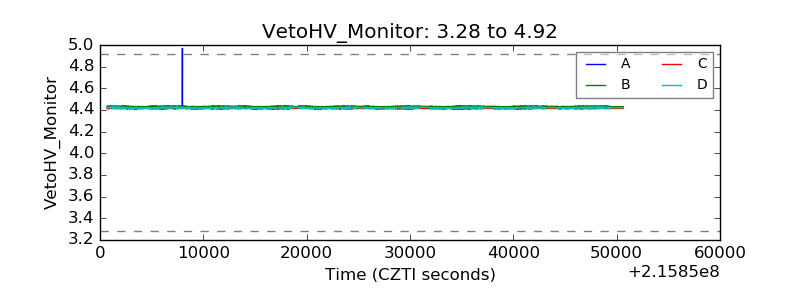 |
| Veto LLD | 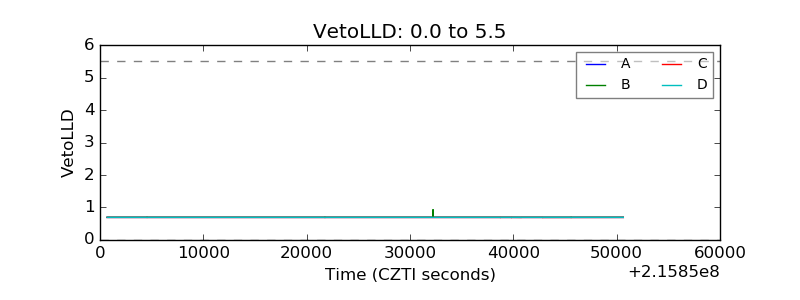 |
| Alpha Counter | 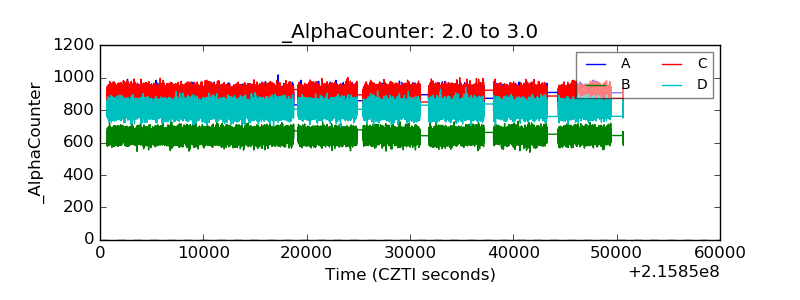 |
| _CPM_Rate | 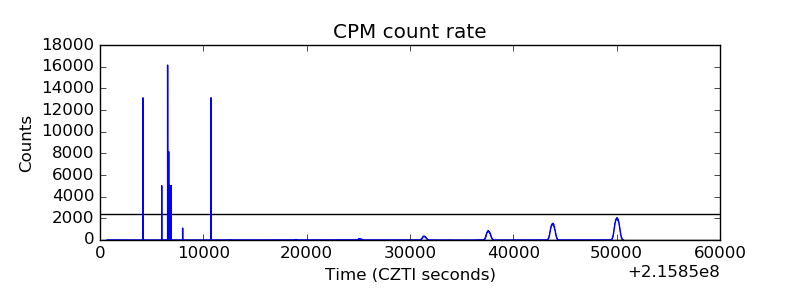 |
| CZT Counter | 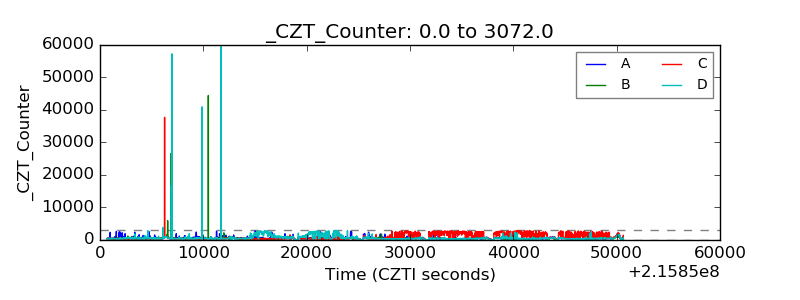 |
| +2.5 Volts monitor |  |
| +5 Volts monitor |  |
| _ROLL_ROT | 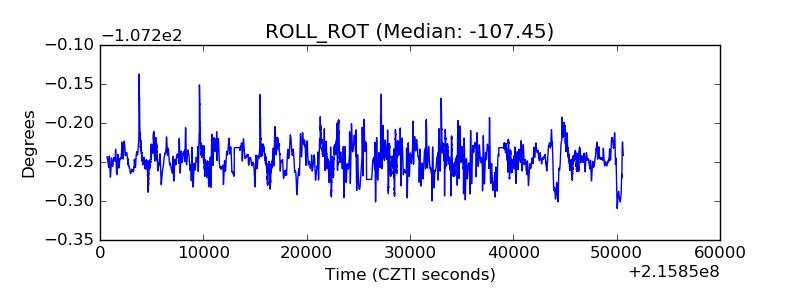 |
| _Roll_DEC | 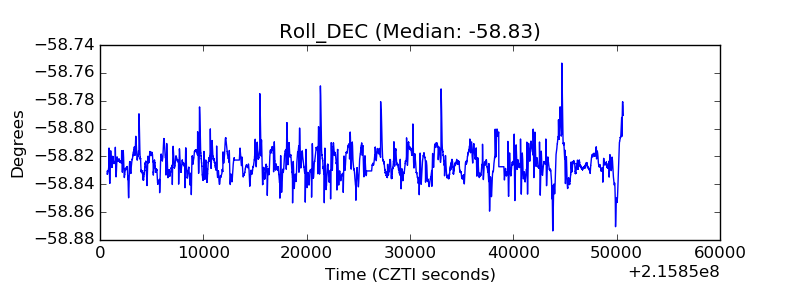 |
| _Roll_RA | 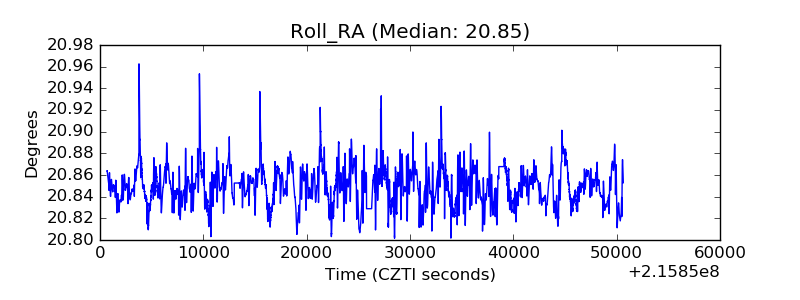 |
| Veto Counter | 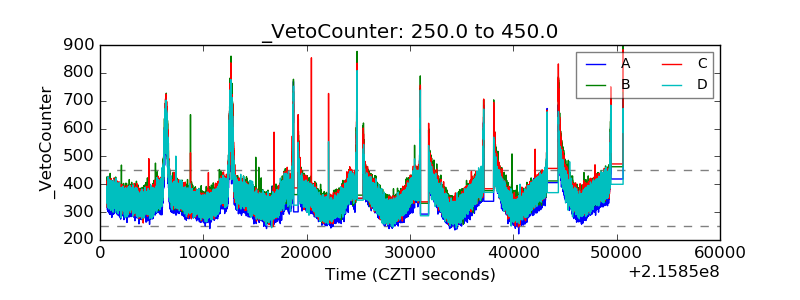 |