| Param | Original file | Final file |
|---|---|---|
| Filename | modeM0/AS1G06_086T01_9000000774_05962cztM0_level2.evt | modeM0/AS1G06_086T01_9000000774_05962cztM0_level2_quad_clean.evt |
| Size (bytes) | 465,148,800 | 89,308,800 |
| Size | 443.6 MB | 85.2 MB |
| Events in quadrant A | 2,177,224 | 617,266 |
| Events in quadrant B | 2,278,898 | 638,152 |
| Events in quadrant C | 7,110,304 | 515,269 |
| Events in quadrant D | 2,182,745 | 584,768 |
| Mode SS | |||
|---|---|---|---|
| Quadrant | BADHDUFLAG | Total packets | Discarded packets |
| A | 0 | 102 | 0 |
| B | 0 | 102 | 0 |
| C | 0 | 102 | 0 |
| D | 0 | 102 | 0 |
| Mode M9 | |||
|---|---|---|---|
| Quadrant | BADHDUFLAG | Total packets | Discarded packets |
| A | 0 | 12 | 0 |
| B | 0 | 12 | 0 |
| C | 0 | 12 | 0 |
| D | 0 | 12 | 0 |
| Mode M0 | |||
|---|---|---|---|
| Quadrant | BADHDUFLAG | Total packets | Discarded packets |
| A | 0 | 10092 | 2 |
| B | 0 | 10251 | 1 |
| C | 0 | 24545 | 1 |
| D | 0 | 10360 | 1 |
| Quadrant | Total seconds | Saturated seconds | Saturation percentage |
|---|---|---|---|
| A | 4966 | 19 | 0.382602% |
| B | 4966 | 18 | 0.362465% |
| C | 4966 | 1617 | 32.561418% |
| D | 4966 | 22 | 0.443012% |
Noise dominated data is calculated using 1-second bins in cleaned event files. If a bin has >2000 counts, and if more than 50% of those come from <1% of pixels, then it is considered to be noise-dominated and hence unusable.
| Quadrant | # 1 sec bins | Bins with >0 counts | Bins with >2000 counts | High rate bins dominated by noise | Noise dominated (total time) | Noise dominated (detector-on time) | Marked lightcurve |
|---|---|---|---|---|---|---|---|
| A | 6236 | 4967 | 2 | 2 | 0.03% | 0.04% | 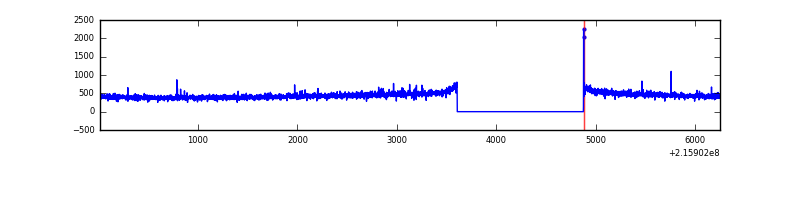 |
| B | 6236 | 4967 | 0 | 0 | 0.00% | 0.00% | 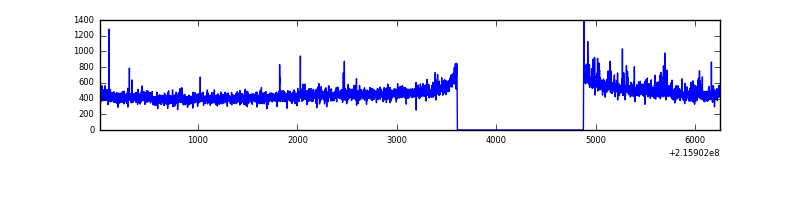 |
| C | 6236 | 4966 | 1337 | 1337 | 21.44% | 26.92% | 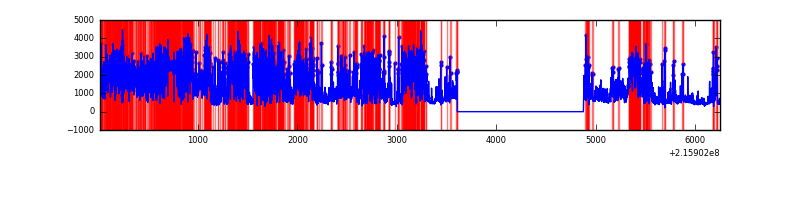 |
| D | 6236 | 4967 | 8 | 8 | 0.13% | 0.16% | 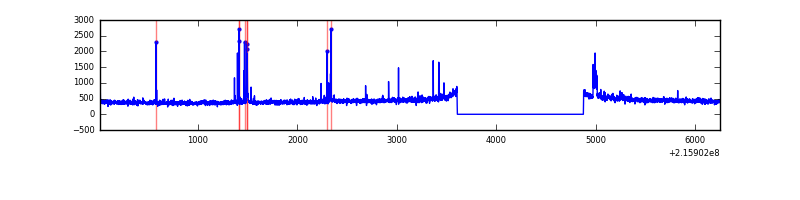 |
Top three noisy pixels from each quadrant. If the there are fewer than three noisy pixels in the level2.evt file, extra rows are filled as -1
| Pixel properties | Quadrant properties | ||||||
|---|---|---|---|---|---|---|---|
| Quadrant | DetID | PixID | Counts | Sigma | Mean | Median | Sigma |
| A | 13 | 251 | 9523 | 78.9 | 560 | 549 | 113.7 |
| A | 0 | 226 | 5358 | 42.28 | 560 | 549 | 113.7 |
| A | 12 | 194 | 5343 | 42.15 | 560 | 549 | 113.7 |
| B | 7 | 221 | 24967 | 226.02 | 572 | 560 | 108.0 |
| B | 4 | 81 | 18034 | 161.82 | 572 | 560 | 108.0 |
| B | 12 | 111 | 10204 | 89.31 | 572 | 560 | 108.0 |
| C | 9 | 247 | 5224240 | 47164.51 | 477 | 479 | 110.8 |
| C | 8 | 128 | 9052 | 77.4 | 477 | 479 | 110.8 |
| C | 9 | 54 | 4845 | 39.42 | 477 | 479 | 110.8 |
| D | 2 | 206 | 56007 | 422.7 | 540 | 524 | 131.3 |
| D | 1 | 20 | 34091 | 255.73 | 540 | 524 | 131.3 |
| D | 8 | 195 | 31132 | 233.19 | 540 | 524 | 131.3 |
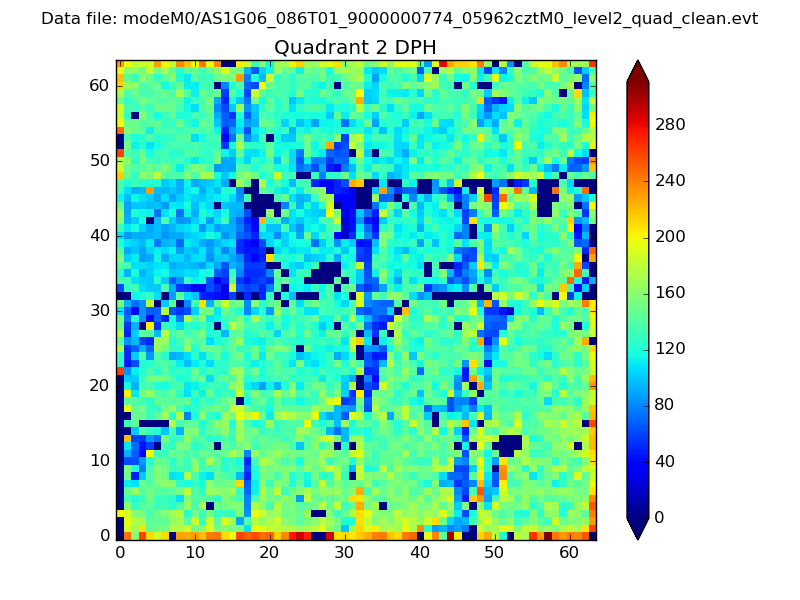
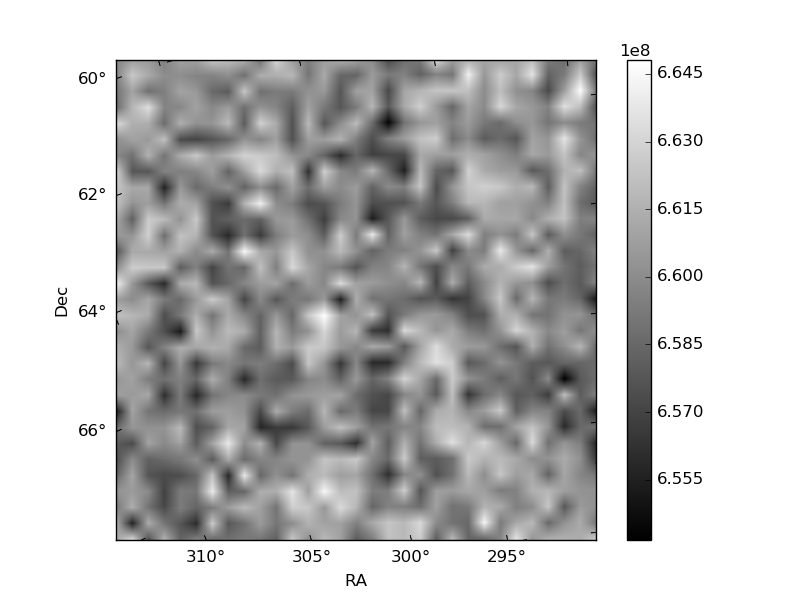
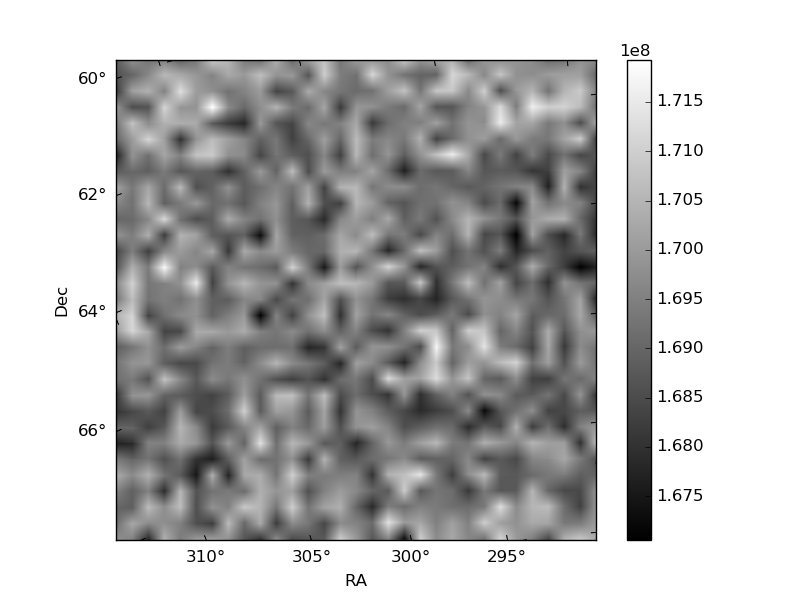
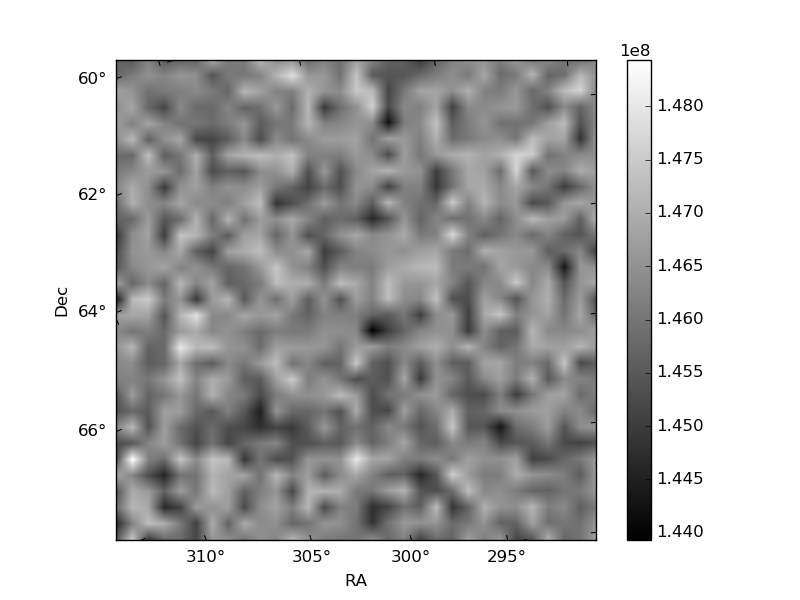
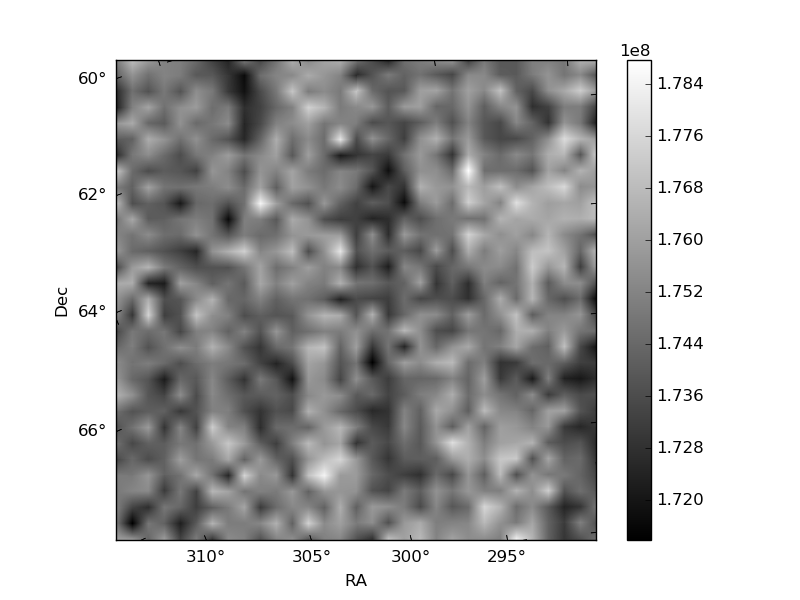
Histogram calculated using DETX and DETY for each event in the final _common_clean file
| Quadrant A | 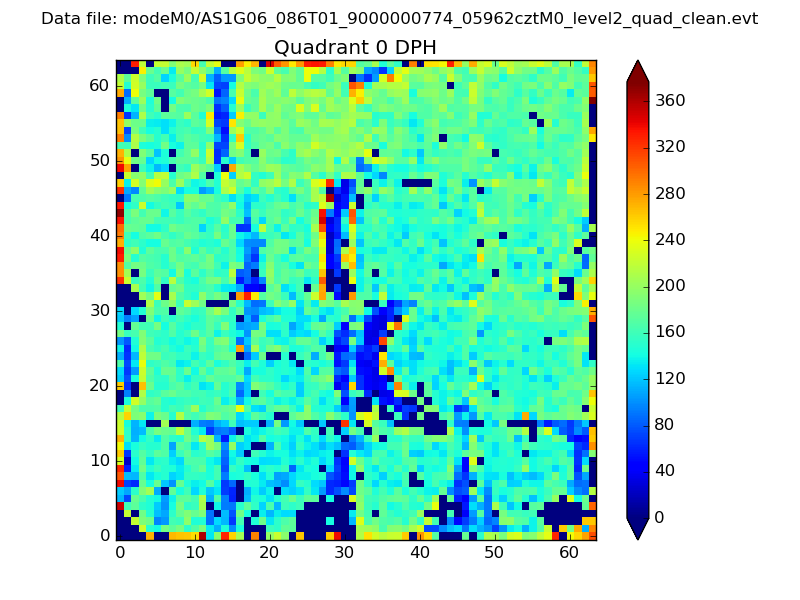 |
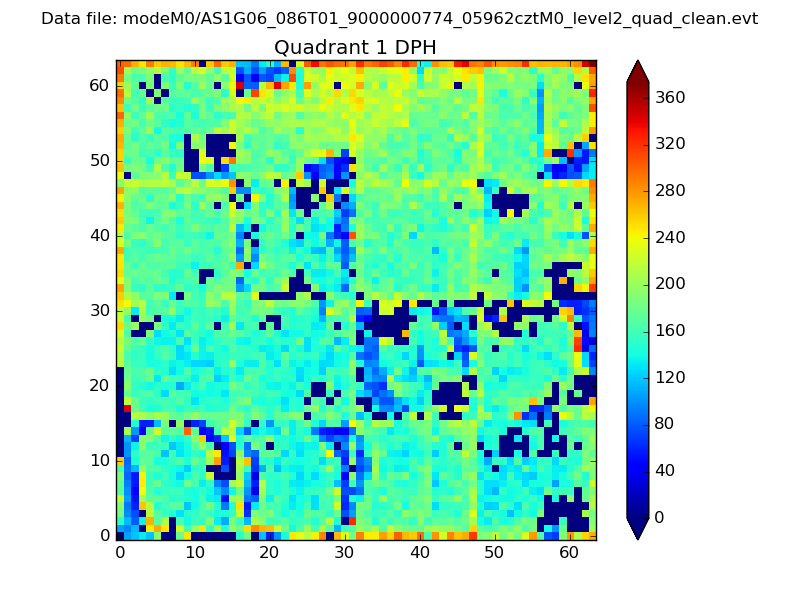 |
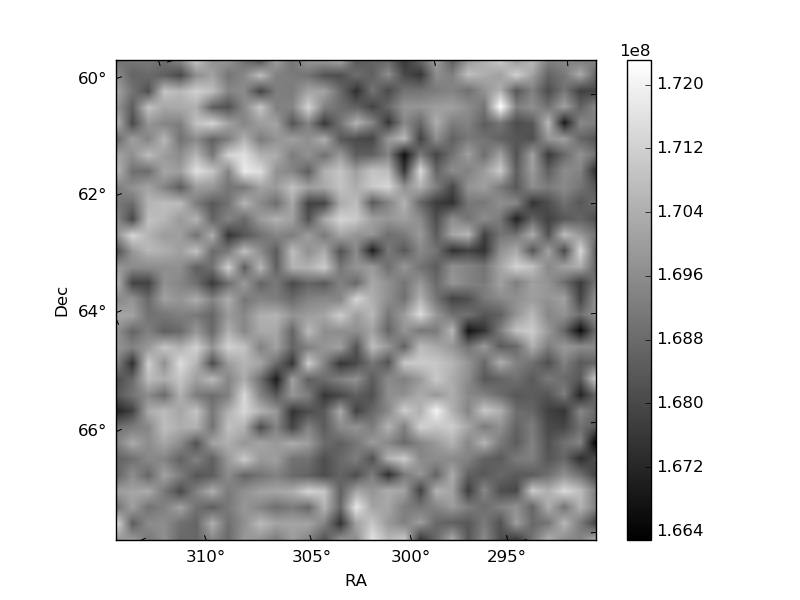
Quadrant B |
|---|---|---|---|
| Quadrant D | 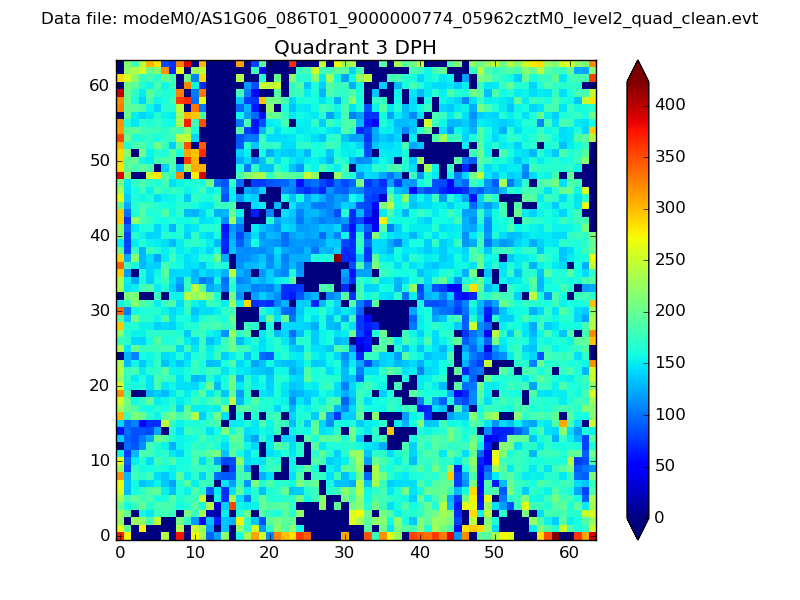 |
 |
Quadrant C |
| Plot type | Count rate plots | Images |
|---|---|---|
| Comparison with Poisson distribution Blue bars denote a histogram of data divided into 1 sec bins. Red curve is a Poisson curve with rate = median count rate of data. |
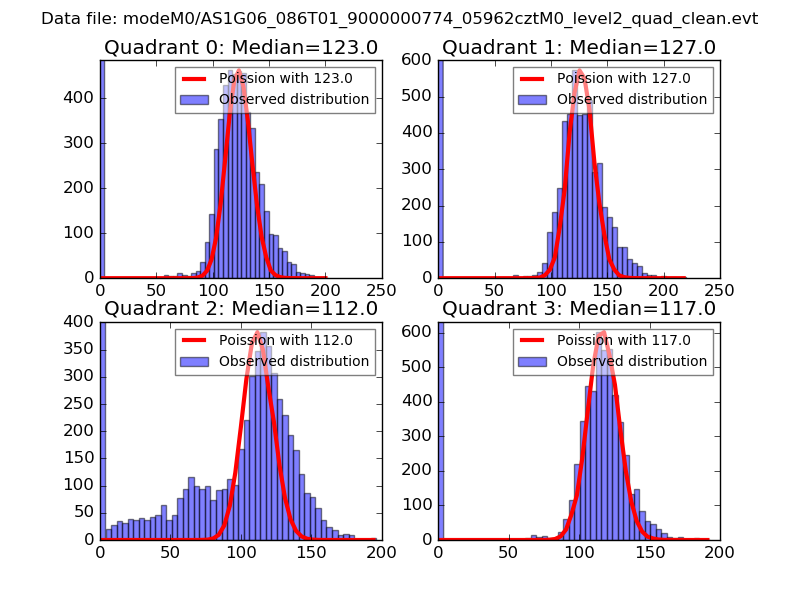 |
 |
| Quadrant-wise count rates Data is divided into 100 sec bins |
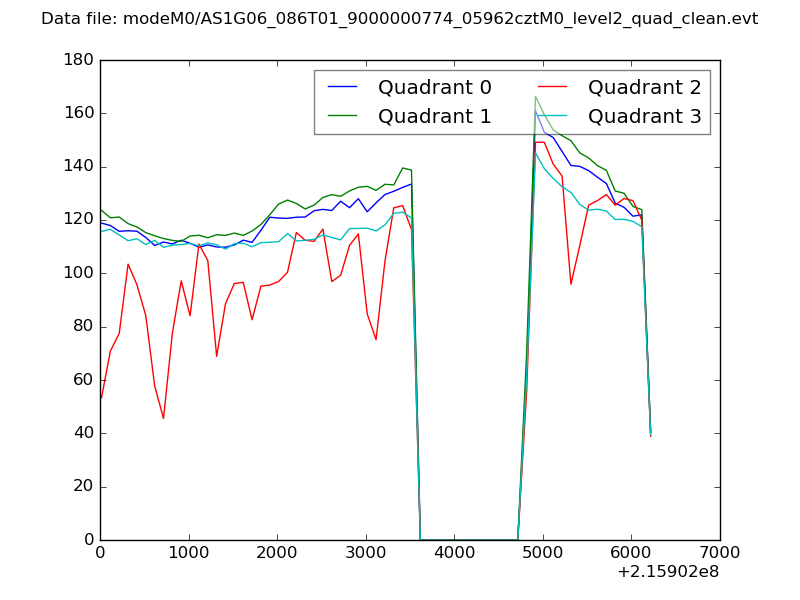 |
|
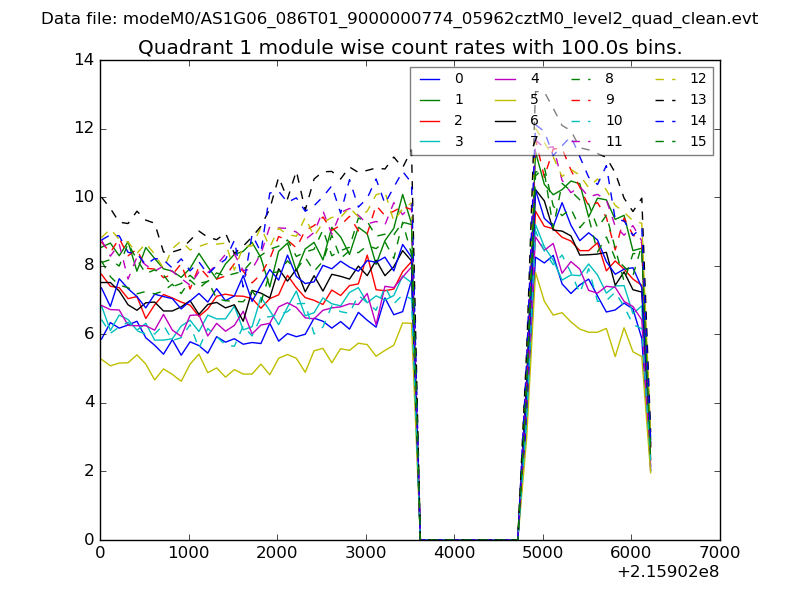
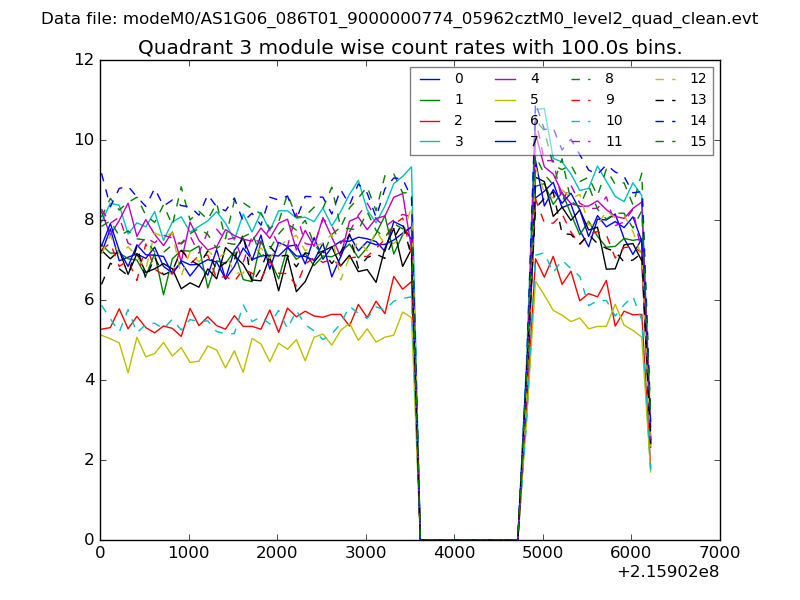
| Module-wise count rates for Quadrant A Data is divided into 100 sec bins |
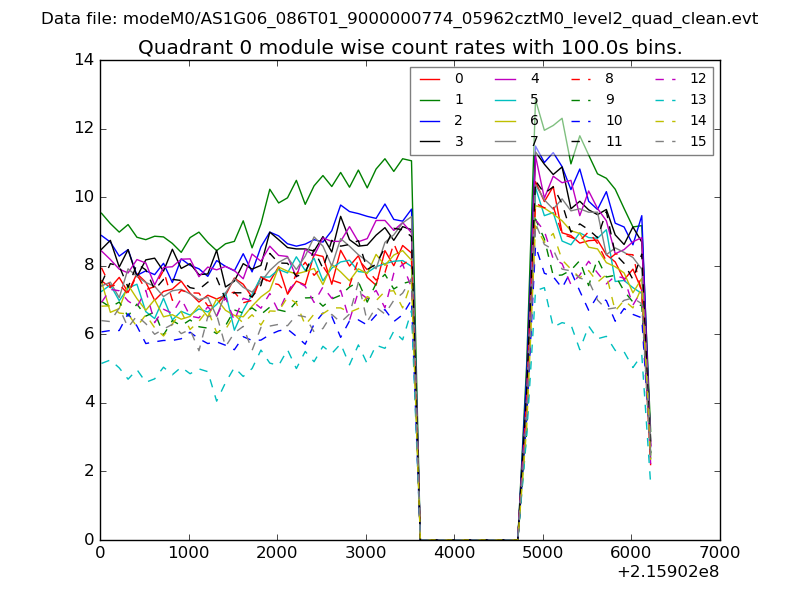 |
 |
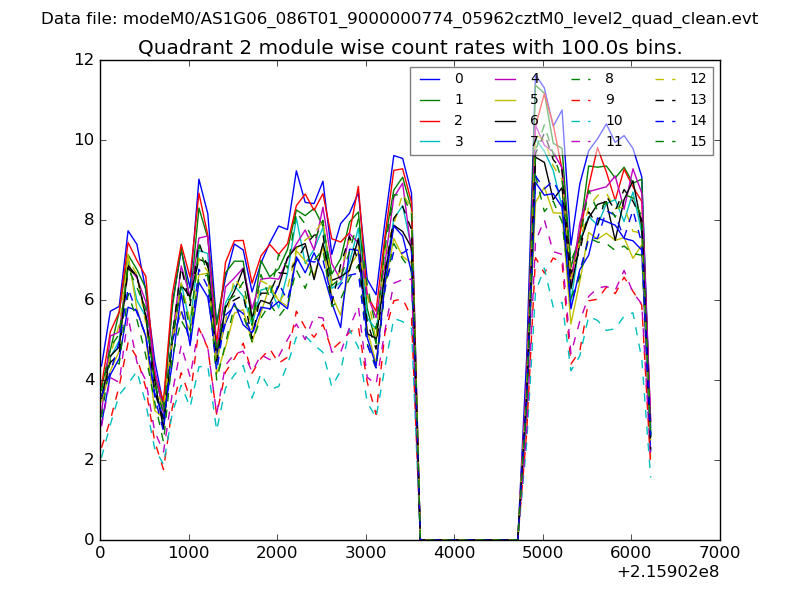
| Module-wise count rates for Quadrant B Data is divided into 100 sec bins |
 |
 |
| Module-wise count rates for Quadrant C Data is divided into 100 sec bins |
 |
 |
| Module-wise count rates for Quadrant D Data is divided into 100 sec bins |
 |
 |
| Parameter | Plot |
|---|---|
| CZT HV Monitor | 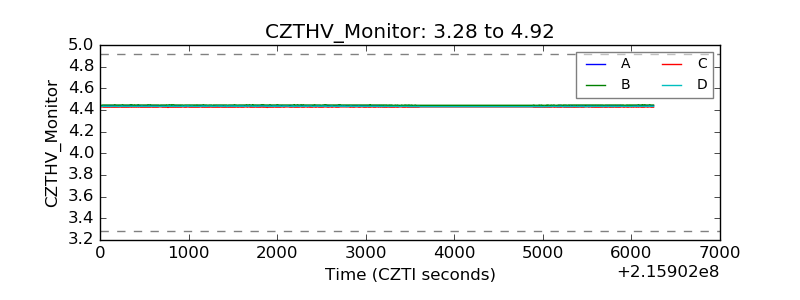 |
| D_VDD | 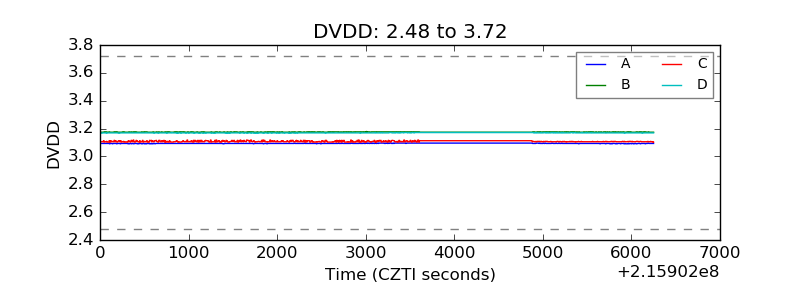 |
| Temperature 1 | 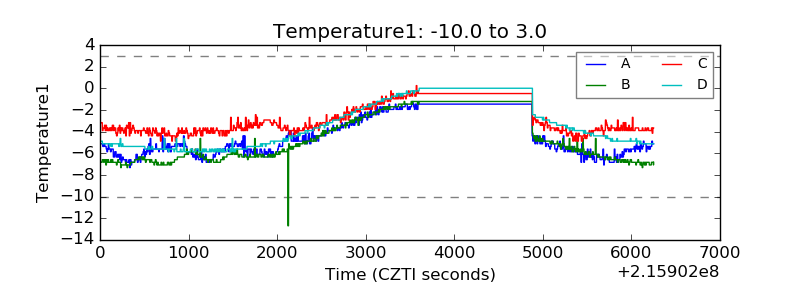 |
| Veto HV Monitor | 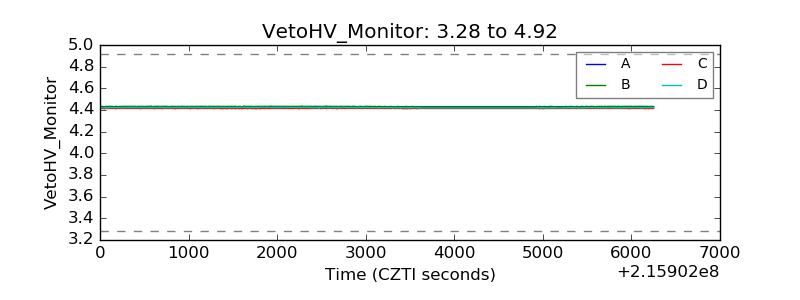 |
| Veto LLD | 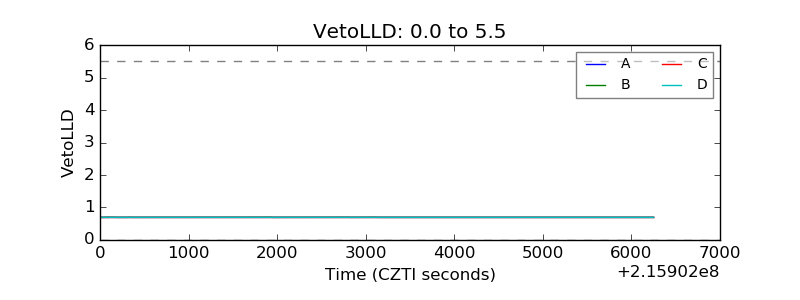 |
| Alpha Counter | 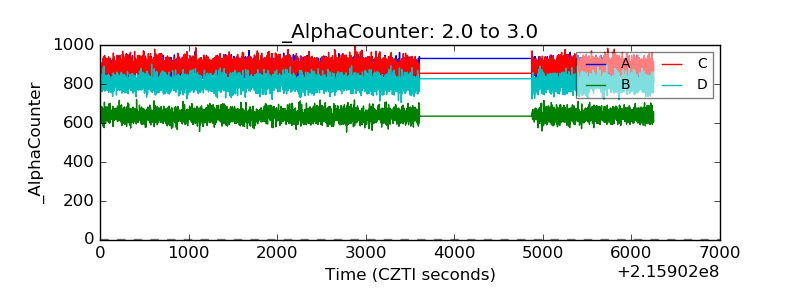 |
| _CPM_Rate | 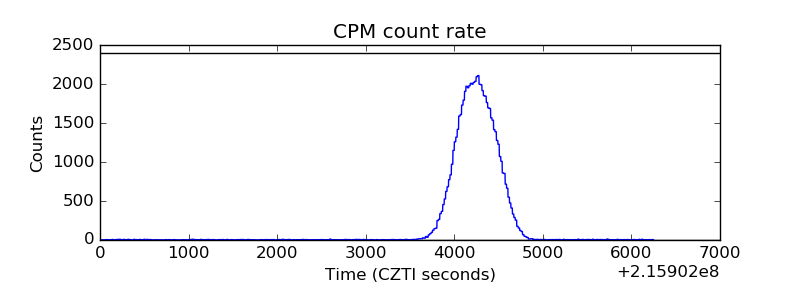 |
| CZT Counter | 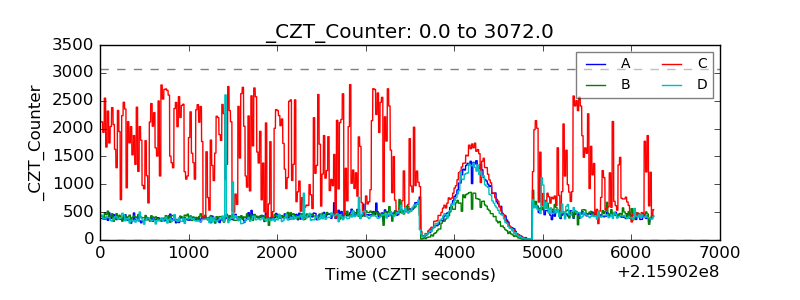 |
| +2.5 Volts monitor |  |
| +5 Volts monitor |  |
| _ROLL_ROT | 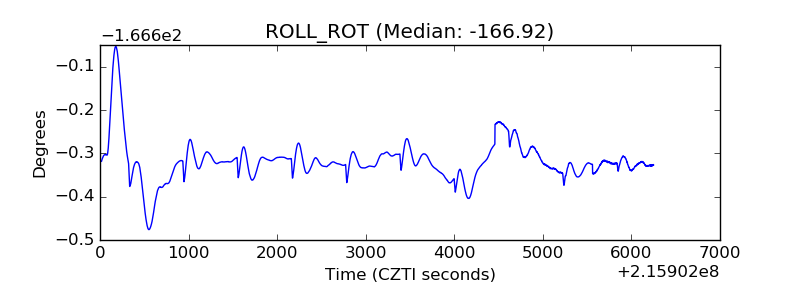 |
| _Roll_DEC | 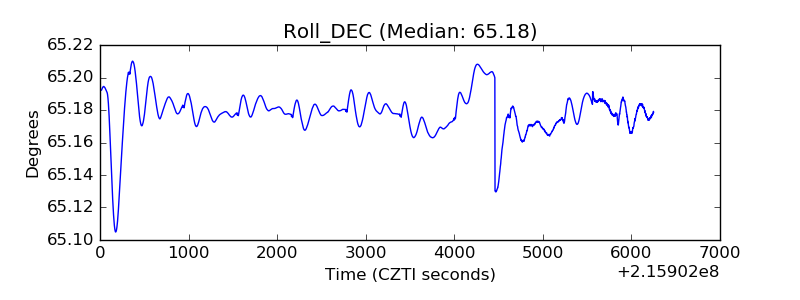 |
| _Roll_RA | 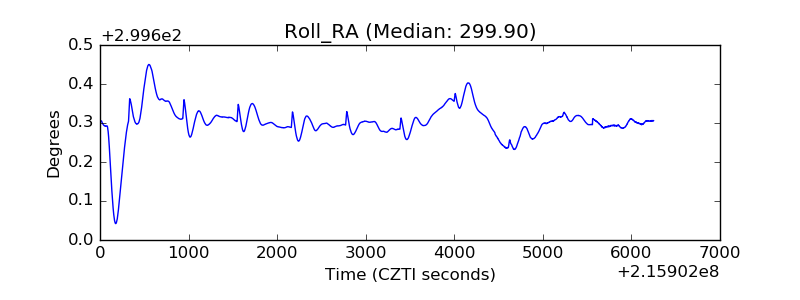 |
| Veto Counter | 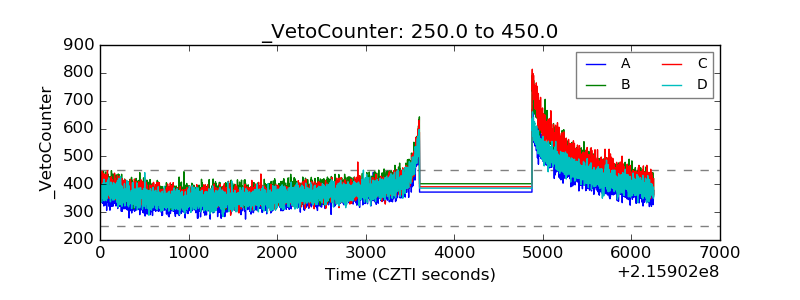 |