| Param | Original file | Final file |
|---|---|---|
| Filename | modeM0/AS1G06_086T01_9000000774_05964cztM0_level2.evt | modeM0/AS1G06_086T01_9000000774_05964cztM0_level2_quad_clean.evt |
| Size (bytes) | 459,256,320 | 123,053,760 |
| Size | 438.0 MB | 117.4 MB |
| Events in quadrant A | 3,125,907 | 821,868 |
| Events in quadrant B | 3,216,259 | 847,638 |
| Events in quadrant C | 3,753,970 | 815,780 |
| Events in quadrant D | 3,356,035 | 773,628 |
| Mode SS | |||
|---|---|---|---|
| Quadrant | BADHDUFLAG | Total packets | Discarded packets |
| A | 0 | 140 | 0 |
| B | 0 | 140 | 0 |
| C | 0 | 140 | 0 |
| D | 0 | 140 | 0 |
| Mode M9 | |||
|---|---|---|---|
| Quadrant | BADHDUFLAG | Total packets | Discarded packets |
| A | 0 | 25 | 0 |
| B | 0 | 25 | 0 |
| C | 0 | 25 | 0 |
| D | 0 | 25 | 0 |
| Mode M0 | |||
|---|---|---|---|
| Quadrant | BADHDUFLAG | Total packets | Discarded packets |
| A | 0 | 14087 | 3 |
| B | 0 | 14265 | 2 |
| C | 0 | 15890 | 2 |
| D | 0 | 15192 | 2 |
| Quadrant | Total seconds | Saturated seconds | Saturation percentage |
|---|---|---|---|
| A | 6708 | 70 | 1.043530% |
| B | 6708 | 79 | 1.177698% |
| C | 6708 | 134 | 1.997615% |
| D | 6708 | 245 | 3.652355% |
Noise dominated data is calculated using 1-second bins in cleaned event files. If a bin has >2000 counts, and if more than 50% of those come from <1% of pixels, then it is considered to be noise-dominated and hence unusable.
| Quadrant | # 1 sec bins | Bins with >0 counts | Bins with >2000 counts | High rate bins dominated by noise | Noise dominated (total time) | Noise dominated (detector-on time) | Marked lightcurve |
|---|---|---|---|---|---|---|---|
| A | 9243 | 6711 | 6 | 6 | 0.06% | 0.09% | 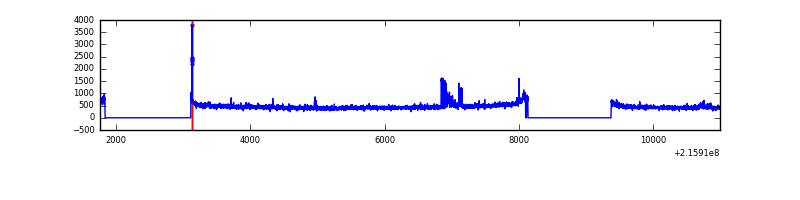 |
| B | 9243 | 6711 | 15 | 15 | 0.16% | 0.22% | 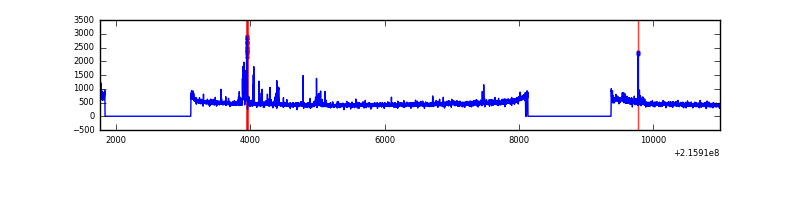 |
| C | 9243 | 6711 | 92 | 92 | 1.00% | 1.37% | 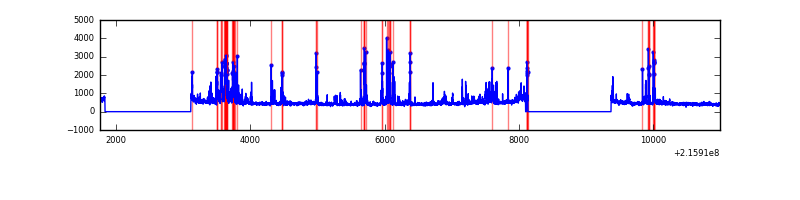 |
| D | 9243 | 6711 | 204 | 204 | 2.21% | 3.04% | 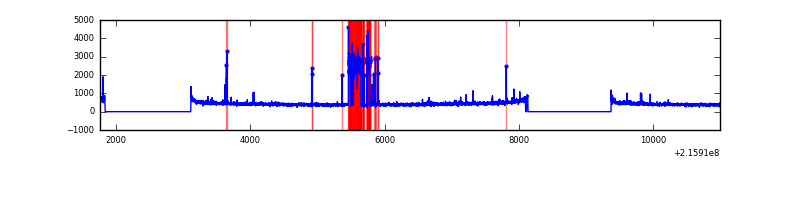 |
Top three noisy pixels from each quadrant. If the there are fewer than three noisy pixels in the level2.evt file, extra rows are filled as -1
| Pixel properties | Quadrant properties | ||||||
|---|---|---|---|---|---|---|---|
| Quadrant | DetID | PixID | Counts | Sigma | Mean | Median | Sigma |
| A | 15 | 234 | 120535 | 778.14 | 762 | 746 | 153.9 |
| A | 13 | 251 | 61020 | 391.53 | 762 | 746 | 153.9 |
| A | 8 | 192 | 12253 | 74.75 | 762 | 746 | 153.9 |
| B | 0 | 229 | 122883 | 829.07 | 777 | 757 | 147.3 |
| B | 0 | 219 | 47616 | 318.11 | 777 | 757 | 147.3 |
| B | 4 | 81 | 18570 | 120.93 | 777 | 757 | 147.3 |
| C | 9 | 247 | 829212 | 4868.9 | 741 | 745 | 170.2 |
| C | 1 | 16 | 11328 | 62.19 | 741 | 745 | 170.2 |
| C | 9 | 68 | 6980 | 36.64 | 741 | 745 | 170.2 |
| D | 2 | 206 | 522563 | 2928.01 | 728 | 704 | 178.2 |
| D | 2 | 14 | 30053 | 164.67 | 728 | 704 | 178.2 |
| D | 8 | 195 | 23710 | 129.08 | 728 | 704 | 178.2 |
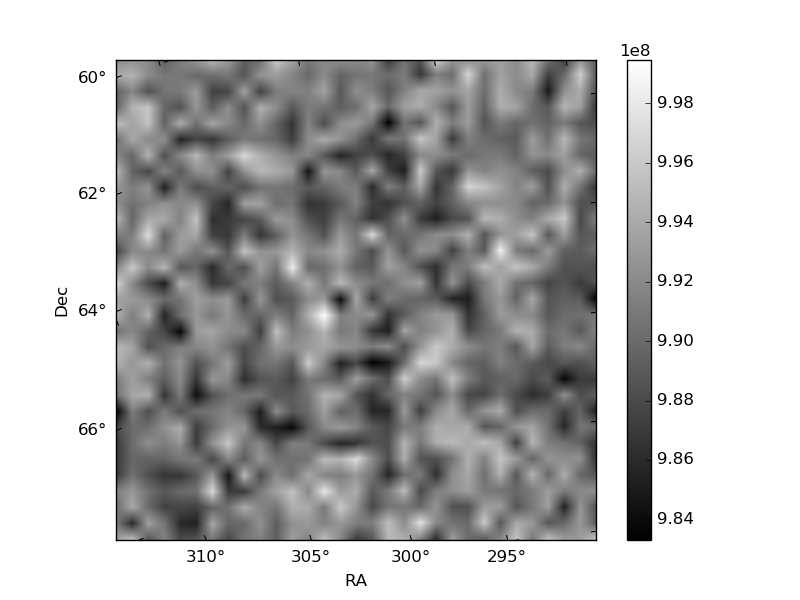
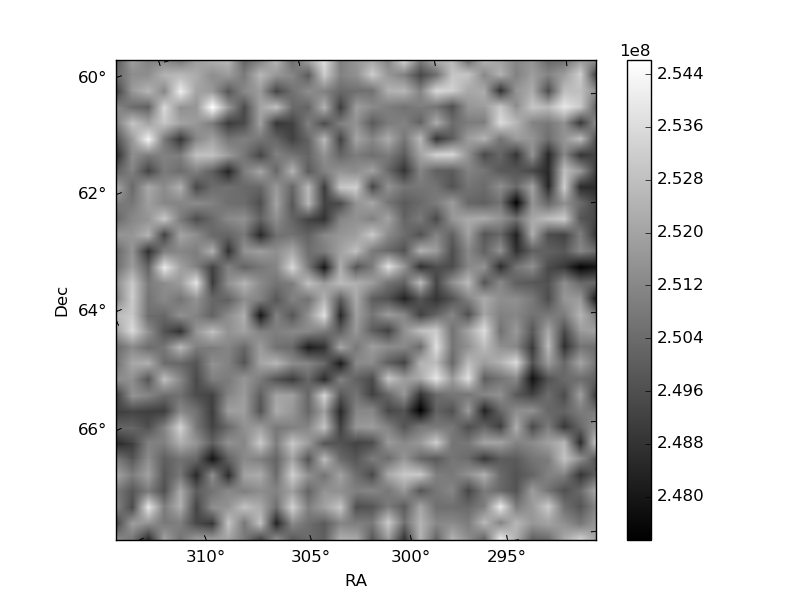
Histogram calculated using DETX and DETY for each event in the final _common_clean file
| Quadrant A | 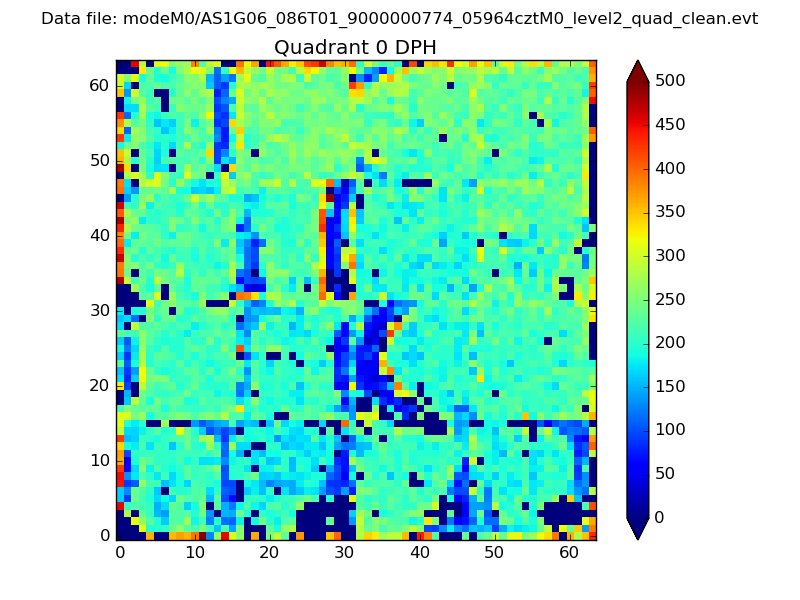 |
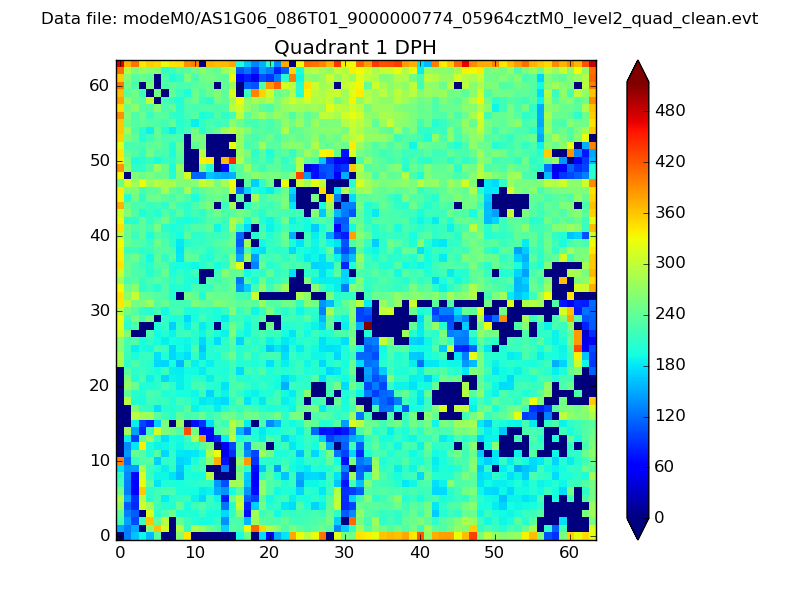 |
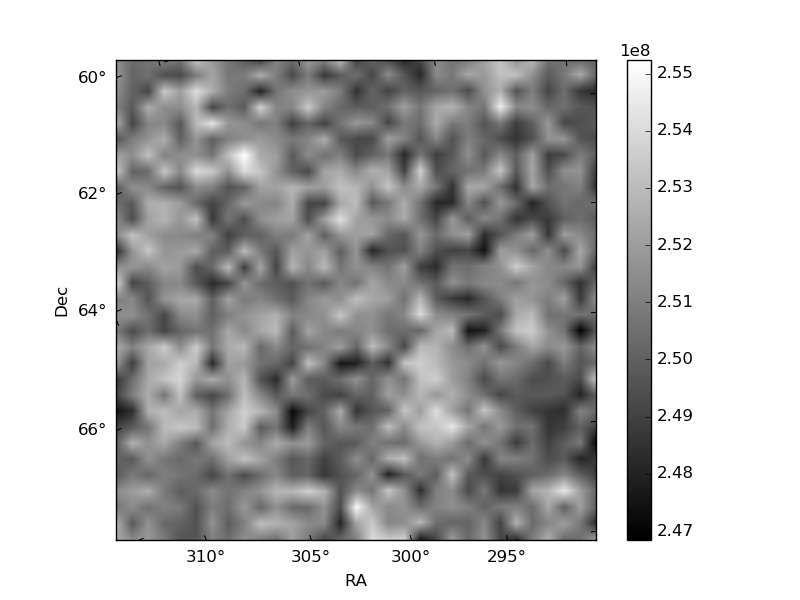
Quadrant B |
|---|---|---|---|
| Quadrant D | 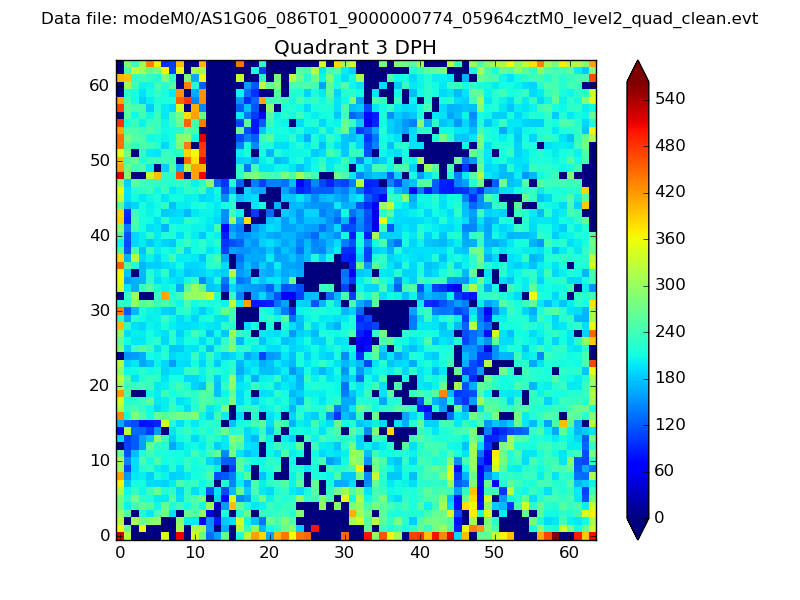 |
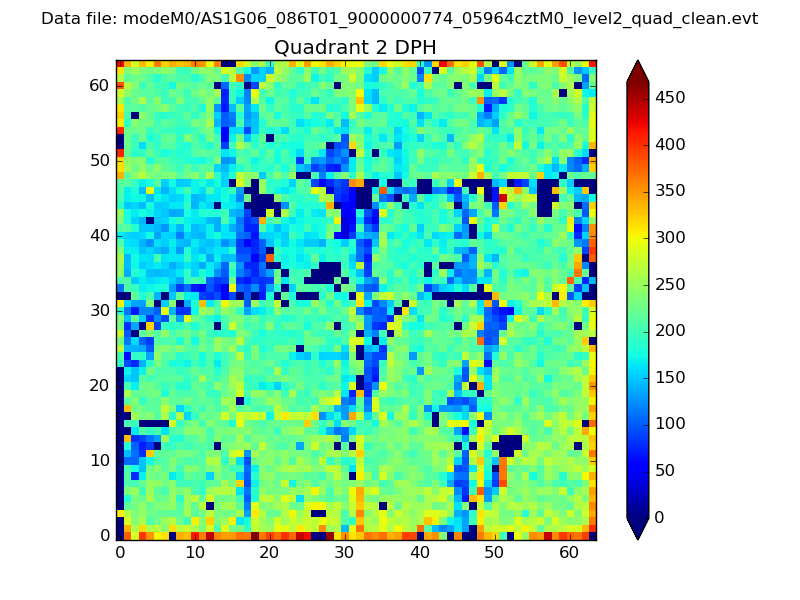 |
Quadrant C |
| Plot type | Count rate plots | Images |
|---|---|---|
| Comparison with Poisson distribution Blue bars denote a histogram of data divided into 1 sec bins. Red curve is a Poisson curve with rate = median count rate of data. |
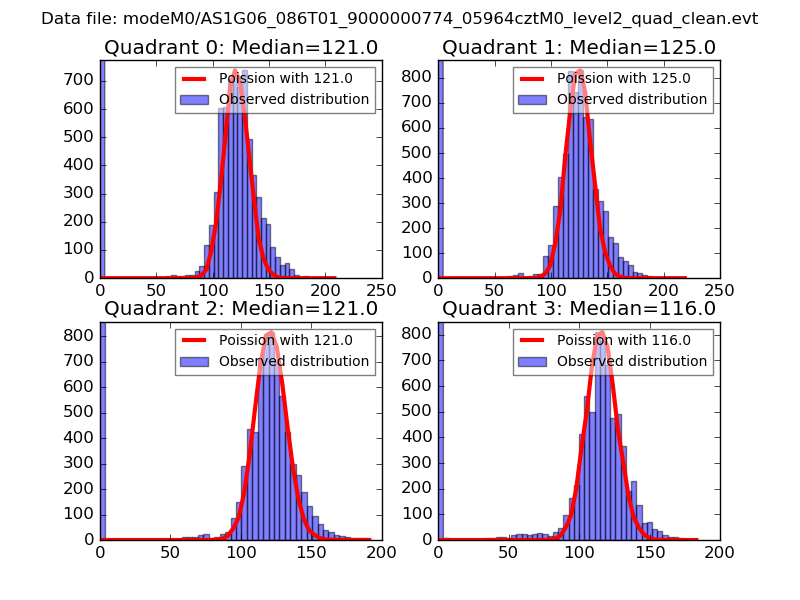 |
 |
| Quadrant-wise count rates Data is divided into 100 sec bins |
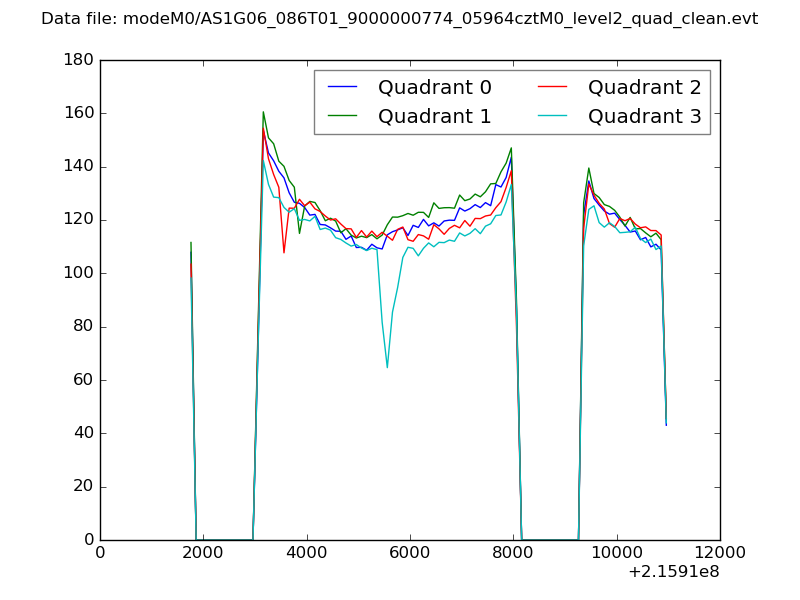 |
|
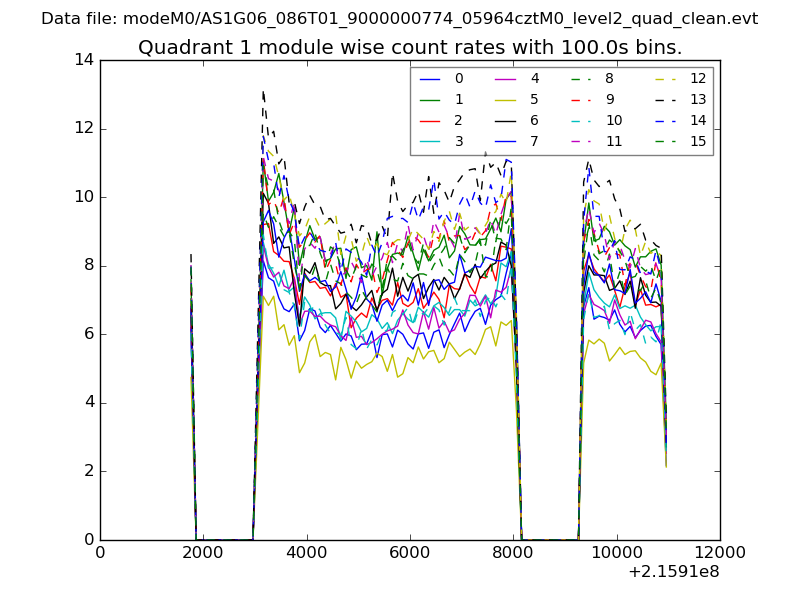
| Module-wise count rates for Quadrant A Data is divided into 100 sec bins |
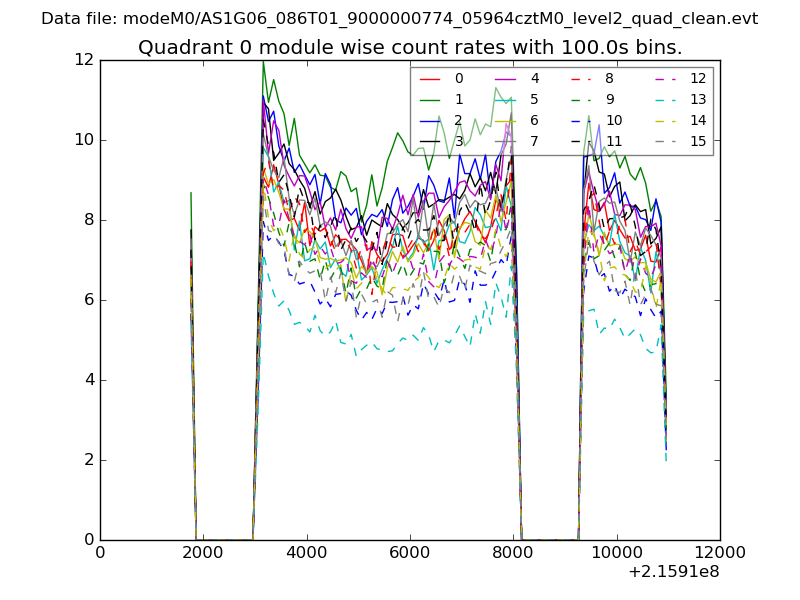 |
 |
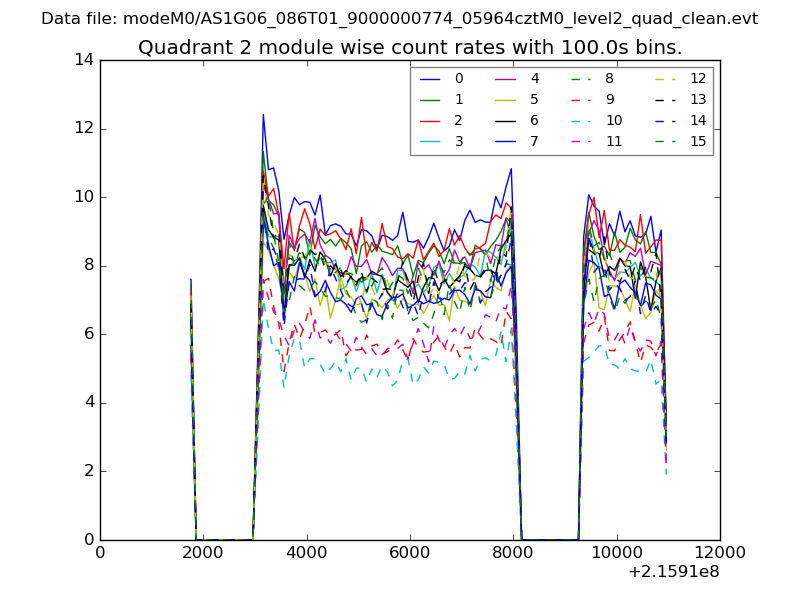
| Module-wise count rates for Quadrant B Data is divided into 100 sec bins |
 |
 |
| Module-wise count rates for Quadrant C Data is divided into 100 sec bins |
 |
 |
| Module-wise count rates for Quadrant D Data is divided into 100 sec bins |
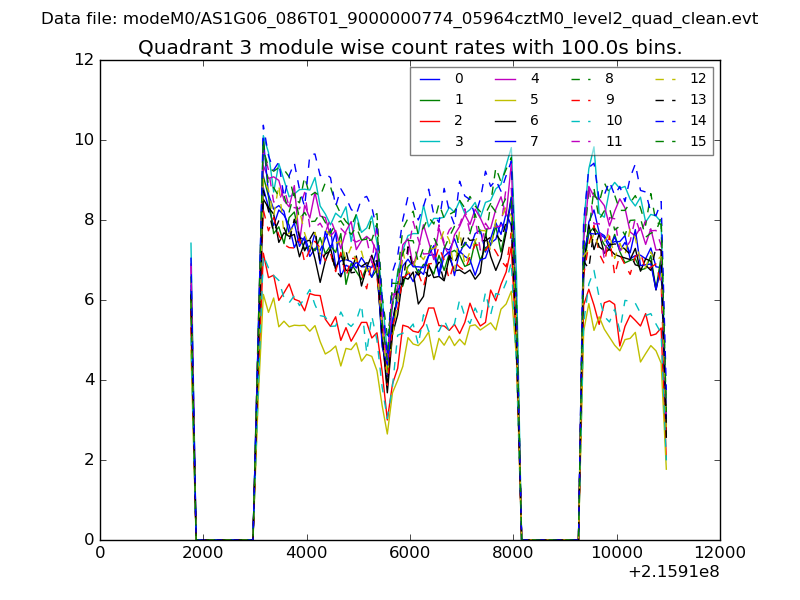 |
 |
| Parameter | Plot |
|---|---|
| CZT HV Monitor | 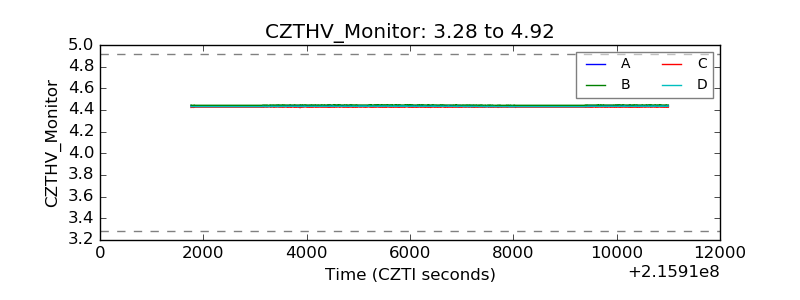 |
| D_VDD | 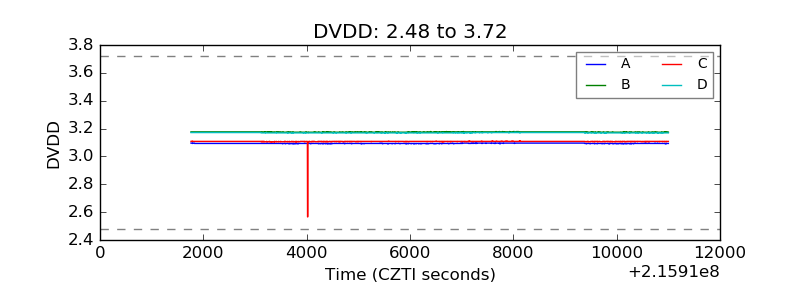 |
| Temperature 1 | 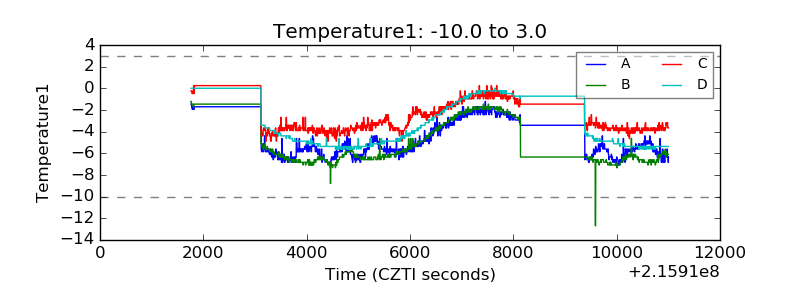 |
| Veto HV Monitor | 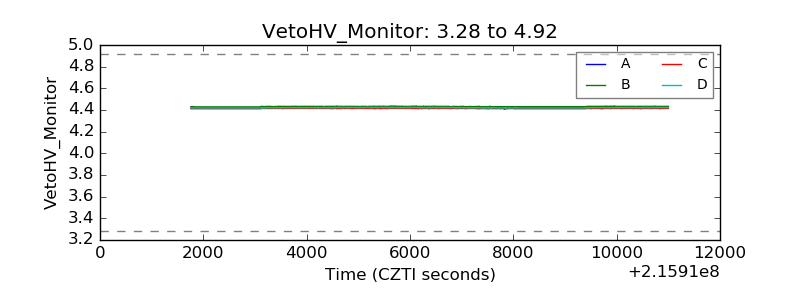 |
| Veto LLD | 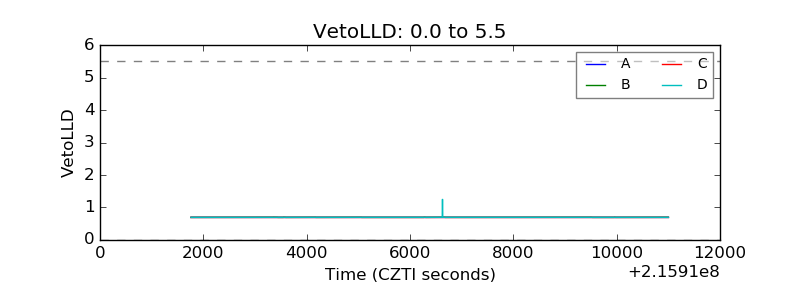 |
| Alpha Counter | 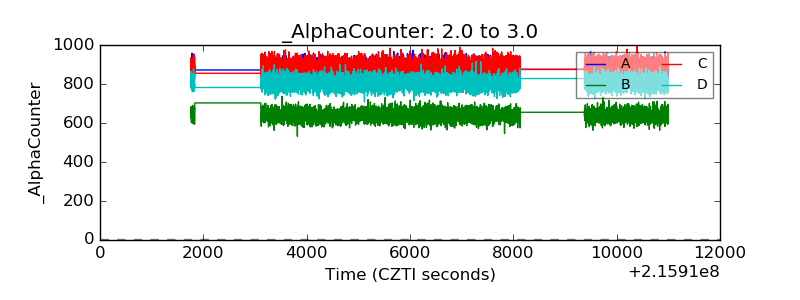 |
| _CPM_Rate | 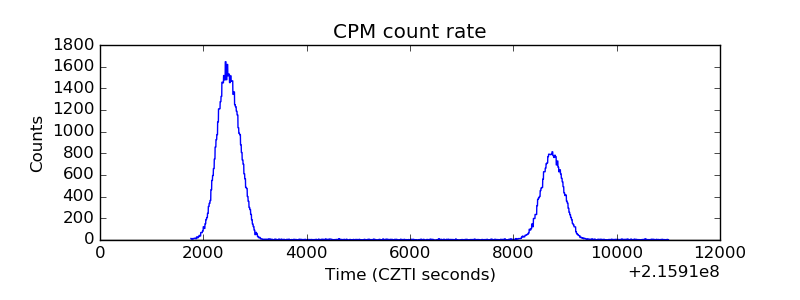 |
| CZT Counter | 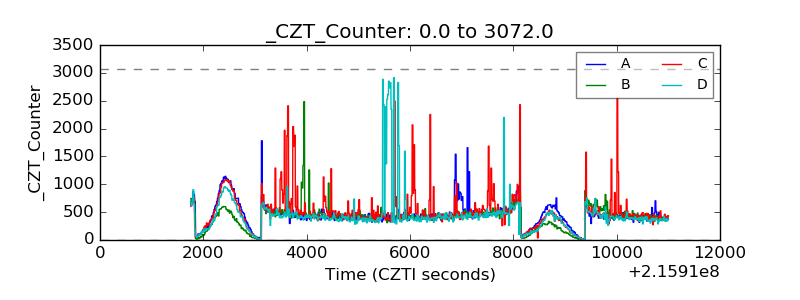 |
| +2.5 Volts monitor |  |
| +5 Volts monitor | 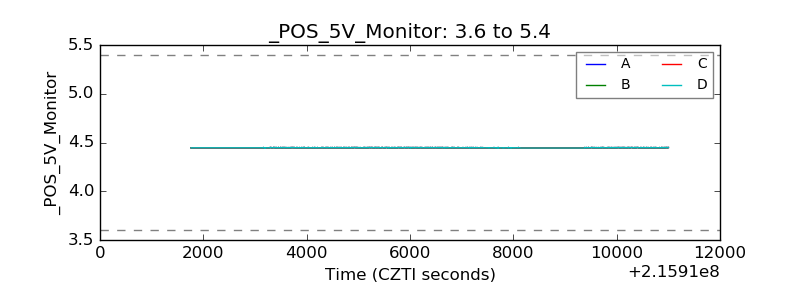 |
| _ROLL_ROT | 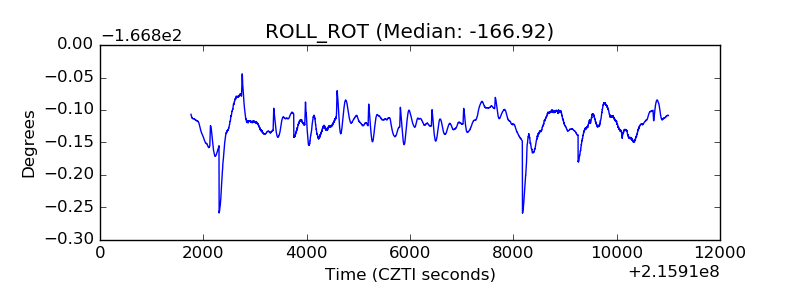 |
| _Roll_DEC | 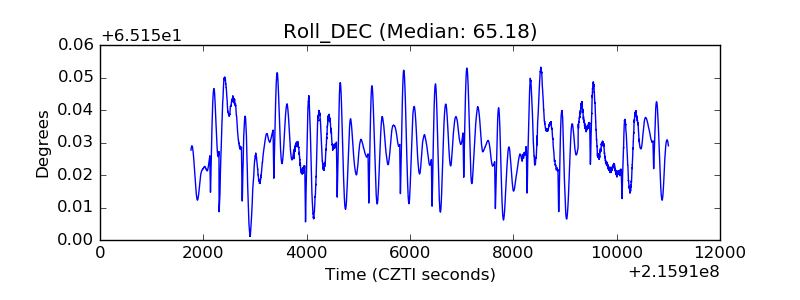 |
| _Roll_RA | 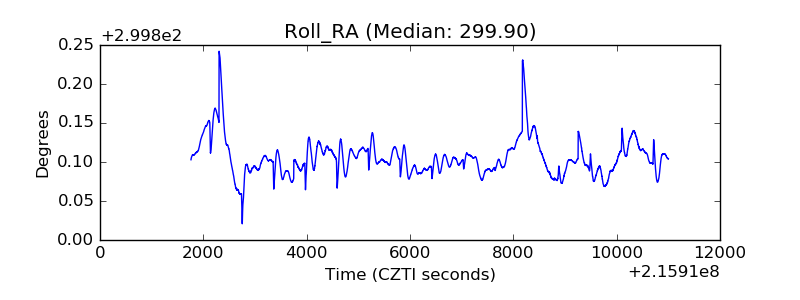 |
| Veto Counter | 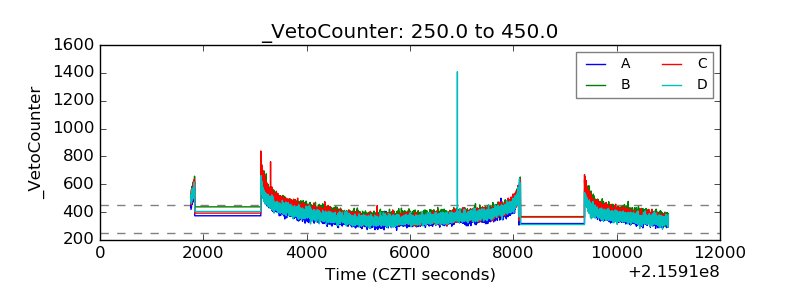 |