| Param | Original file | Final file |
|---|---|---|
| Filename | modeM0/AS1G06_086T01_9000000774_05965cztM0_level2.evt | modeM0/AS1G06_086T01_9000000774_05965cztM0_level2_quad_clean.evt |
| Size (bytes) | 395,395,200 | 109,520,640 |
| Size | 377.1 MB | 104.4 MB |
| Events in quadrant A | 2,749,177 | 727,936 |
| Events in quadrant B | 2,796,813 | 748,166 |
| Events in quadrant C | 3,366,996 | 715,395 |
| Events in quadrant D | 2,639,160 | 692,426 |
| Mode SS | |||
|---|---|---|---|
| Quadrant | BADHDUFLAG | Total packets | Discarded packets |
| A | 0 | 128 | 0 |
| B | 0 | 128 | 0 |
| C | 0 | 128 | 0 |
| D | 0 | 128 | 0 |
| Mode M9 | |||
|---|---|---|---|
| Quadrant | BADHDUFLAG | Total packets | Discarded packets |
| A | 0 | 9 | 0 |
| B | 0 | 9 | 0 |
| C | 0 | 9 | 0 |
| D | 0 | 9 | 0 |
| Mode M0 | |||
|---|---|---|---|
| Quadrant | BADHDUFLAG | Total packets | Discarded packets |
| A | 0 | 12651 | 3 |
| B | 0 | 12716 | 2 |
| C | 0 | 14655 | 2 |
| D | 0 | 12819 | 2 |
| Quadrant | Total seconds | Saturated seconds | Saturation percentage |
|---|---|---|---|
| A | 6196 | 38 | 0.613299% |
| B | 6196 | 50 | 0.806972% |
| C | 6196 | 209 | 3.373144% |
| D | 6196 | 30 | 0.484183% |
Noise dominated data is calculated using 1-second bins in cleaned event files. If a bin has >2000 counts, and if more than 50% of those come from <1% of pixels, then it is considered to be noise-dominated and hence unusable.
| Quadrant | # 1 sec bins | Bins with >0 counts | Bins with >2000 counts | High rate bins dominated by noise | Noise dominated (total time) | Noise dominated (detector-on time) | Marked lightcurve |
|---|---|---|---|---|---|---|---|
| A | 7216 | 6198 | 0 | 0 | 0.00% | 0.00% | 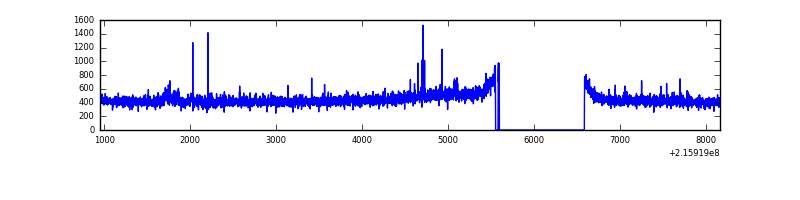 |
| B | 7216 | 6198 | 1 | 1 | 0.01% | 0.02% | 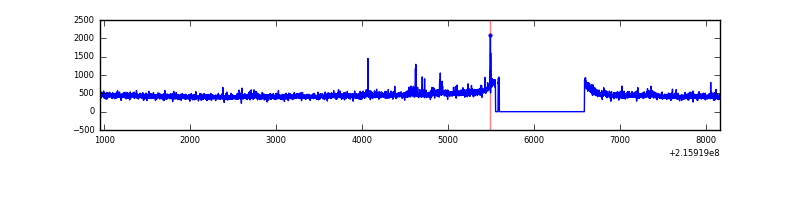 |
| C | 7216 | 6198 | 133 | 133 | 1.84% | 2.15% | 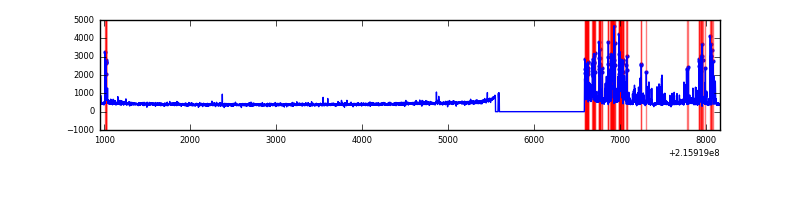 |
| D | 7216 | 6198 | 7 | 7 | 0.10% | 0.11% | 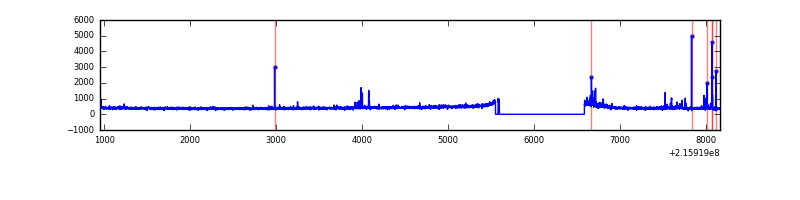 |
Top three noisy pixels from each quadrant. If the there are fewer than three noisy pixels in the level2.evt file, extra rows are filled as -1
| Pixel properties | Quadrant properties | ||||||
|---|---|---|---|---|---|---|---|
| Quadrant | DetID | PixID | Counts | Sigma | Mean | Median | Sigma |
| A | 13 | 251 | 61567 | 437.43 | 685 | 670 | 139.2 |
| A | 8 | 192 | 31355 | 220.41 | 685 | 670 | 139.2 |
| A | 4 | 2 | 9981 | 66.88 | 685 | 670 | 139.2 |
| B | 4 | 81 | 43842 | 322.72 | 697 | 680 | 133.7 |
| B | 15 | 204 | 20788 | 150.35 | 697 | 680 | 133.7 |
| B | 12 | 111 | 12758 | 90.31 | 697 | 680 | 133.7 |
| C | 9 | 247 | 777552 | 5095.64 | 657 | 659 | 152.5 |
| C | 1 | 16 | 19081 | 120.83 | 657 | 659 | 152.5 |
| C | 13 | 61 | 5310 | 30.5 | 657 | 659 | 152.5 |
| D | 2 | 63 | 34248 | 206.59 | 660 | 637 | 162.7 |
| D | 2 | 206 | 25500 | 152.82 | 660 | 637 | 162.7 |
| D | 8 | 195 | 24891 | 149.08 | 660 | 637 | 162.7 |
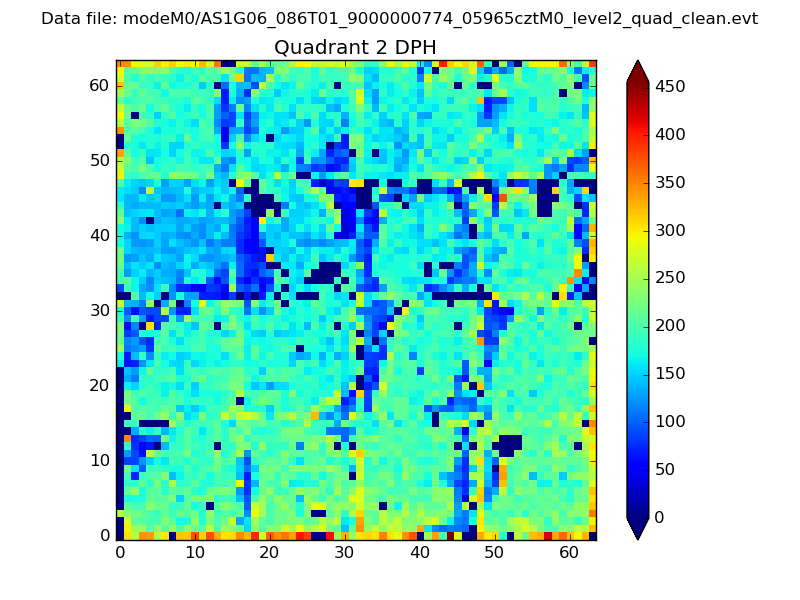
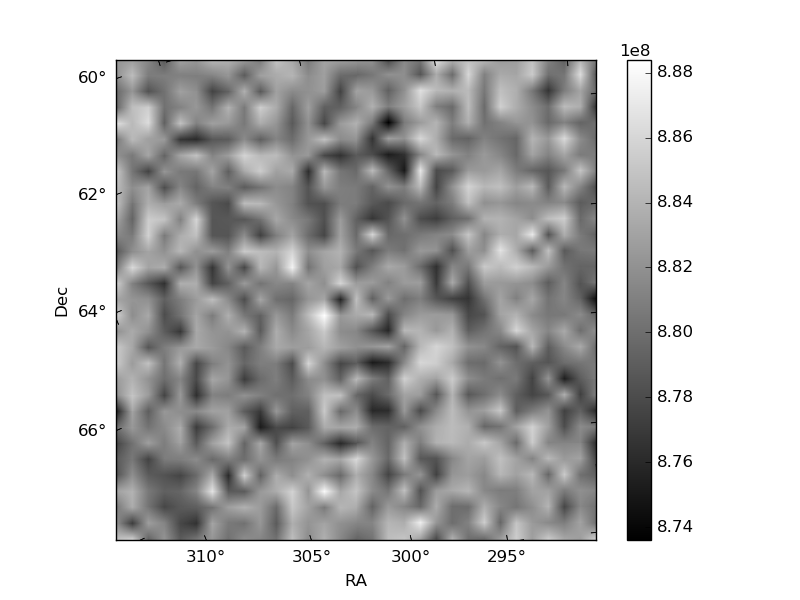
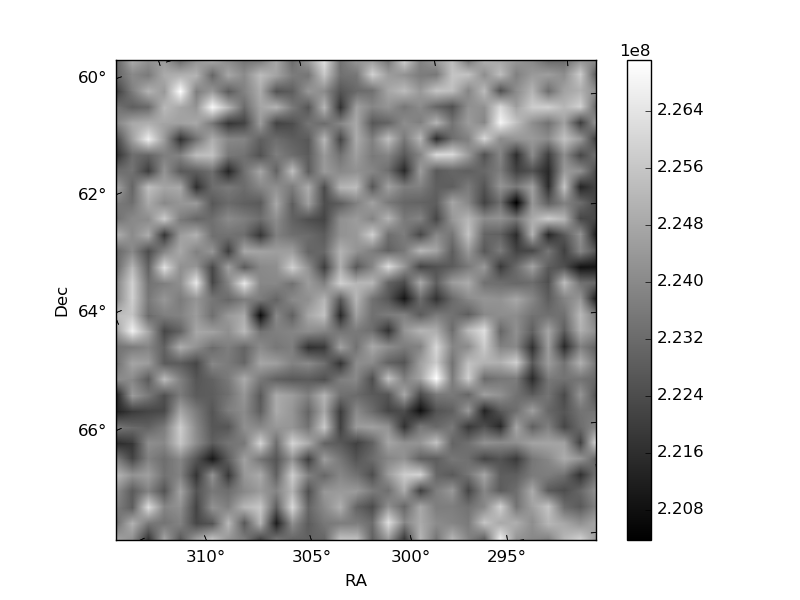
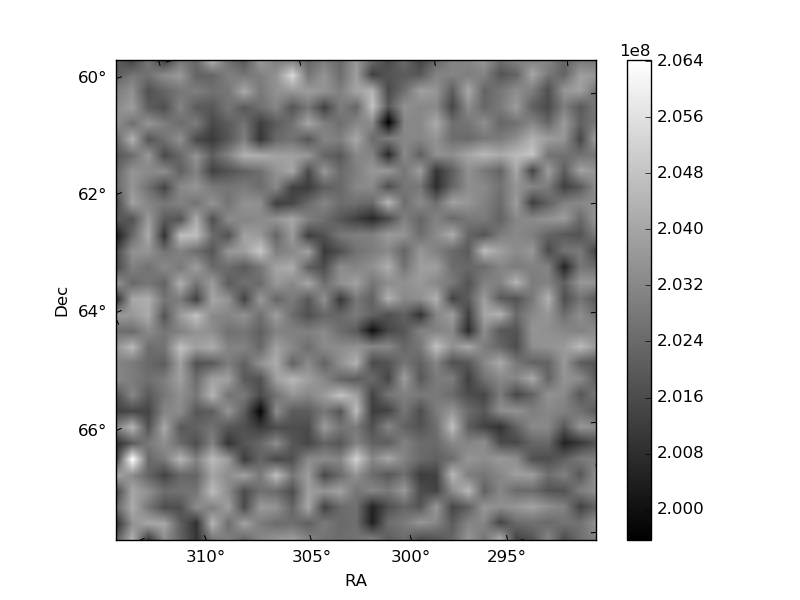
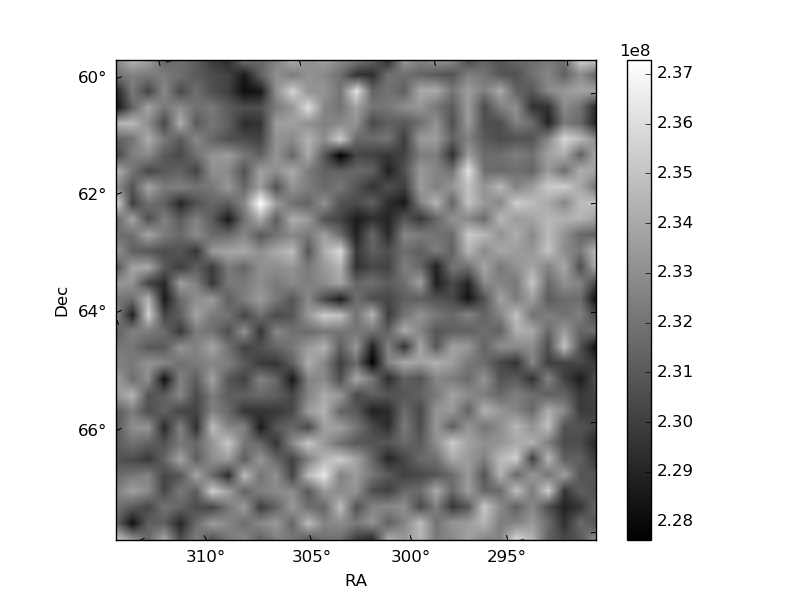
Histogram calculated using DETX and DETY for each event in the final _common_clean file
| Quadrant A | 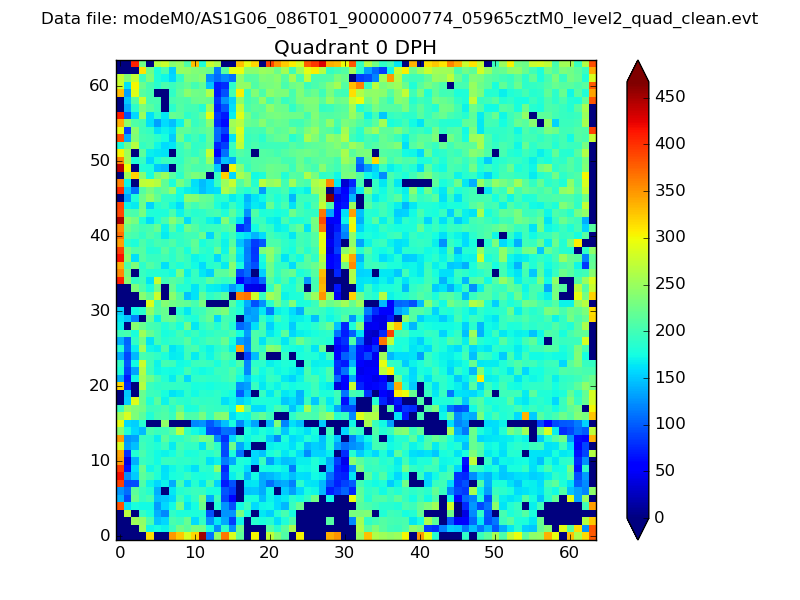 |
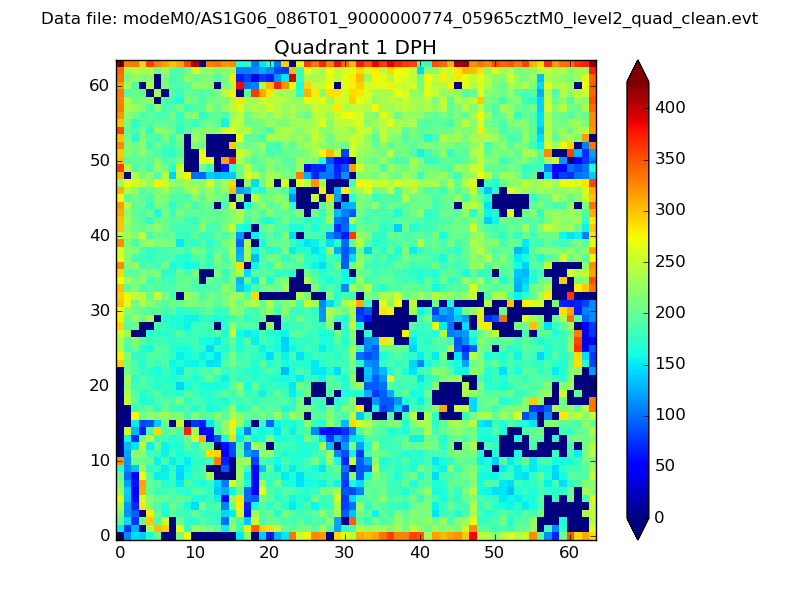 |
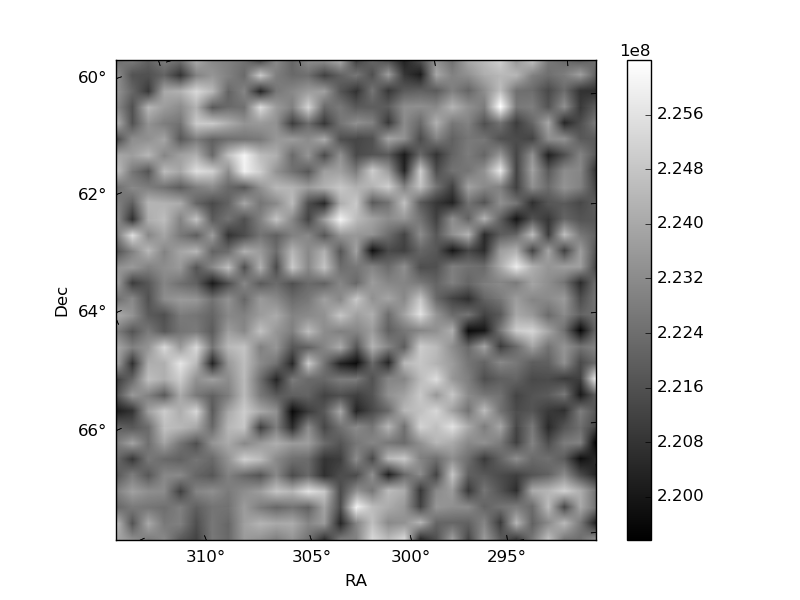
Quadrant B |
|---|---|---|---|
| Quadrant D | 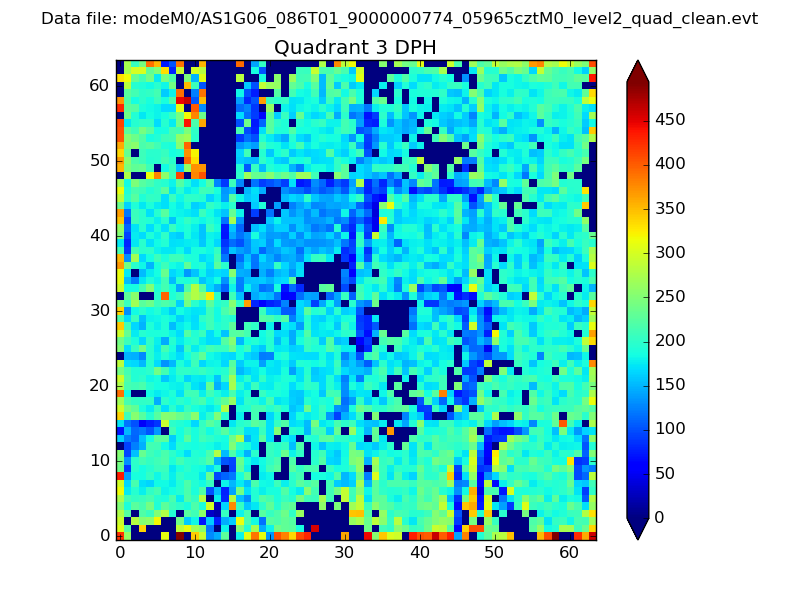 |
 |
Quadrant C |
| Plot type | Count rate plots | Images |
|---|---|---|
| Comparison with Poisson distribution Blue bars denote a histogram of data divided into 1 sec bins. Red curve is a Poisson curve with rate = median count rate of data. |
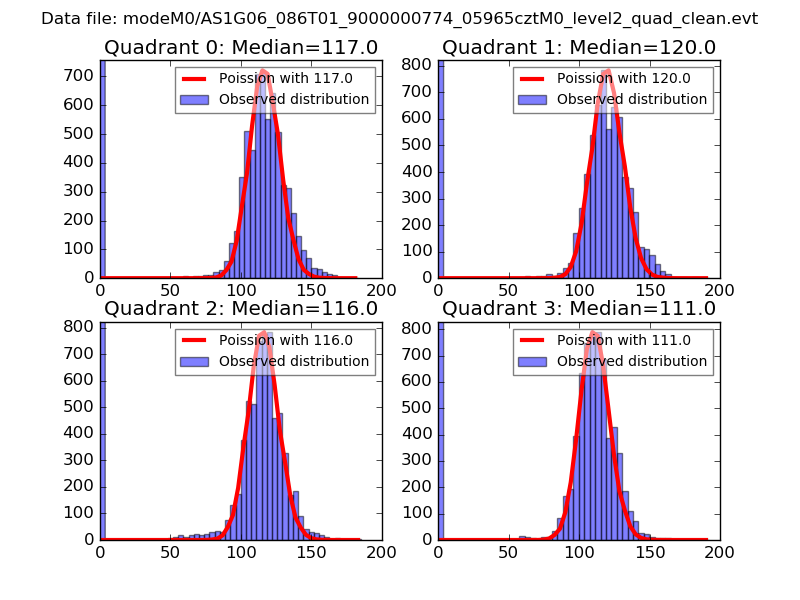 |
 |
| Quadrant-wise count rates Data is divided into 100 sec bins |
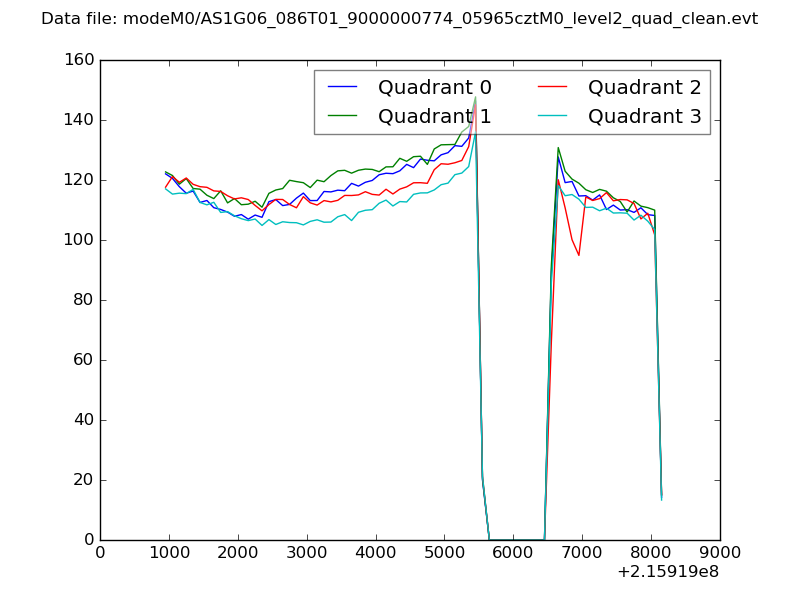 |
|
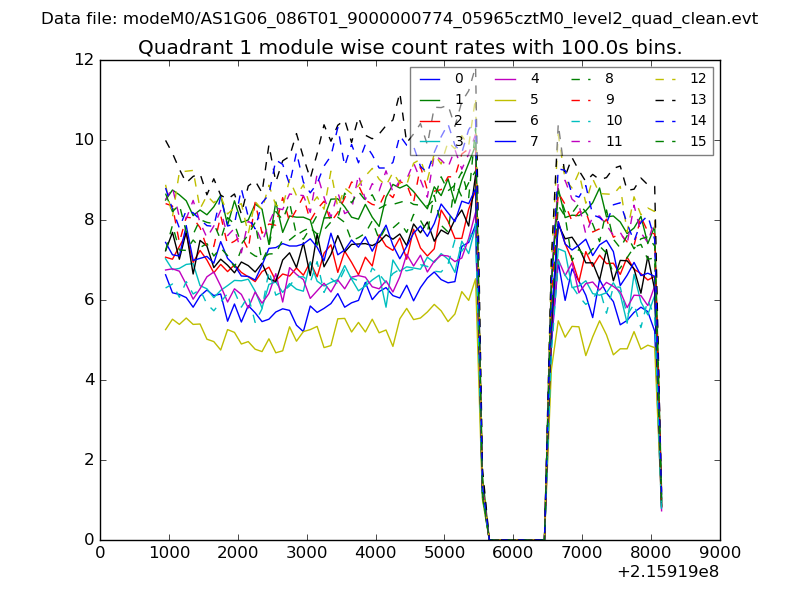
| Module-wise count rates for Quadrant A Data is divided into 100 sec bins |
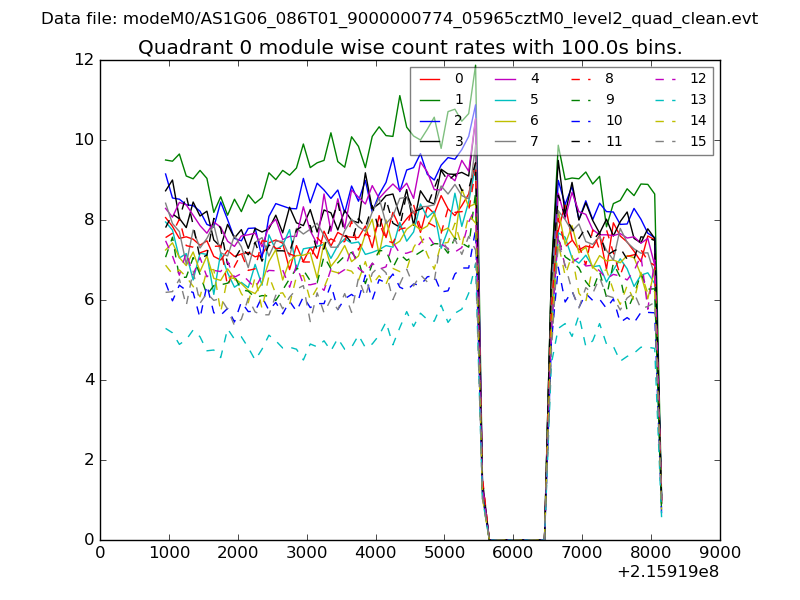 |
 |
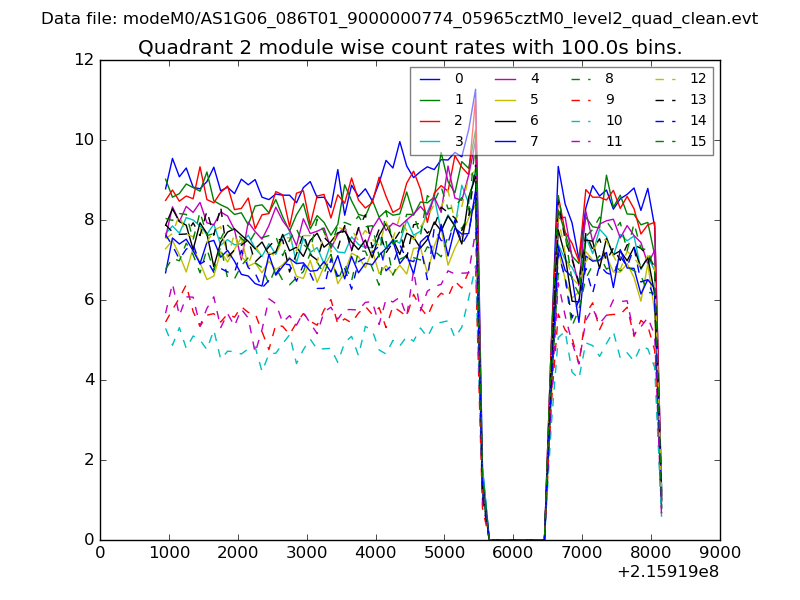
| Module-wise count rates for Quadrant B Data is divided into 100 sec bins |
 |
 |
| Module-wise count rates for Quadrant C Data is divided into 100 sec bins |
 |
 |
| Module-wise count rates for Quadrant D Data is divided into 100 sec bins |
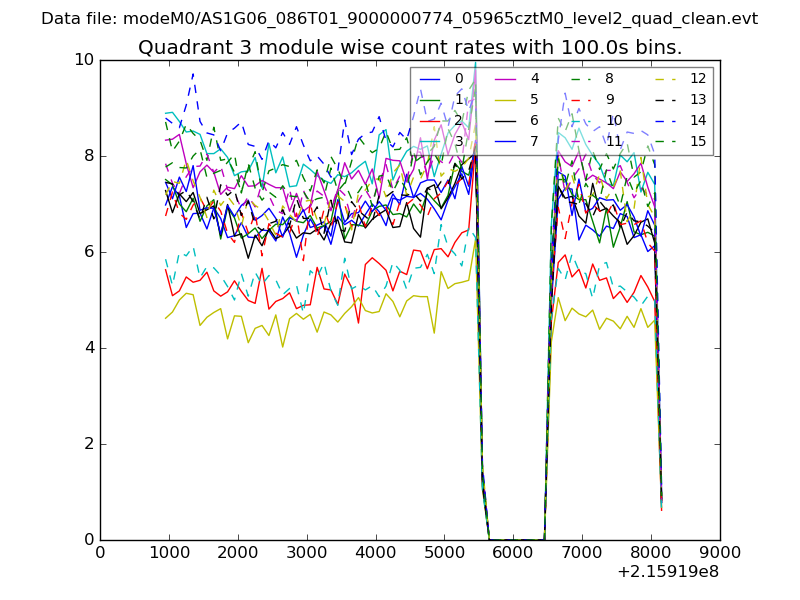 |
 |
| Parameter | Plot |
|---|---|
| CZT HV Monitor | 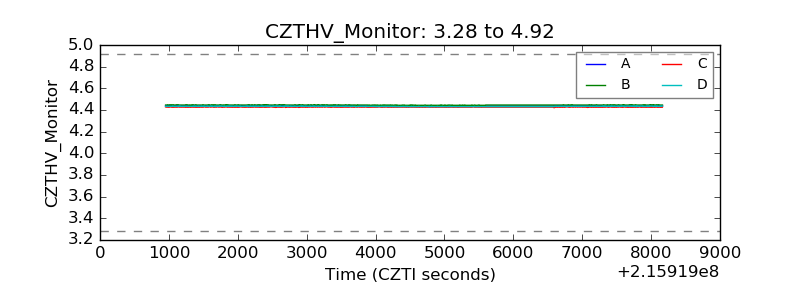 |
| D_VDD | 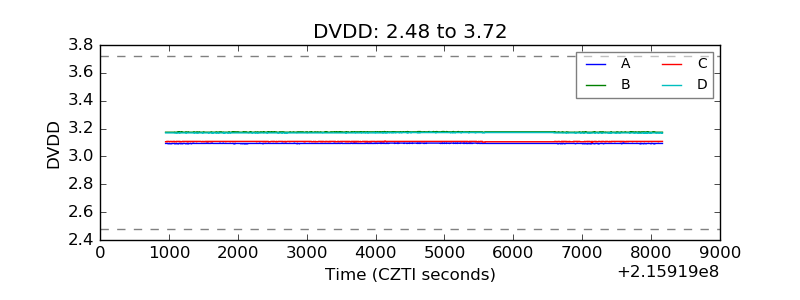 |
| Temperature 1 |  |
| Veto HV Monitor | 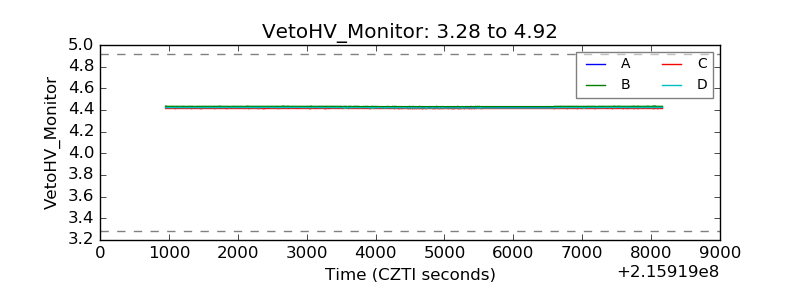 |
| Veto LLD | 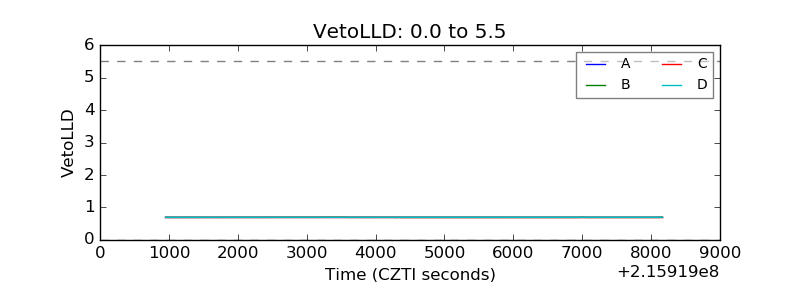 |
| Alpha Counter | 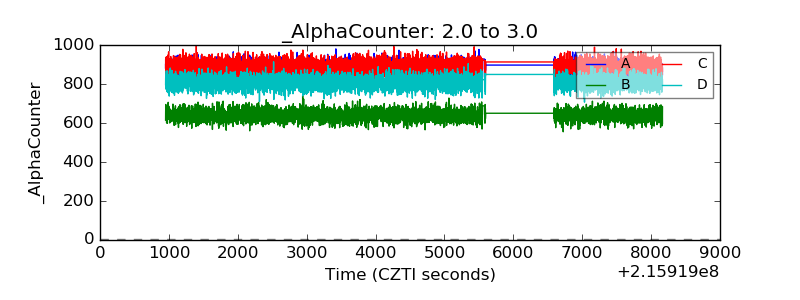 |
| _CPM_Rate | 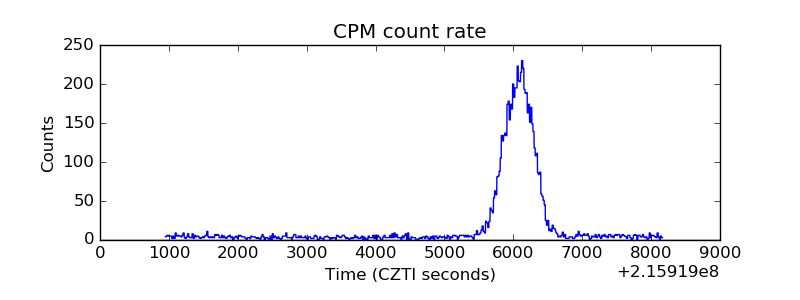 |
| CZT Counter | 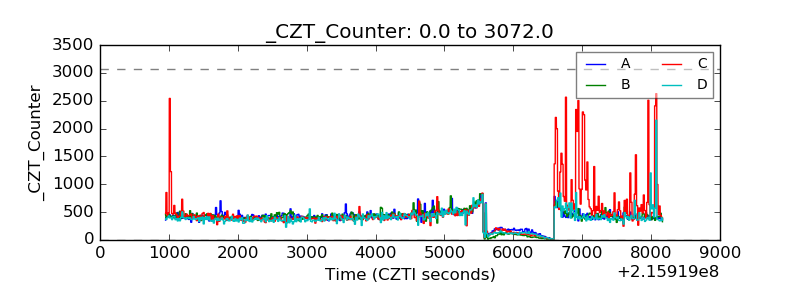 |
| +2.5 Volts monitor |  |
| +5 Volts monitor | 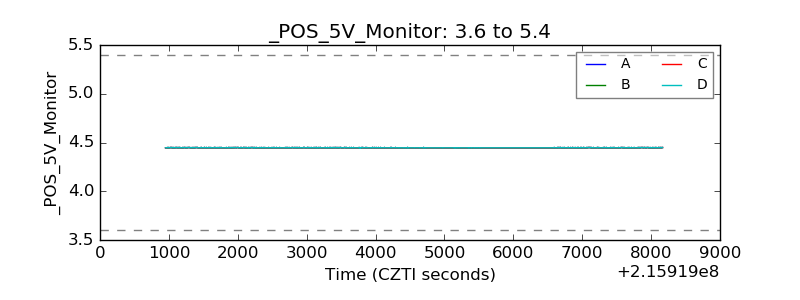 |
| _ROLL_ROT | 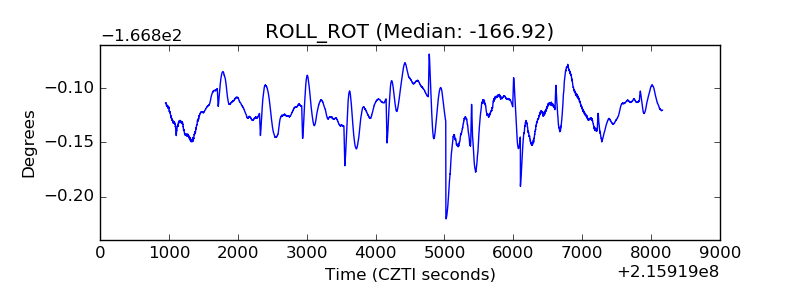 |
| _Roll_DEC | 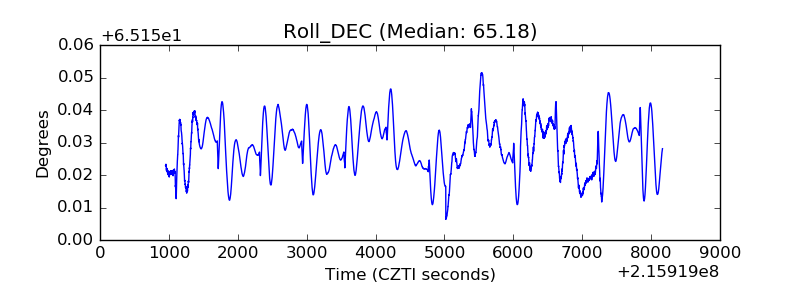 |
| _Roll_RA | 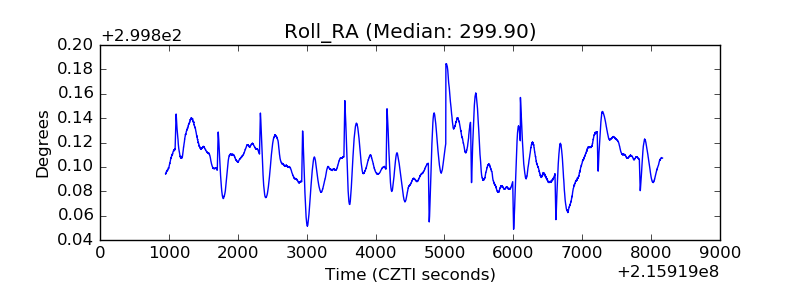 |
| Veto Counter | 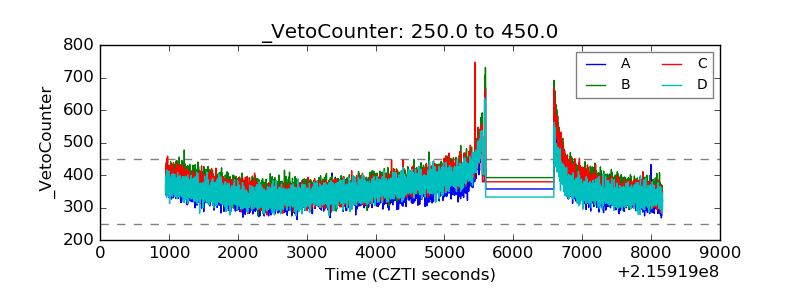 |