| Param | Original file | Final file |
|---|---|---|
| Filename | modeM0/AS1G06_086T01_9000000774_05966cztM0_level2.evt | modeM0/AS1G06_086T01_9000000774_05966cztM0_level2_quad_clean.evt |
| Size (bytes) | 418,582,080 | 113,284,800 |
| Size | 399.2 MB | 108.0 MB |
| Events in quadrant A | 2,861,914 | 756,989 |
| Events in quadrant B | 2,988,682 | 774,672 |
| Events in quadrant C | 3,576,709 | 736,185 |
| Events in quadrant D | 2,810,265 | 713,113 |
| Mode SS | |||
|---|---|---|---|
| Quadrant | BADHDUFLAG | Total packets | Discarded packets |
| A | 0 | 144 | 12 |
| B | 0 | 143 | 9 |
| C | 0 | 144 | 10 |
| D | 0 | 144 | 14 |
| Mode M9 | |||
|---|---|---|---|
| Quadrant | BADHDUFLAG | Total packets | Discarded packets |
| A | 0 | 14 | 0 |
| B | 0 | 14 | 0 |
| C | 0 | 14 | 0 |
| D | 0 | 14 | 0 |
| Mode M0 | |||
|---|---|---|---|
| Quadrant | BADHDUFLAG | Total packets | Discarded packets |
| A | 0 | 14389 | 1191 |
| B | 0 | 14616 | 1212 |
| C | 0 | 16800 | 1617 |
| D | 0 | 15335 | 1928 |
| Quadrant | Total seconds | Saturated seconds | Saturation percentage |
|---|---|---|---|
| A | 6469 | 79 | 1.221209% |
| B | 6463 | 121 | 1.872196% |
| C | 6423 | 207 | 3.222793% |
| D | 6409 | 55 | 0.858168% |
Noise dominated data is calculated using 1-second bins in cleaned event files. If a bin has >2000 counts, and if more than 50% of those come from <1% of pixels, then it is considered to be noise-dominated and hence unusable.
| Quadrant | # 1 sec bins | Bins with >0 counts | Bins with >2000 counts | High rate bins dominated by noise | Noise dominated (total time) | Noise dominated (detector-on time) | Marked lightcurve |
|---|---|---|---|---|---|---|---|
| A | 7700 | 6642 | 0 | 0 | 0.00% | 0.00% | 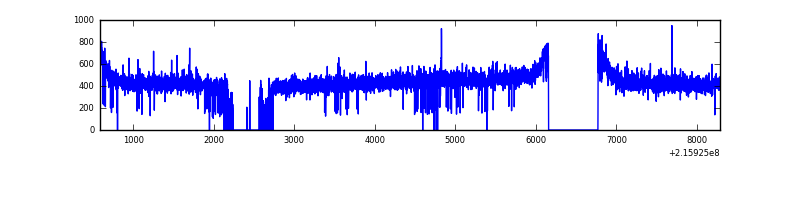 |
| B | 7700 | 6633 | 1 | 1 | 0.01% | 0.02% | 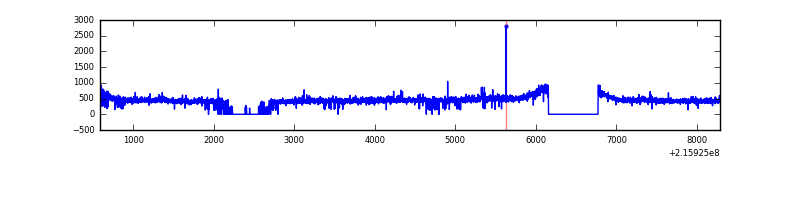 |
| C | 7700 | 6613 | 114 | 114 | 1.48% | 1.72% | 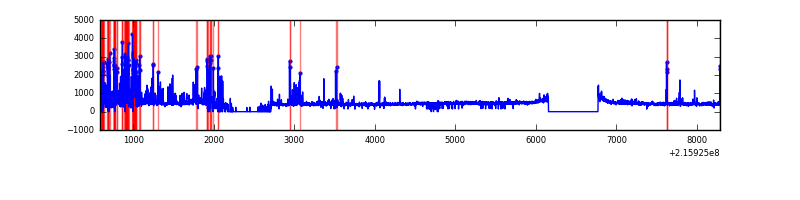 |
| D | 7700 | 6610 | 12 | 12 | 0.16% | 0.18% | 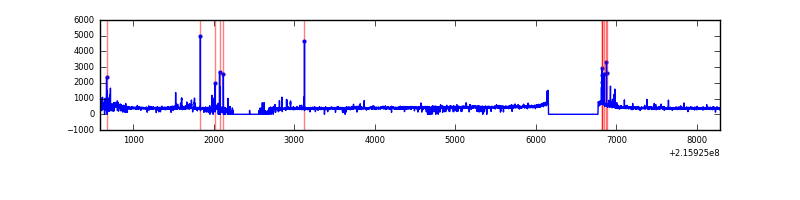 |
Top three noisy pixels from each quadrant. If the there are fewer than three noisy pixels in the level2.evt file, extra rows are filled as -1
| Pixel properties | Quadrant properties | ||||||
|---|---|---|---|---|---|---|---|
| Quadrant | DetID | PixID | Counts | Sigma | Mean | Median | Sigma |
| A | 8 | 192 | 21622 | 141.69 | 726 | 707 | 147.6 |
| A | 13 | 251 | 20693 | 135.4 | 726 | 707 | 147.6 |
| A | 13 | 14 | 9175 | 57.37 | 726 | 707 | 147.6 |
| B | 0 | 219 | 45944 | 319.6 | 737 | 717 | 141.5 |
| B | 15 | 204 | 40792 | 283.19 | 737 | 717 | 141.5 |
| B | 4 | 81 | 34535 | 238.97 | 737 | 717 | 141.5 |
| C | 9 | 247 | 816342 | 5079.57 | 693 | 695 | 160.6 |
| C | 1 | 16 | 26058 | 157.95 | 693 | 695 | 160.6 |
| C | 9 | 68 | 12795 | 75.35 | 693 | 695 | 160.6 |
| D | 2 | 206 | 66163 | 386.67 | 694 | 671 | 169.4 |
| D | 2 | 63 | 35401 | 205.05 | 694 | 671 | 169.4 |
| D | 8 | 195 | 26541 | 152.74 | 694 | 671 | 169.4 |
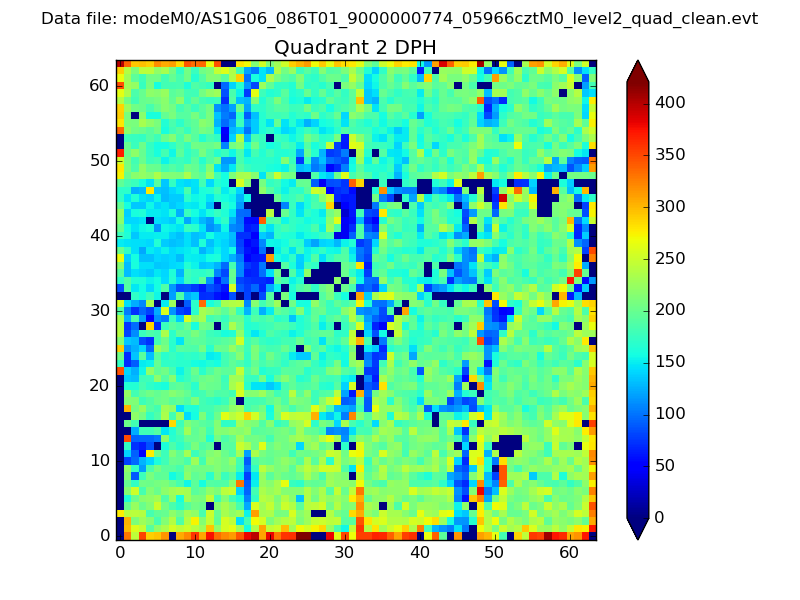
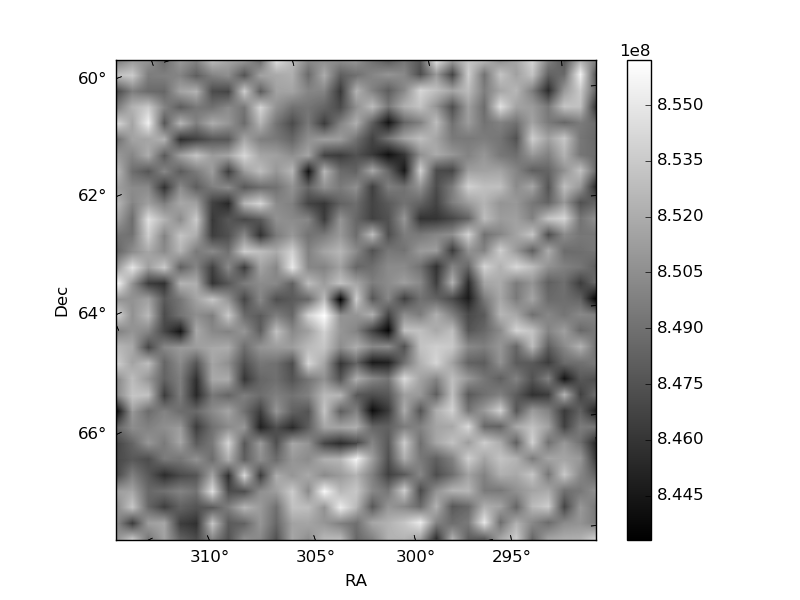
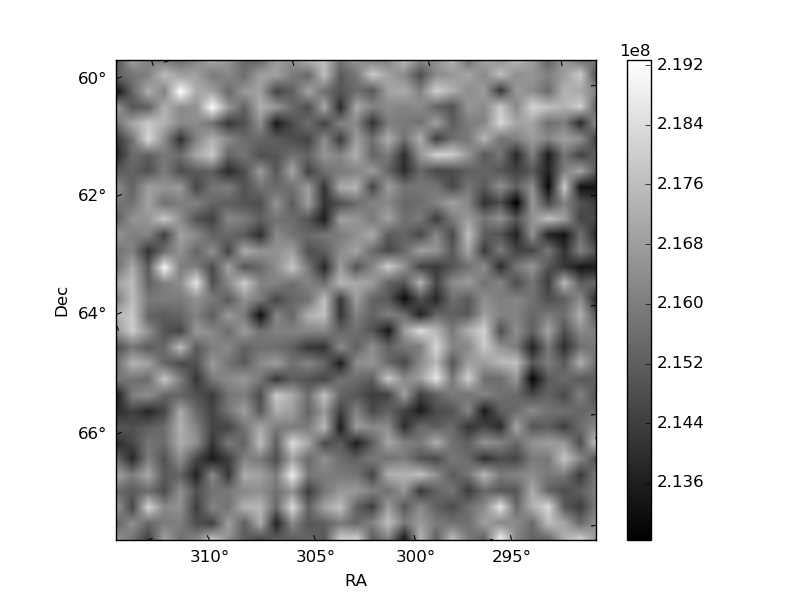
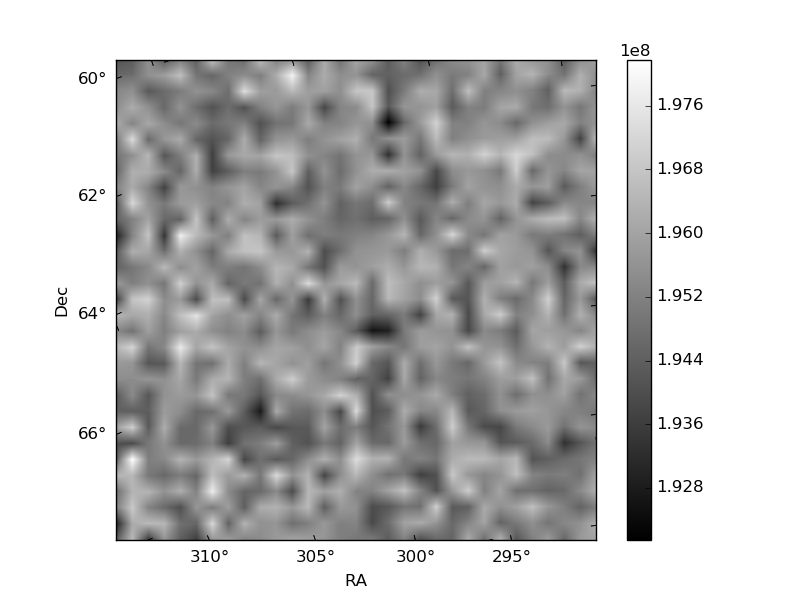
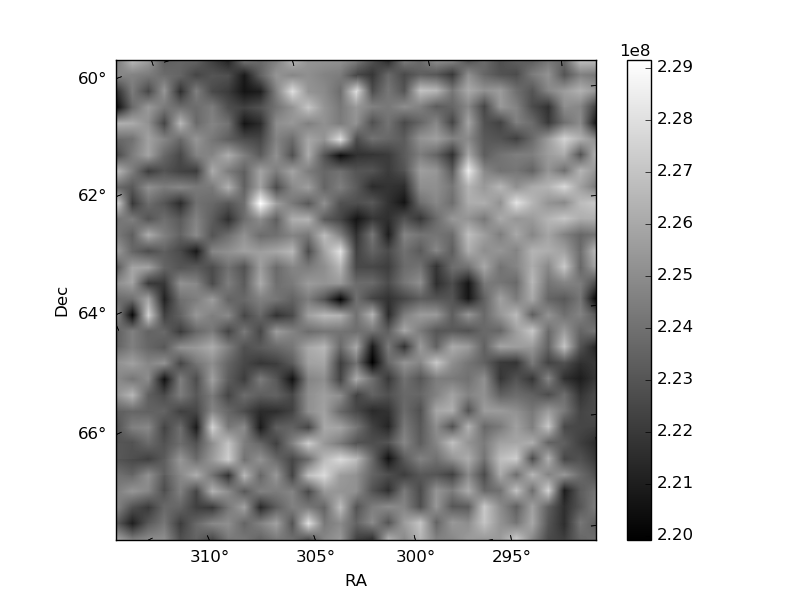
Histogram calculated using DETX and DETY for each event in the final _common_clean file
| Quadrant A | 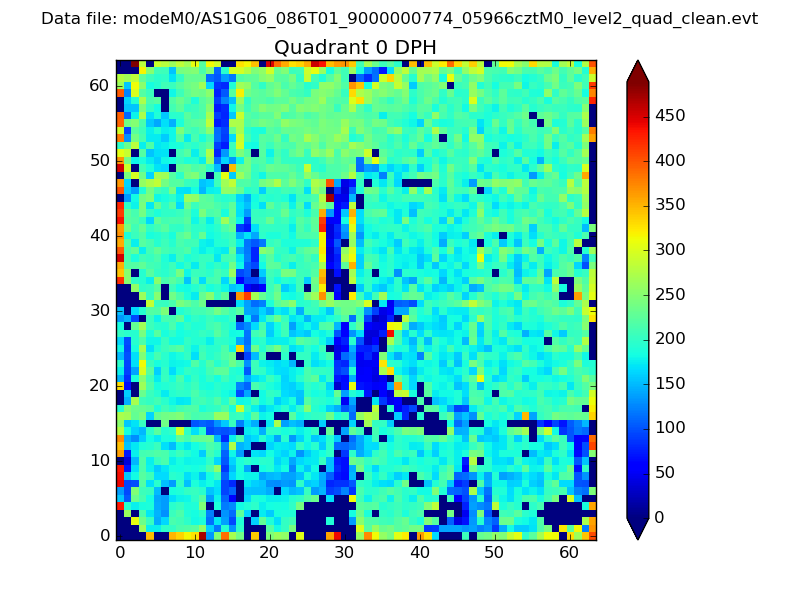 |
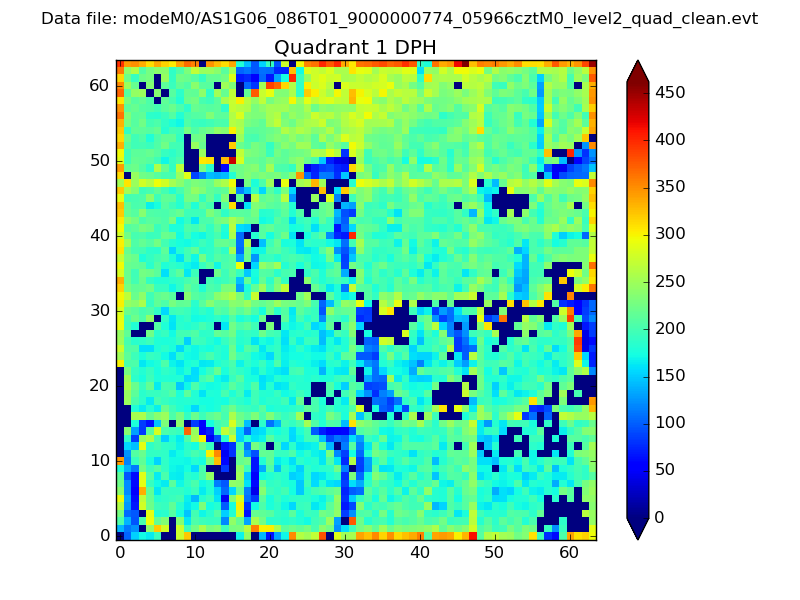 |
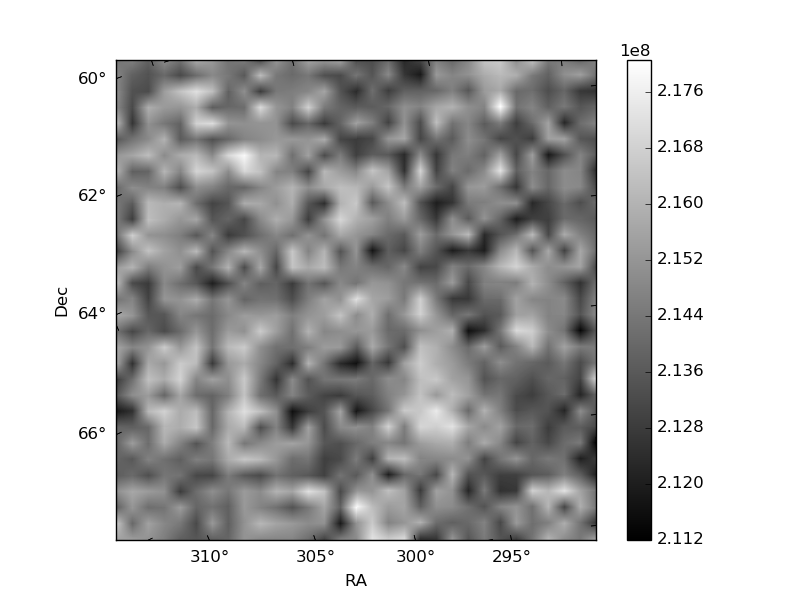
Quadrant B |
|---|---|---|---|
| Quadrant D | 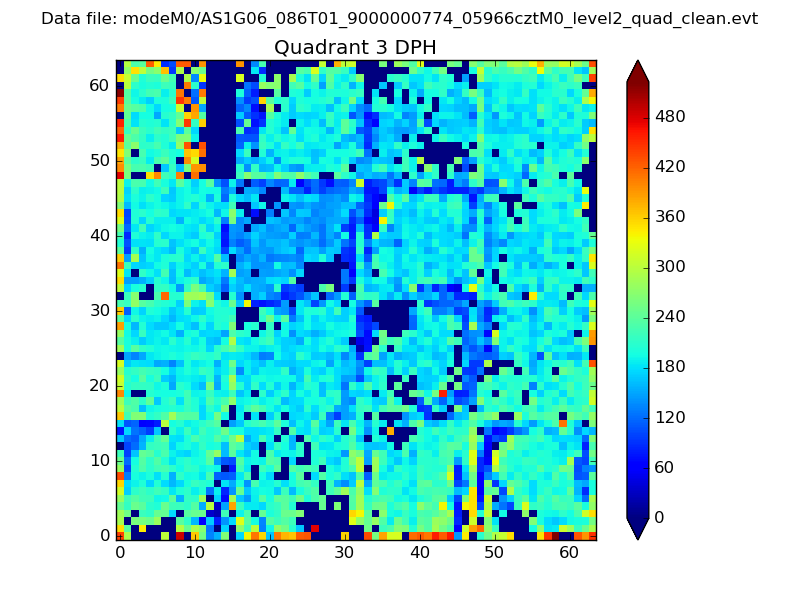 |
 |
Quadrant C |
| Plot type | Count rate plots | Images |
|---|---|---|
| Comparison with Poisson distribution Blue bars denote a histogram of data divided into 1 sec bins. Red curve is a Poisson curve with rate = median count rate of data. |
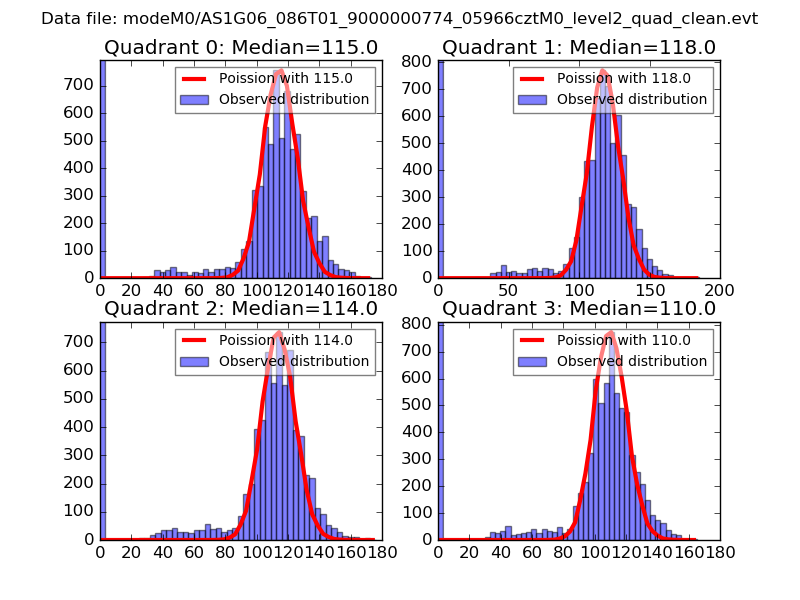 |
 |
| Quadrant-wise count rates Data is divided into 100 sec bins |
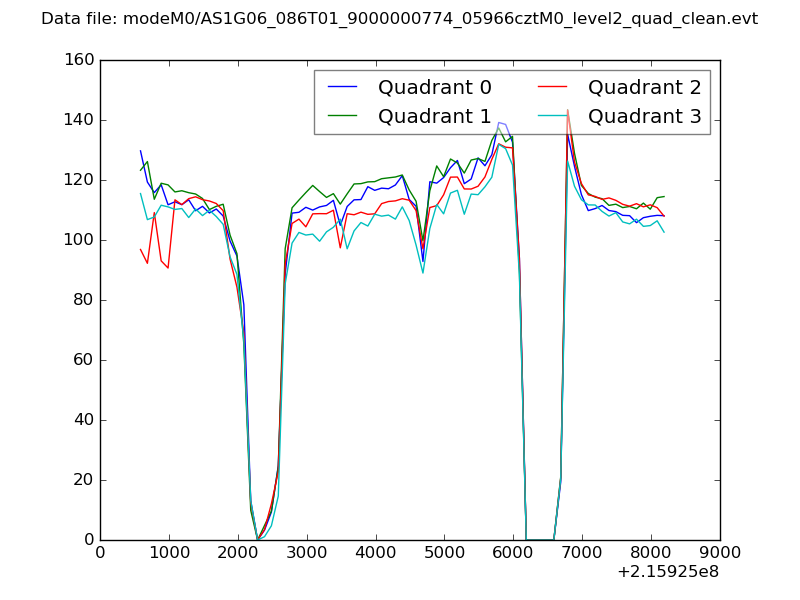 |
|
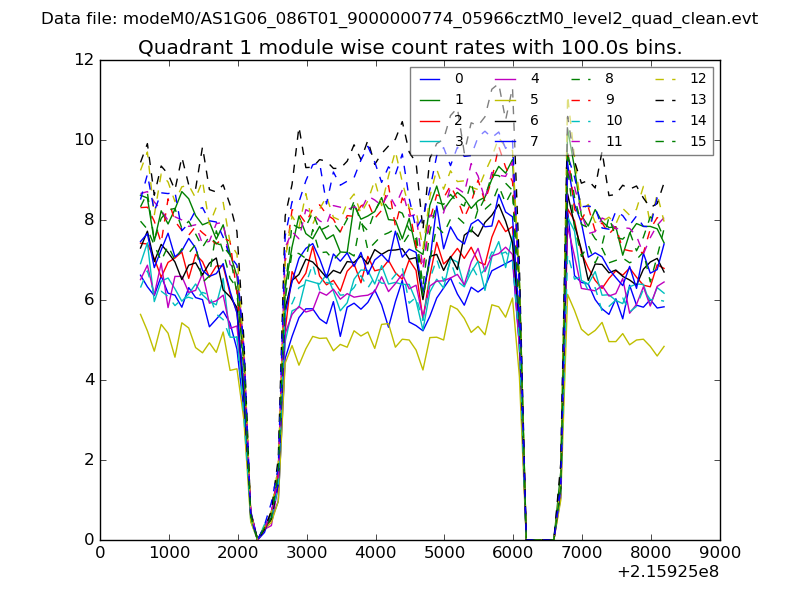
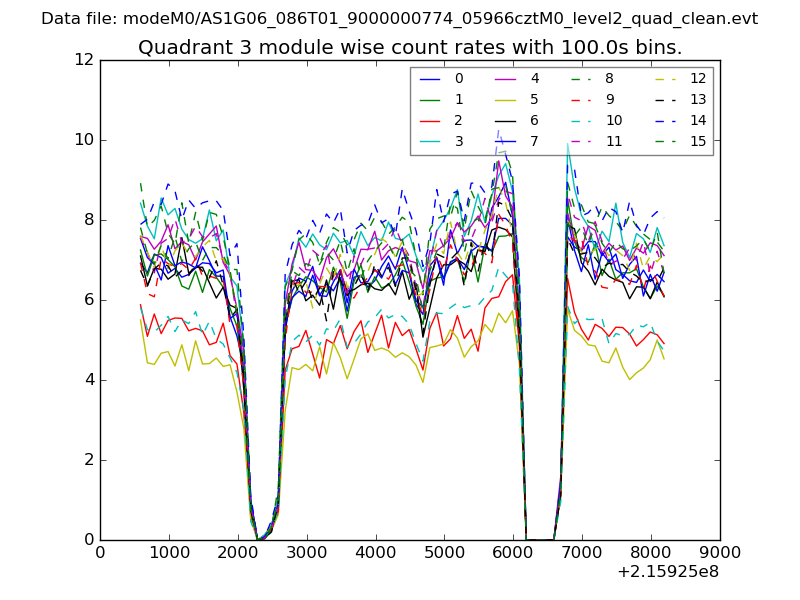
| Module-wise count rates for Quadrant A Data is divided into 100 sec bins |
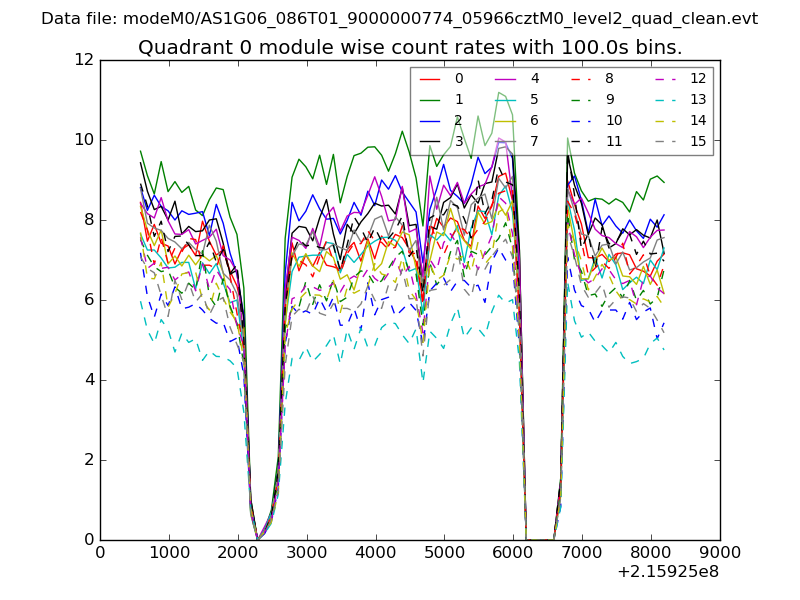 |
 |
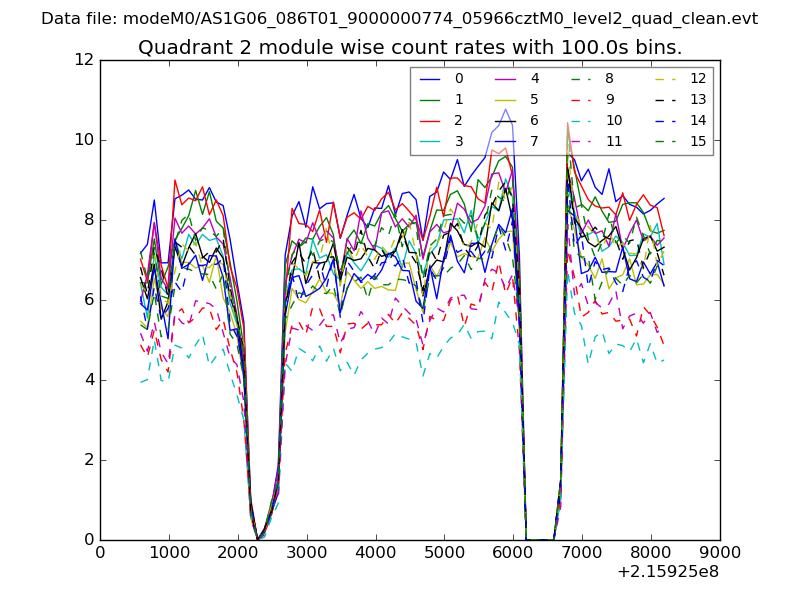
| Module-wise count rates for Quadrant B Data is divided into 100 sec bins |
 |
 |
| Module-wise count rates for Quadrant C Data is divided into 100 sec bins |
 |
 |
| Module-wise count rates for Quadrant D Data is divided into 100 sec bins |
 |
 |
| Parameter | Plot |
|---|---|
| CZT HV Monitor | 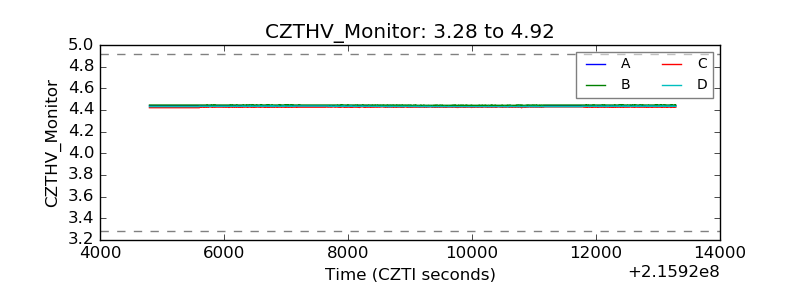 |
| D_VDD | 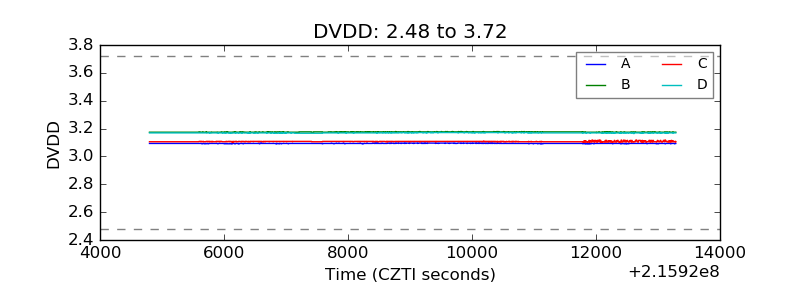 |
| Temperature 1 | 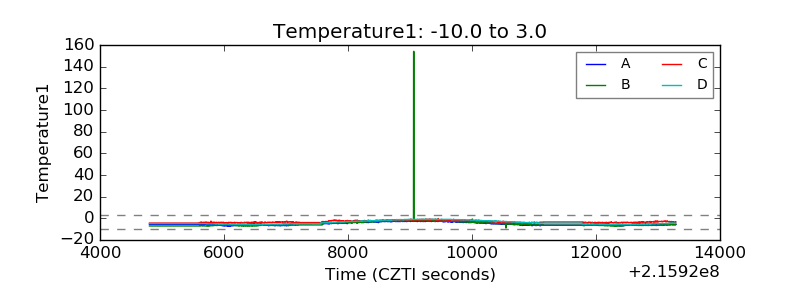 |
| Veto HV Monitor | 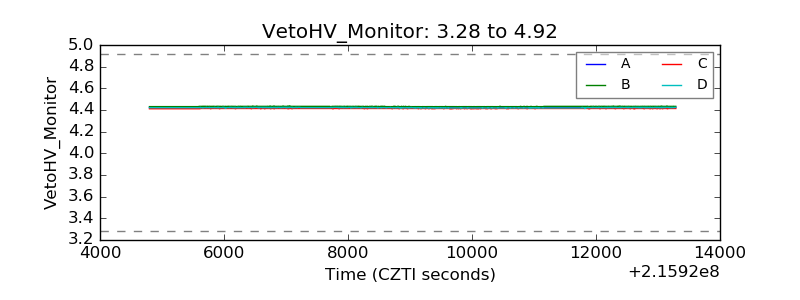 |
| Veto LLD | 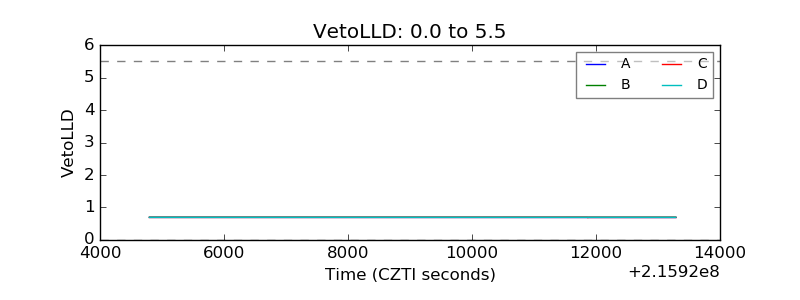 |
| Alpha Counter | 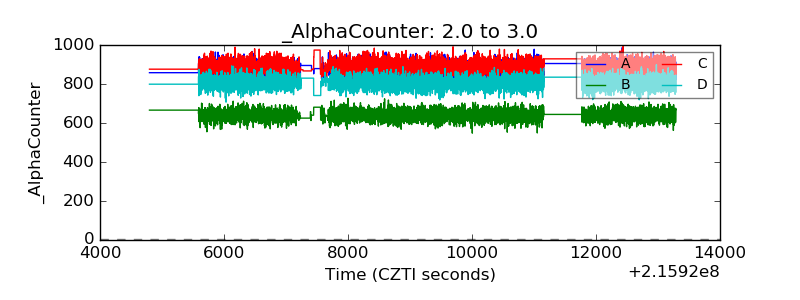 |
| _CPM_Rate | 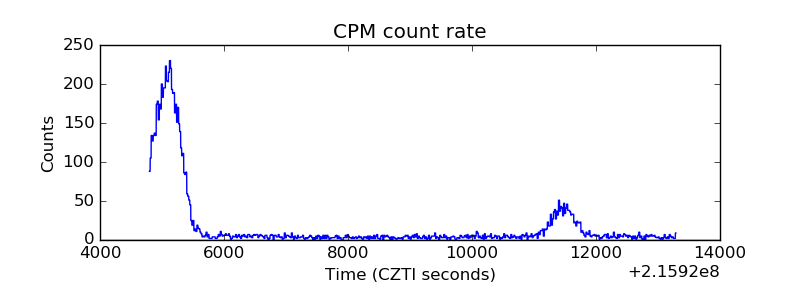 |
| CZT Counter | 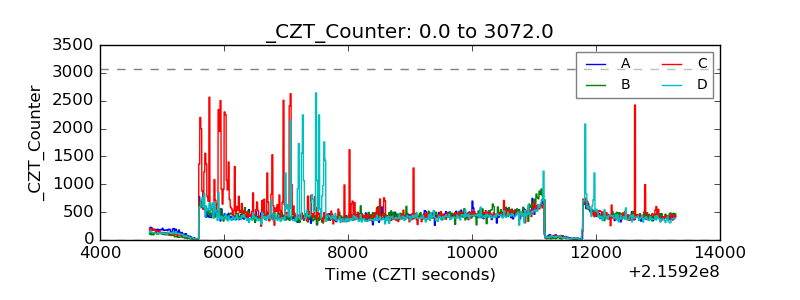 |
| +2.5 Volts monitor |  |
| +5 Volts monitor | 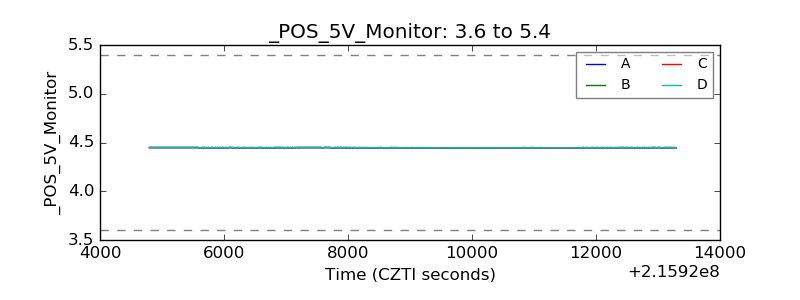 |
| _ROLL_ROT | 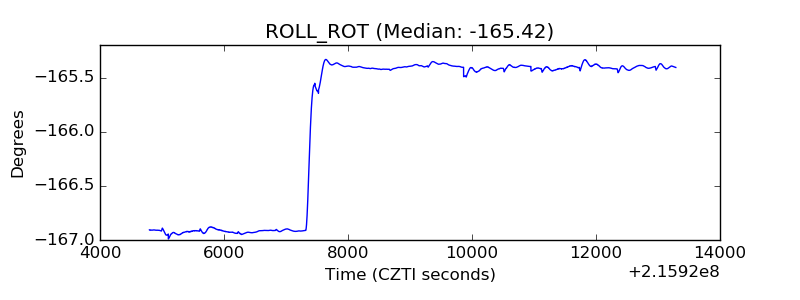 |
| _Roll_DEC | 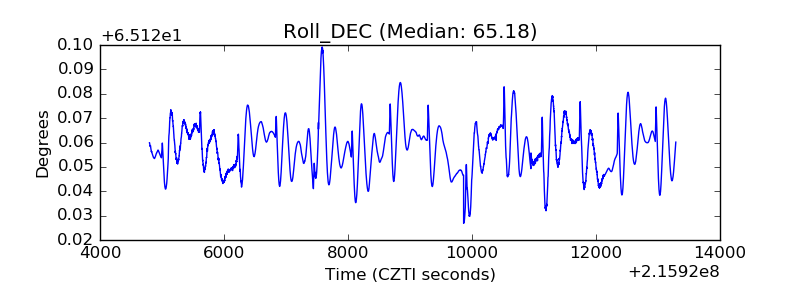 |
| _Roll_RA | 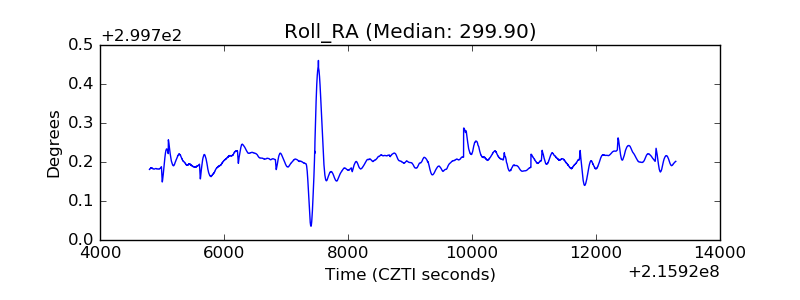 |
| Veto Counter | 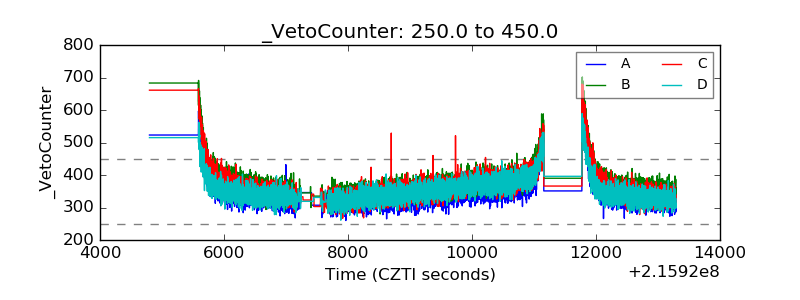 |