| Param | Original file | Final file |
|---|---|---|
| Filename | modeM0/AS1G06_086T01_9000000774_05967cztM0_level2.evt | modeM0/AS1G06_086T01_9000000774_05967cztM0_level2_quad_clean.evt |
| Size (bytes) | 387,763,200 | 109,926,720 |
| Size | 369.8 MB | 104.8 MB |
| Events in quadrant A | 2,777,846 | 726,421 |
| Events in quadrant B | 2,869,335 | 745,522 |
| Events in quadrant C | 2,891,255 | 722,845 |
| Events in quadrant D | 2,774,370 | 693,605 |
| Mode SS | |||
|---|---|---|---|
| Quadrant | BADHDUFLAG | Total packets | Discarded packets |
| A | 0 | 154 | 26 |
| B | 0 | 156 | 20 |
| C | 0 | 157 | 27 |
| D | 0 | 156 | 21 |
| Mode M9 | |||
|---|---|---|---|
| Quadrant | BADHDUFLAG | Total packets | Discarded packets |
| A | 0 | 4 | 1 |
| B | 0 | 4 | 1 |
| C | 0 | 4 | 1 |
| D | 0 | 5 | 2 |
| Mode M0 | |||
|---|---|---|---|
| Quadrant | BADHDUFLAG | Total packets | Discarded packets |
| A | 0 | 15515 | 2662 |
| B | 0 | 15676 | 2684 |
| C | 0 | 15964 | 2767 |
| D | 0 | 15790 | 2708 |
| Quadrant | Total seconds | Saturated seconds | Saturation percentage |
|---|---|---|---|
| A | 6284 | 88 | 1.400382% |
| B | 6298 | 87 | 1.381391% |
| C | 6293 | 64 | 1.017003% |
| D | 6318 | 71 | 1.123773% |
Noise dominated data is calculated using 1-second bins in cleaned event files. If a bin has >2000 counts, and if more than 50% of those come from <1% of pixels, then it is considered to be noise-dominated and hence unusable.
| Quadrant | # 1 sec bins | Bins with >0 counts | Bins with >2000 counts | High rate bins dominated by noise | Noise dominated (total time) | Noise dominated (detector-on time) | Marked lightcurve |
|---|---|---|---|---|---|---|---|
| A | 7865 | 6707 | 0 | 0 | 0.00% | 0.00% | 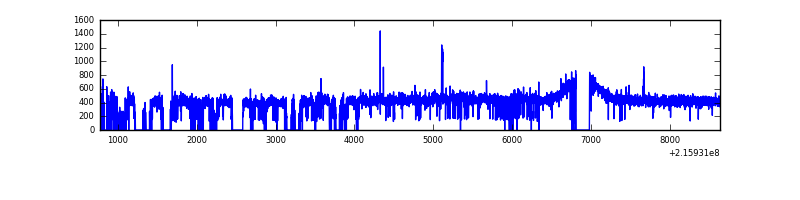 |
| B | 7866 | 6713 | 0 | 0 | 0.00% | 0.00% |  |
| C | 7866 | 6745 | 22 | 22 | 0.28% | 0.33% | 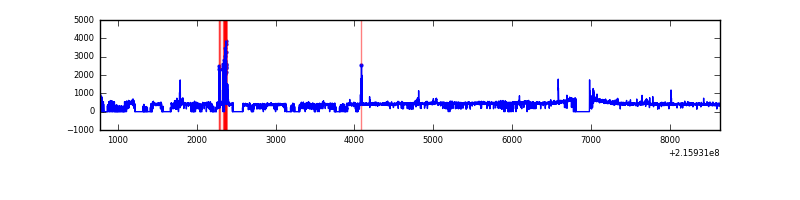 |
| D | 7866 | 6733 | 2 | 2 | 0.03% | 0.03% | 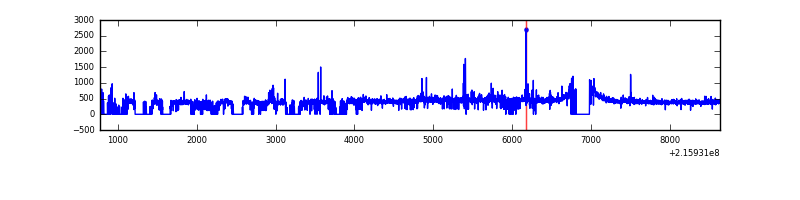 |
Top three noisy pixels from each quadrant. If the there are fewer than three noisy pixels in the level2.evt file, extra rows are filled as -1
| Pixel properties | Quadrant properties | ||||||
|---|---|---|---|---|---|---|---|
| Quadrant | DetID | PixID | Counts | Sigma | Mean | Median | Sigma |
| A | 13 | 251 | 19074 | 125.61 | 706 | 687 | 146.4 |
| A | 8 | 192 | 13611 | 88.29 | 706 | 687 | 146.4 |
| A | 15 | 31 | 10962 | 70.19 | 706 | 687 | 146.4 |
| B | 0 | 219 | 28336 | 199.23 | 715 | 698 | 138.7 |
| B | 4 | 81 | 23751 | 166.18 | 715 | 698 | 138.7 |
| B | 15 | 204 | 22817 | 159.44 | 715 | 698 | 138.7 |
| C | 9 | 247 | 161561 | 1007.7 | 685 | 685 | 159.6 |
| C | 9 | 54 | 17330 | 104.26 | 685 | 685 | 159.6 |
| C | 8 | 128 | 13416 | 79.74 | 685 | 685 | 159.6 |
| D | 12 | 110 | 77000 | 455.55 | 683 | 659 | 167.6 |
| D | 2 | 206 | 29838 | 174.12 | 683 | 659 | 167.6 |
| D | 8 | 195 | 27887 | 162.48 | 683 | 659 | 167.6 |
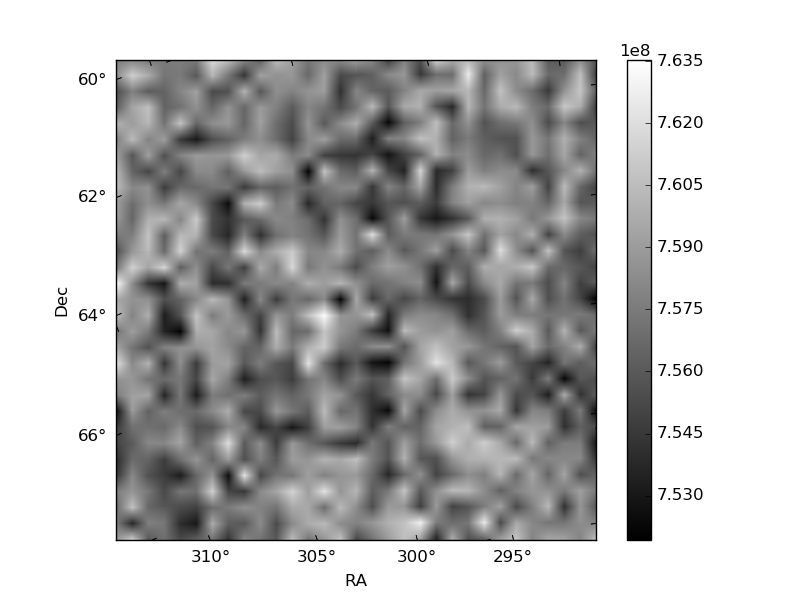
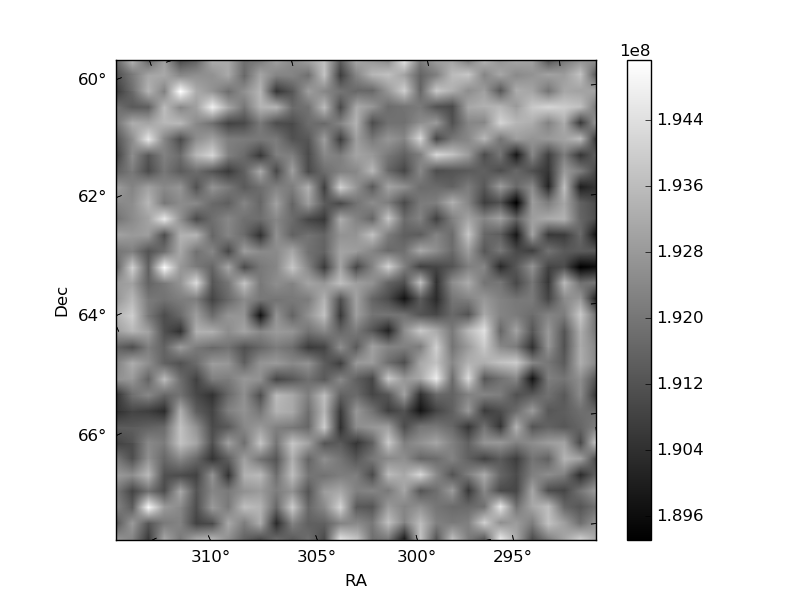
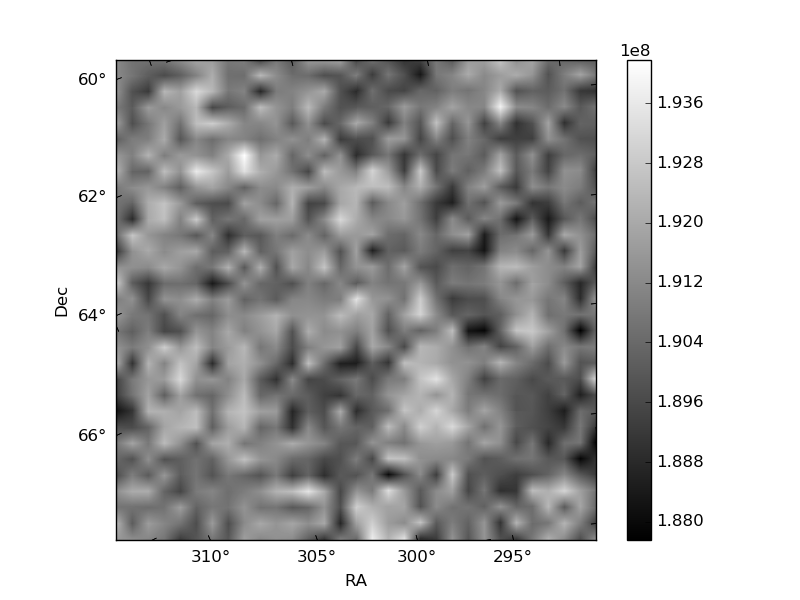
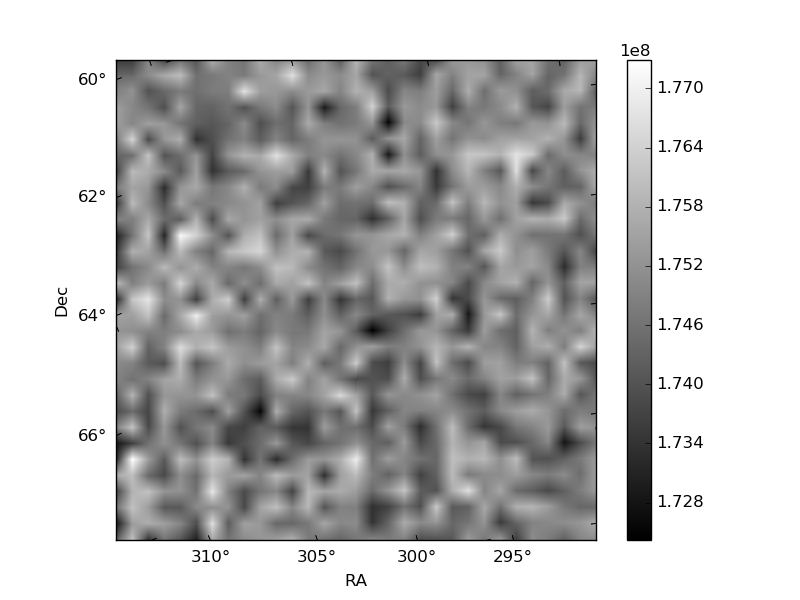
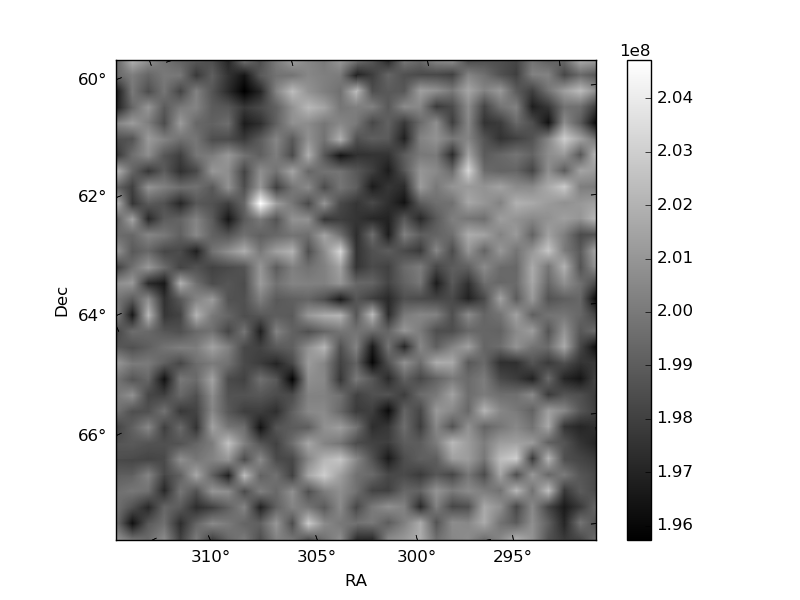
Histogram calculated using DETX and DETY for each event in the final _common_clean file
| Quadrant A | 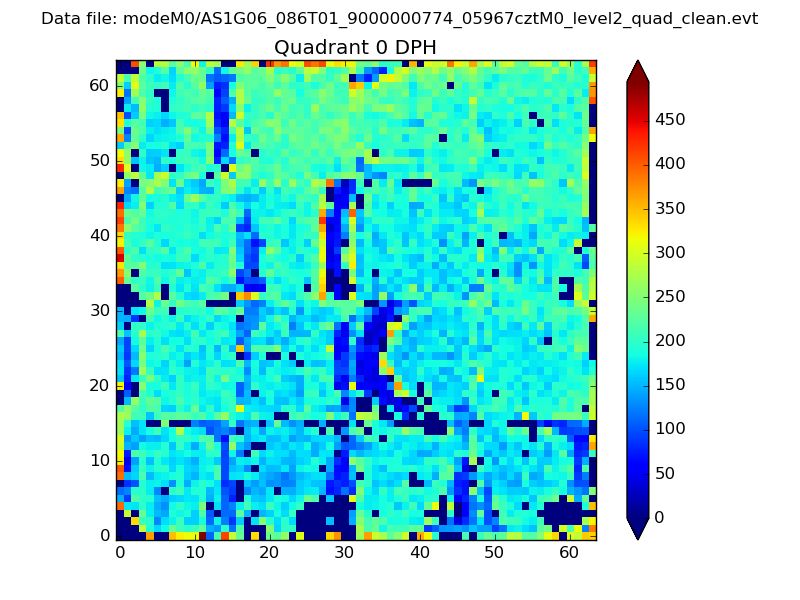 |
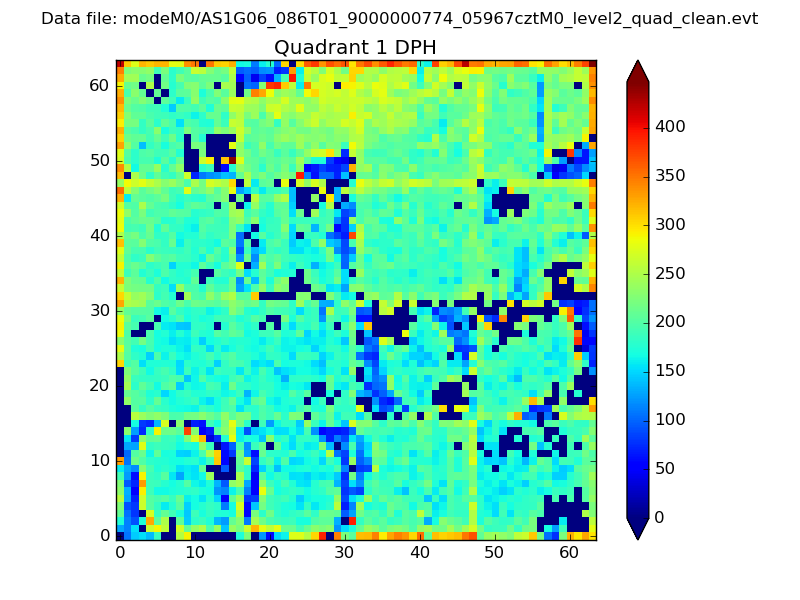 |
Quadrant B |
|---|---|---|---|
| Quadrant D | 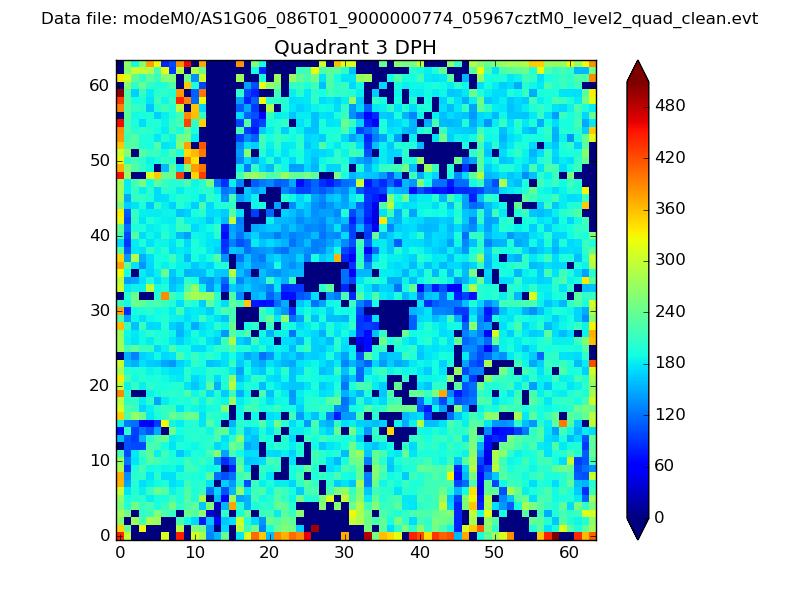 |
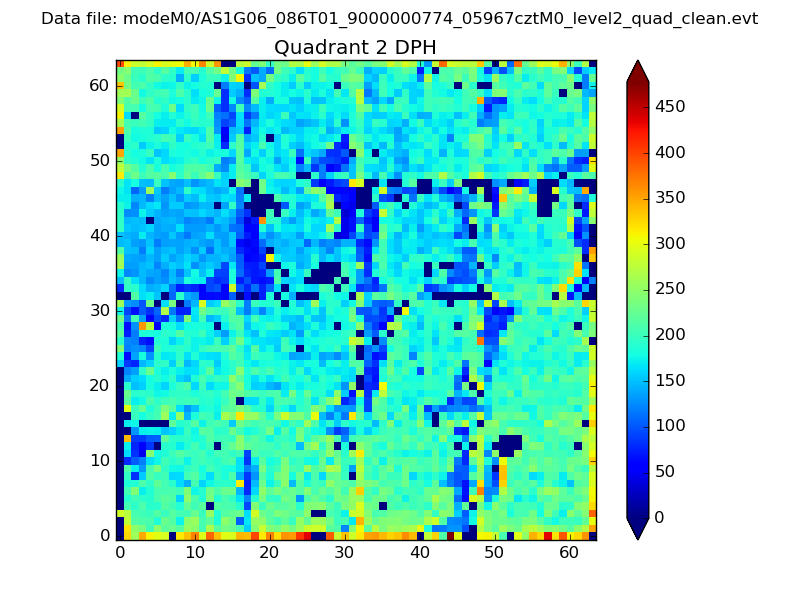 |
Quadrant C |
| Plot type | Count rate plots | Images |
|---|---|---|
| Comparison with Poisson distribution Blue bars denote a histogram of data divided into 1 sec bins. Red curve is a Poisson curve with rate = median count rate of data. |
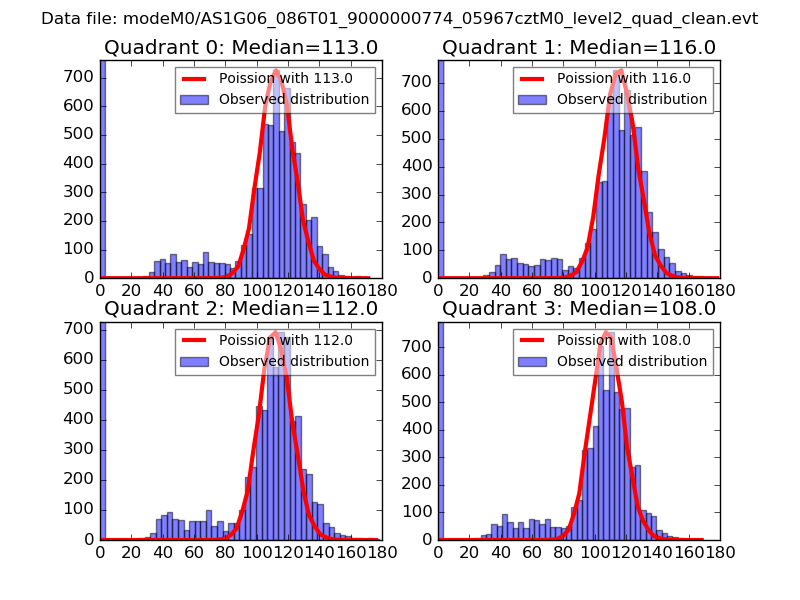 |
 |
| Quadrant-wise count rates Data is divided into 100 sec bins |
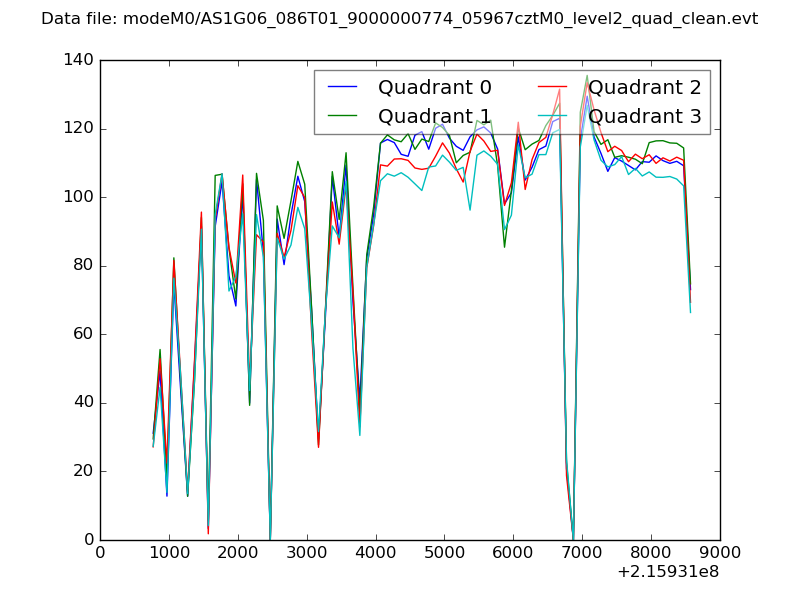 |
|
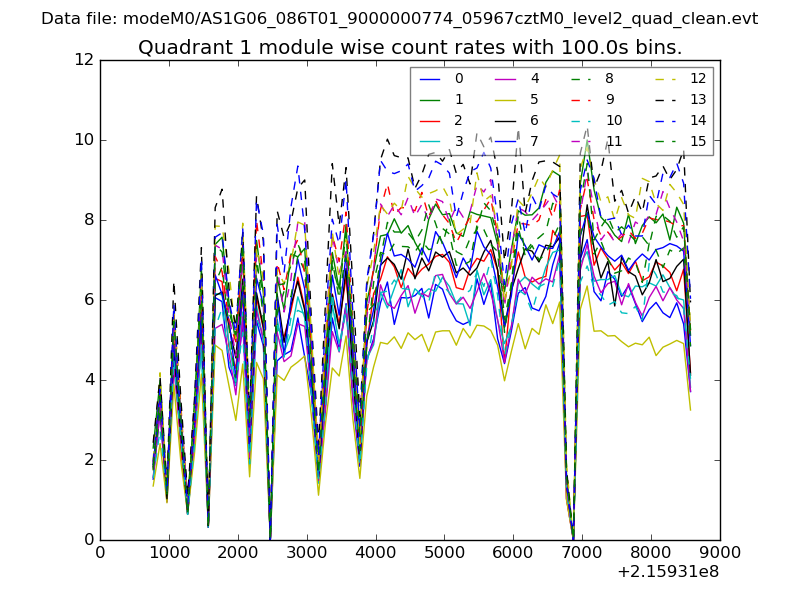
| Module-wise count rates for Quadrant A Data is divided into 100 sec bins |
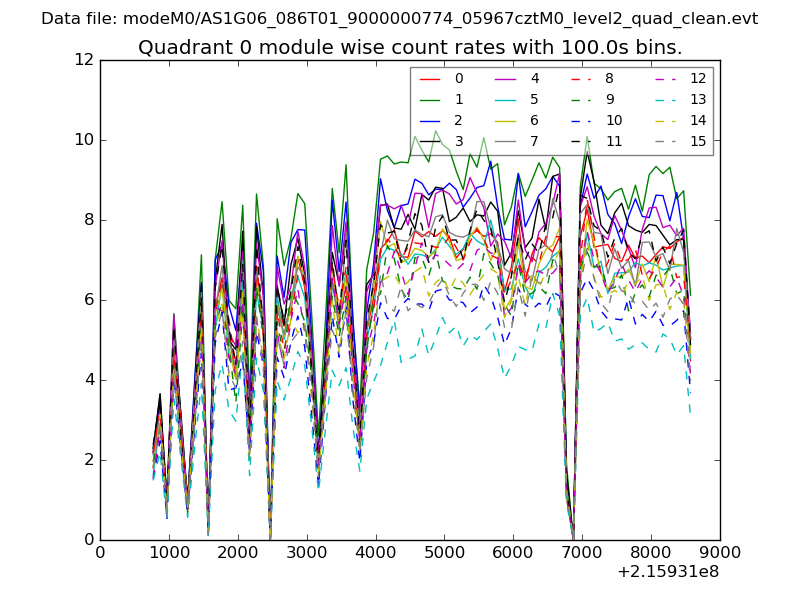 |
 |
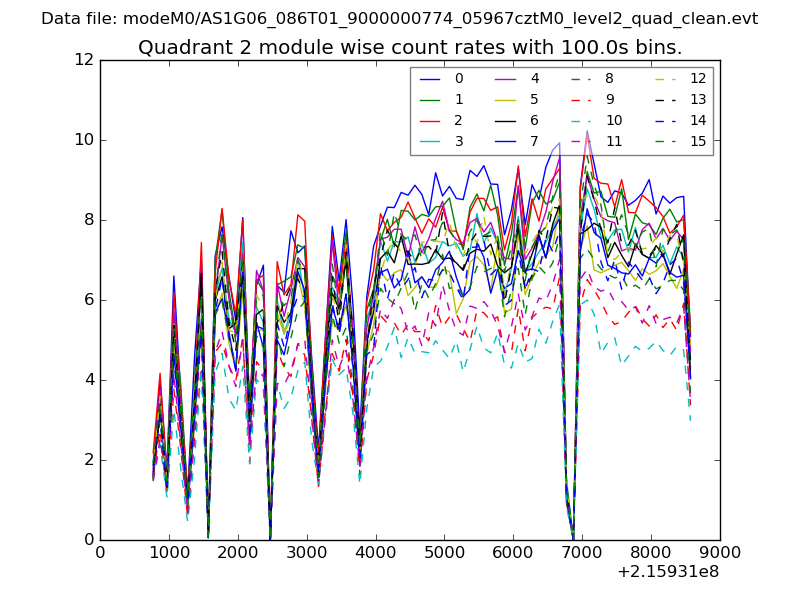
| Module-wise count rates for Quadrant B Data is divided into 100 sec bins |
 |
 |
| Module-wise count rates for Quadrant C Data is divided into 100 sec bins |
 |
 |
| Module-wise count rates for Quadrant D Data is divided into 100 sec bins |
 |
 |
| Parameter | Plot |
|---|---|
| CZT HV Monitor | 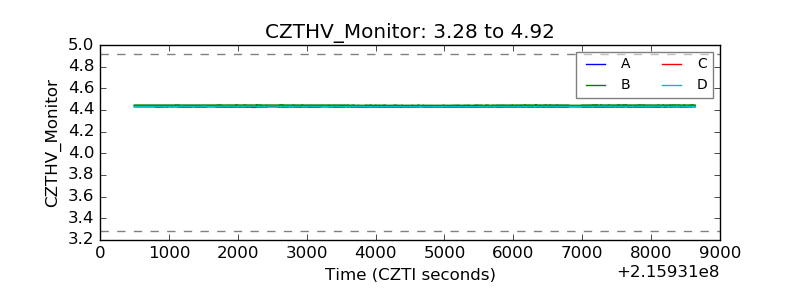 |
| D_VDD | 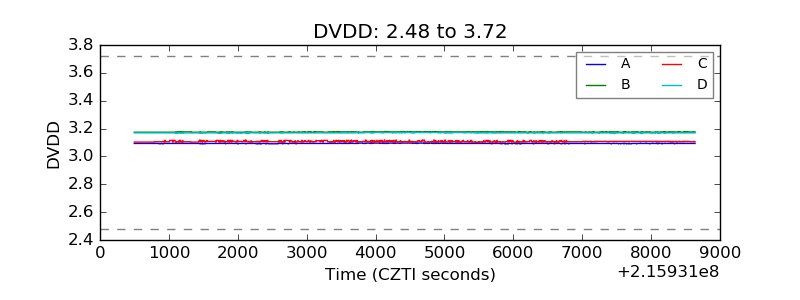 |
| Temperature 1 | 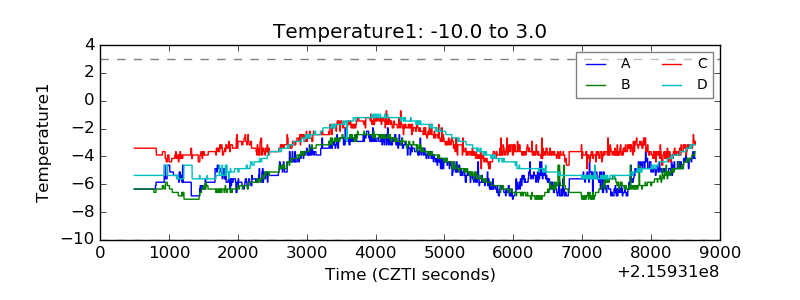 |
| Veto HV Monitor | 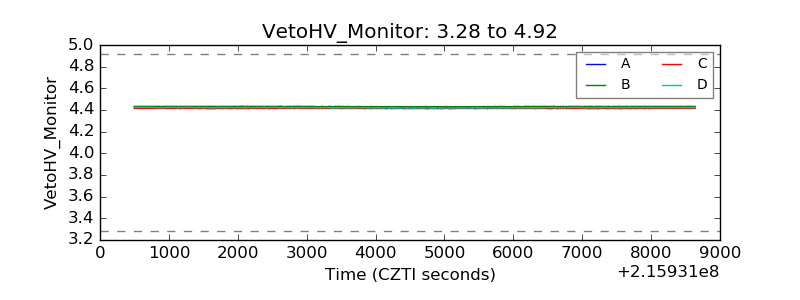 |
| Veto LLD | 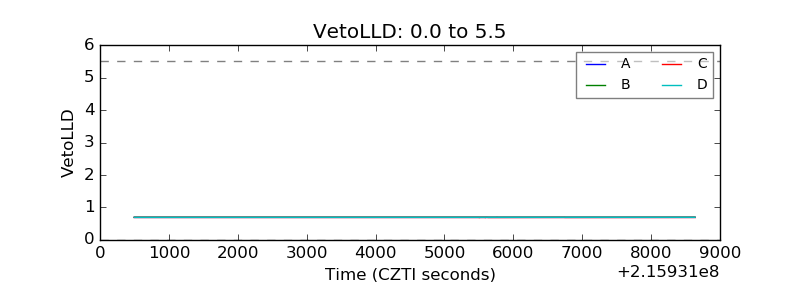 |
| Alpha Counter | 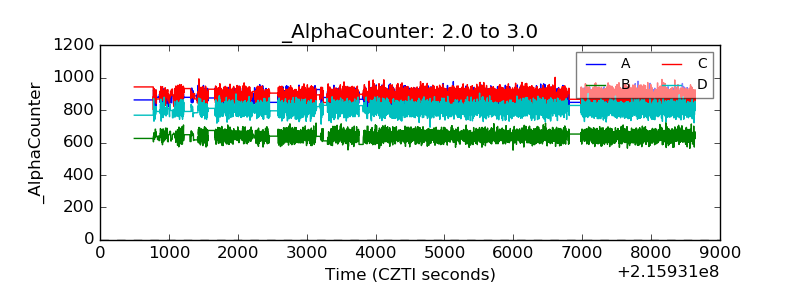 |
| _CPM_Rate | 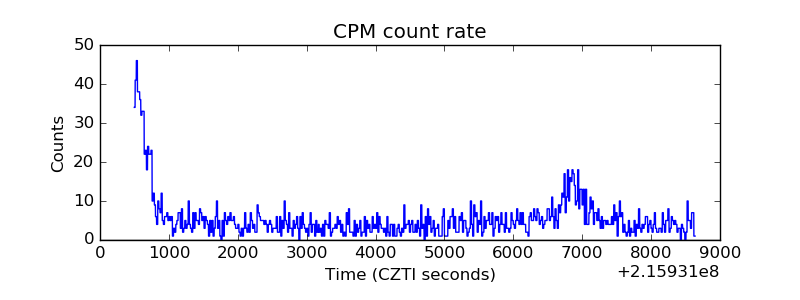 |
| CZT Counter | 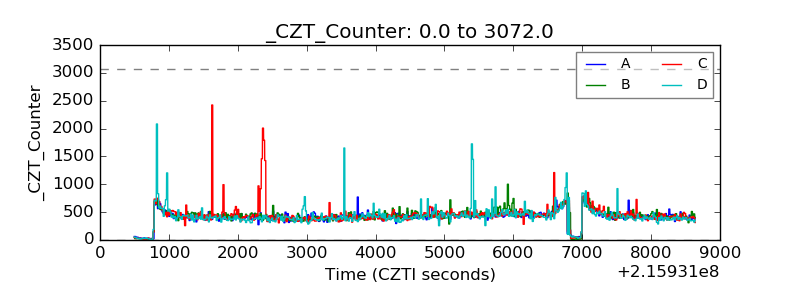 |
| +2.5 Volts monitor |  |
| +5 Volts monitor |  |
| _ROLL_ROT | 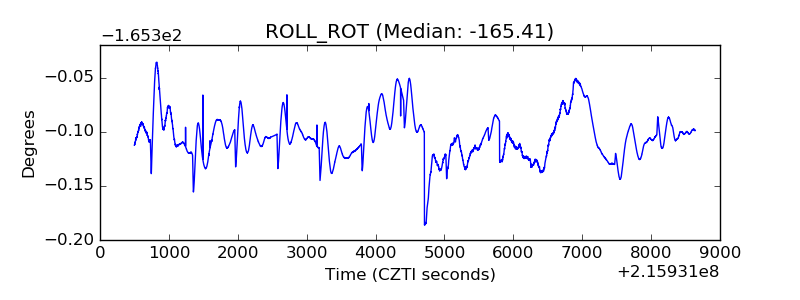 |
| _Roll_DEC | 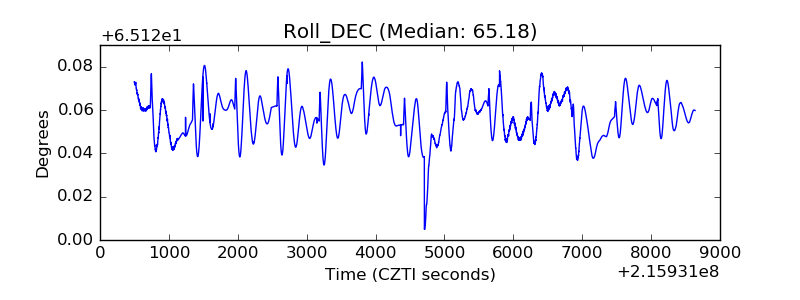 |
| _Roll_RA | 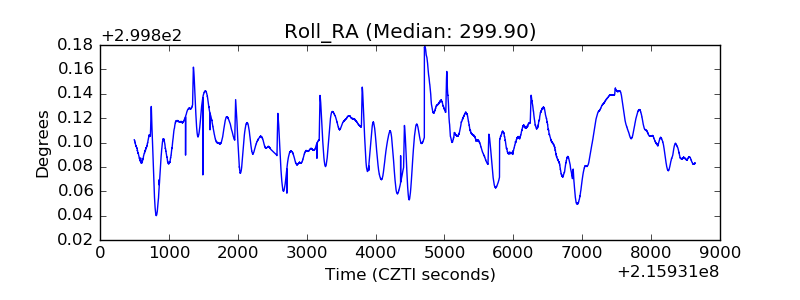 |
| Veto Counter | 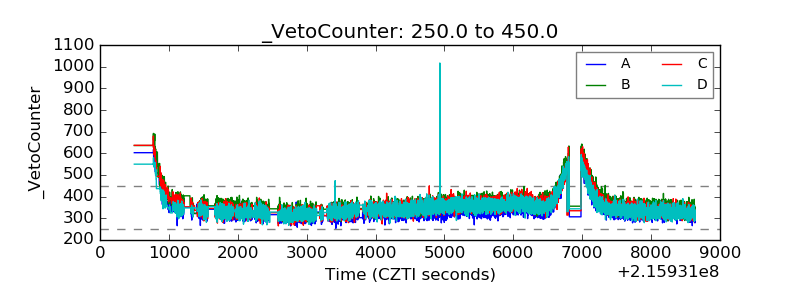 |