| Param | Original file | Final file |
|---|---|---|
| Filename | modeM0/AS1G06_086T01_9000000774_05975cztM0_level2.evt | modeM0/AS1G06_086T01_9000000774_05975cztM0_level2_quad_clean.evt |
| Size (bytes) | 473,584,320 | 119,401,920 |
| Size | 451.6 MB | 113.9 MB |
| Events in quadrant A | 3,476,990 | 804,802 |
| Events in quadrant B | 3,125,353 | 829,824 |
| Events in quadrant C | 2,931,395 | 807,515 |
| Events in quadrant D | 4,367,863 | 721,493 |
| Mode SS | |||
|---|---|---|---|
| Quadrant | BADHDUFLAG | Total packets | Discarded packets |
| A | 0 | 132 | 0 |
| B | 0 | 132 | 0 |
| C | 0 | 132 | 0 |
| D | 0 | 132 | 0 |
| Mode M9 | |||
|---|---|---|---|
| Quadrant | BADHDUFLAG | Total packets | Discarded packets |
| A | 0 | 17 | 0 |
| B | 0 | 17 | 0 |
| C | 0 | 17 | 0 |
| D | 0 | 18 | 0 |
| Mode M0 | |||
|---|---|---|---|
| Quadrant | BADHDUFLAG | Total packets | Discarded packets |
| A | 0 | 14776 | 5 |
| B | 0 | 13721 | 2 |
| C | 0 | 13248 | 5 |
| D | 0 | 17550 | 2 |
| Quadrant | Total seconds | Saturated seconds | Saturation percentage |
|---|---|---|---|
| A | 6487 | 32 | 0.493294% |
| B | 6488 | 26 | 0.400740% |
| C | 6487 | 23 | 0.354555% |
| D | 6488 | 587 | 9.047472% |
Noise dominated data is calculated using 1-second bins in cleaned event files. If a bin has >2000 counts, and if more than 50% of those come from <1% of pixels, then it is considered to be noise-dominated and hence unusable.
| Quadrant | # 1 sec bins | Bins with >0 counts | Bins with >2000 counts | High rate bins dominated by noise | Noise dominated (total time) | Noise dominated (detector-on time) | Marked lightcurve |
|---|---|---|---|---|---|---|---|
| A | 7653 | 6489 | 3 | 3 | 0.04% | 0.05% | 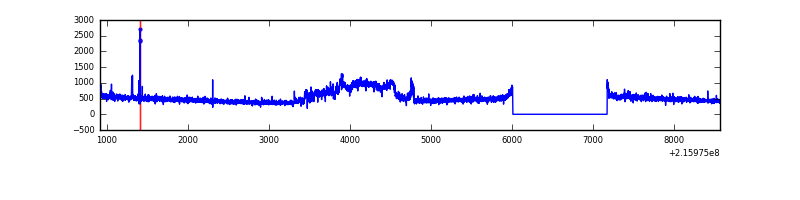 |
| B | 7653 | 6489 | 1 | 1 | 0.01% | 0.02% |  |
| C | 7653 | 6489 | 0 | 0 | 0.00% | 0.00% | 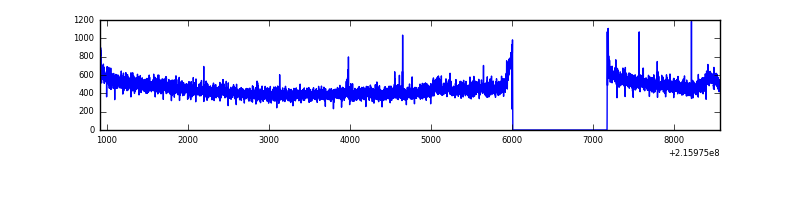 |
| D | 7653 | 6489 | 430 | 430 | 5.62% | 6.63% | 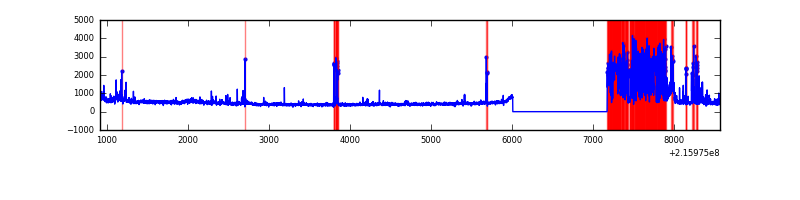 |
Top three noisy pixels from each quadrant. If the there are fewer than three noisy pixels in the level2.evt file, extra rows are filled as -1
| Pixel properties | Quadrant properties | ||||||
|---|---|---|---|---|---|---|---|
| Quadrant | DetID | PixID | Counts | Sigma | Mean | Median | Sigma |
| A | 15 | 234 | 566296 | 3779.61 | 743 | 727 | 149.6 |
| A | 8 | 192 | 36524 | 239.23 | 743 | 727 | 149.6 |
| A | 4 | 2 | 9357 | 57.67 | 743 | 727 | 149.6 |
| B | 15 | 204 | 69119 | 480.55 | 756 | 740 | 142.3 |
| B | 4 | 81 | 36353 | 250.28 | 756 | 740 | 142.3 |
| B | 0 | 219 | 31406 | 215.51 | 756 | 740 | 142.3 |
| C | 14 | 206 | 40198 | 232.73 | 734 | 737 | 169.6 |
| C | 1 | 16 | 12319 | 68.31 | 734 | 737 | 169.6 |
| C | 9 | 54 | 7743 | 41.32 | 734 | 737 | 169.6 |
| D | 2 | 63 | 1432305 | 8362.11 | 692 | 668 | 171.2 |
| D | 1 | 239 | 112497 | 653.19 | 692 | 668 | 171.2 |
| D | 8 | 195 | 56618 | 326.8 | 692 | 668 | 171.2 |
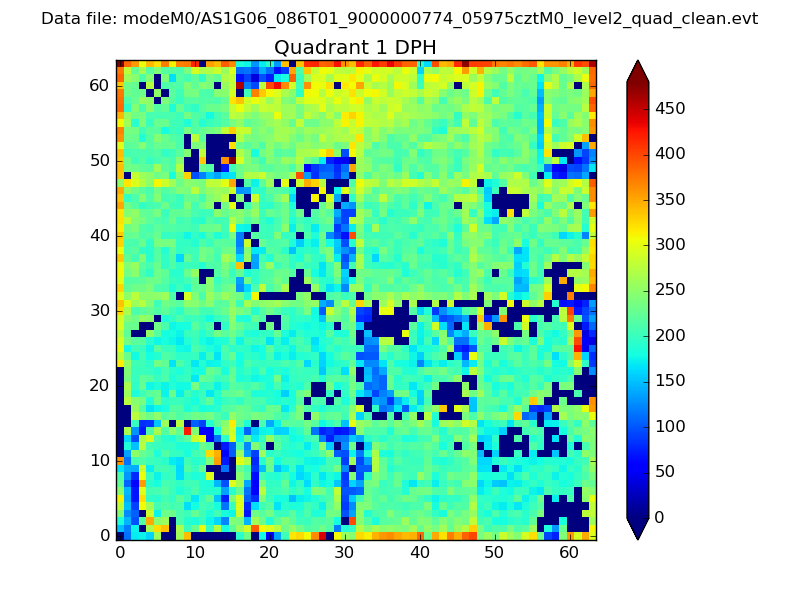
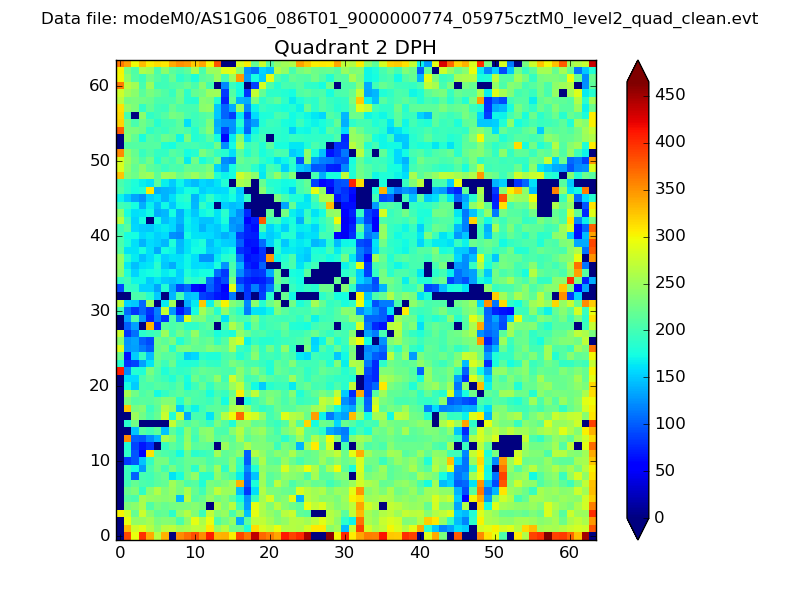
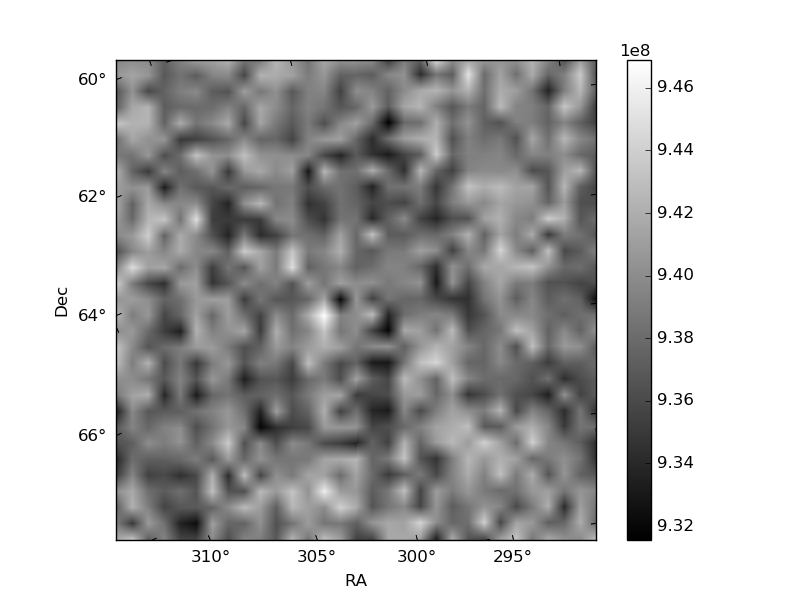
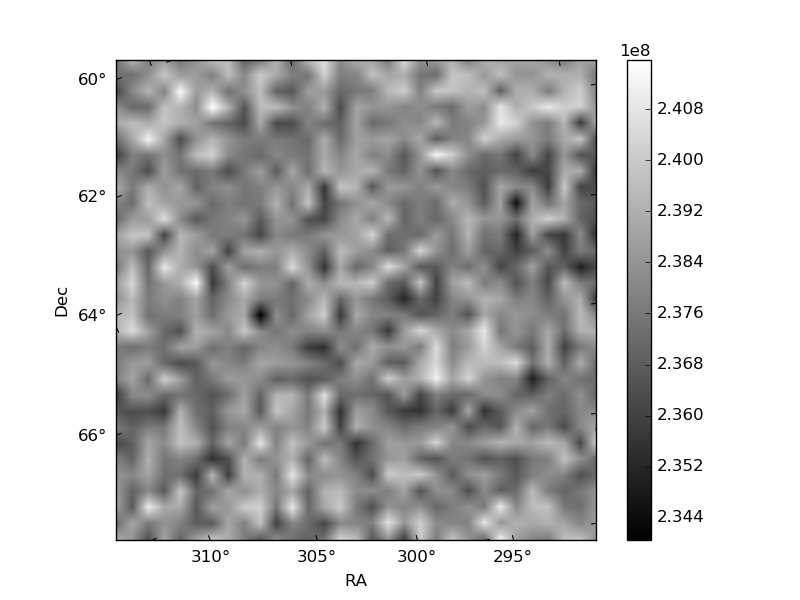
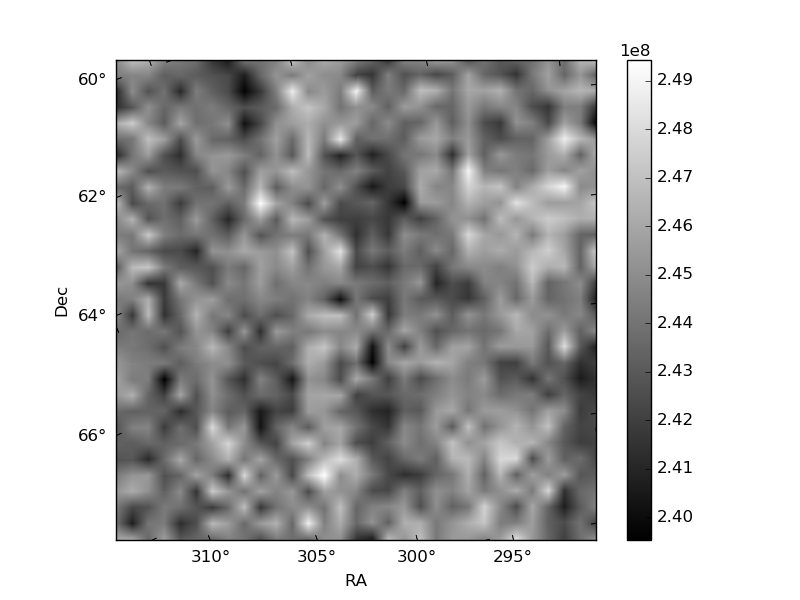
Histogram calculated using DETX and DETY for each event in the final _common_clean file
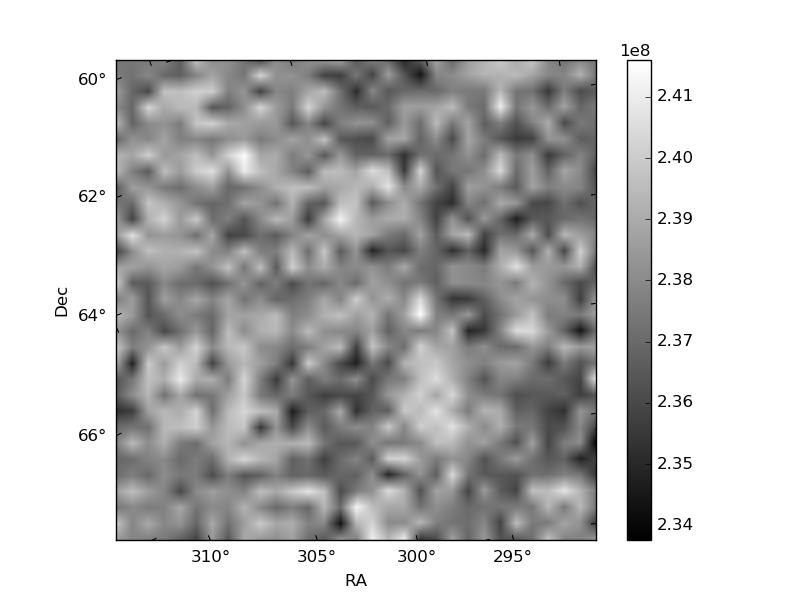
| Quadrant A | 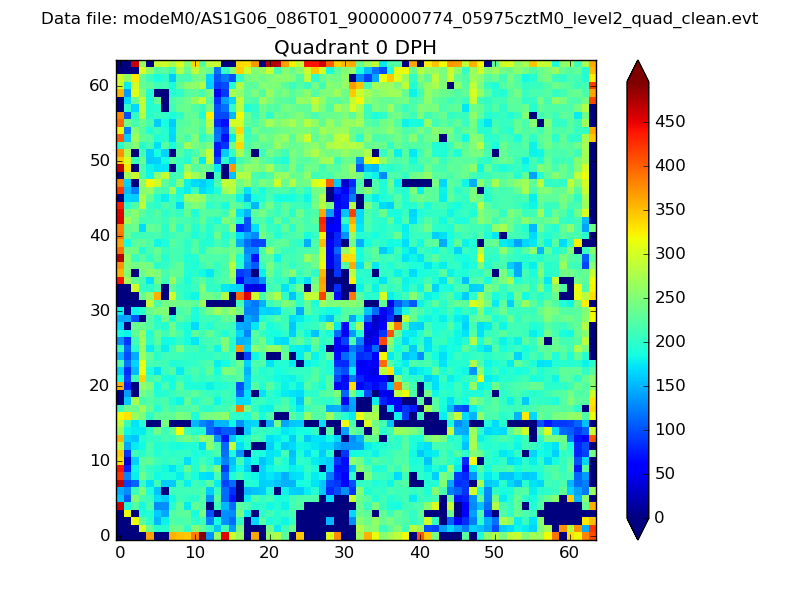 |
 |
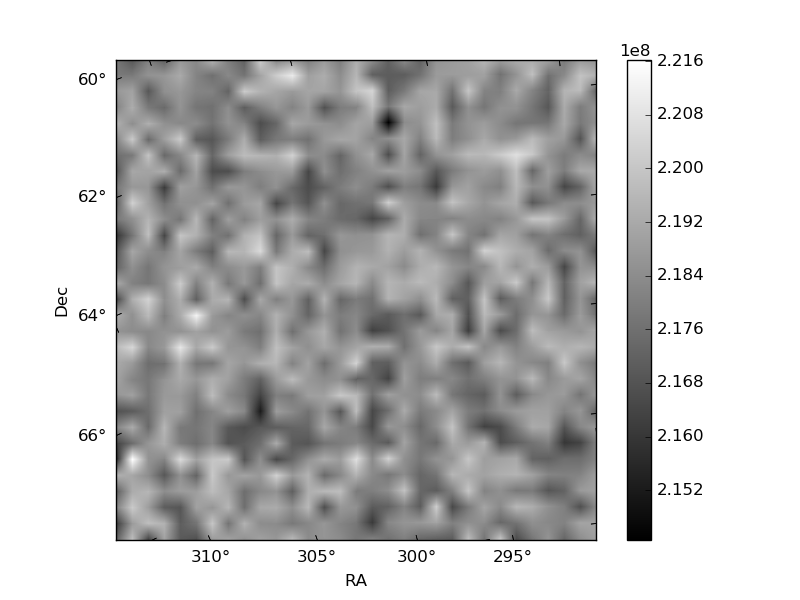
Quadrant B |
|---|---|---|---|
| Quadrant D | 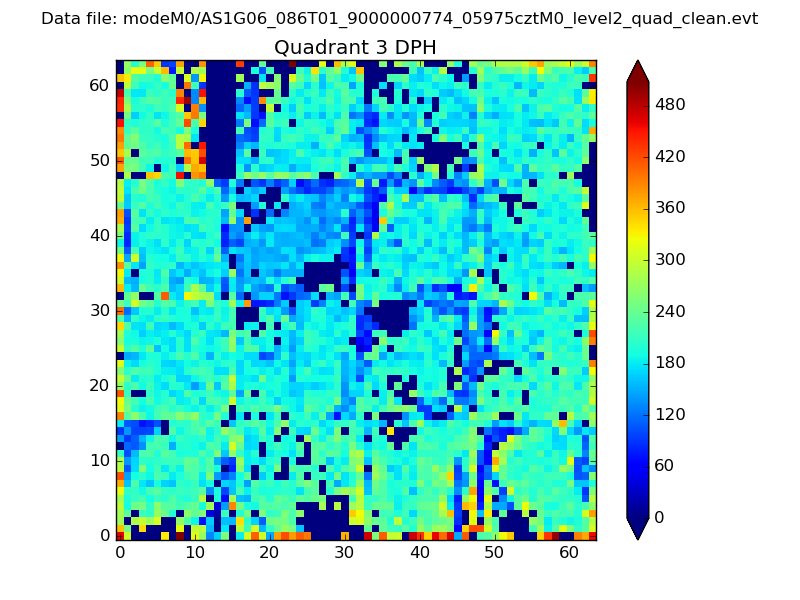 |
 |
Quadrant C |
| Plot type | Count rate plots | Images |
|---|---|---|
| Comparison with Poisson distribution Blue bars denote a histogram of data divided into 1 sec bins. Red curve is a Poisson curve with rate = median count rate of data. |
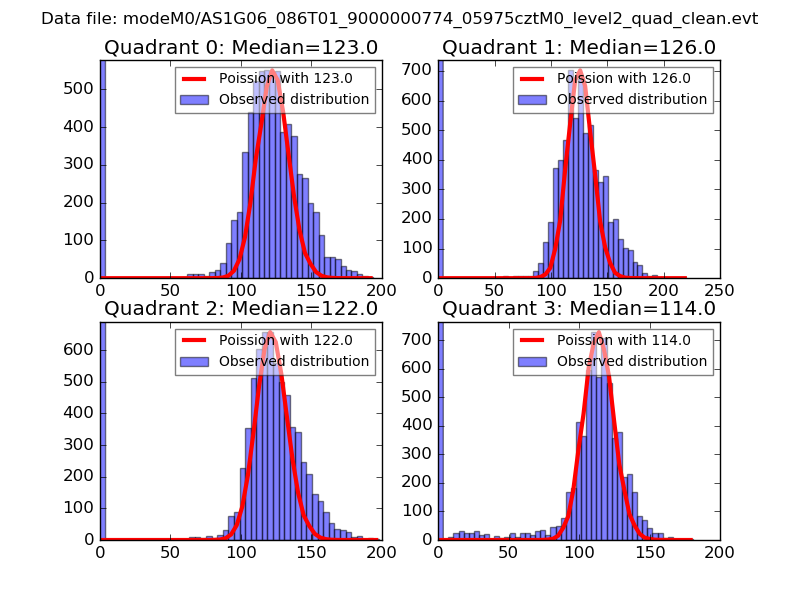 |
 |
| Quadrant-wise count rates Data is divided into 100 sec bins |
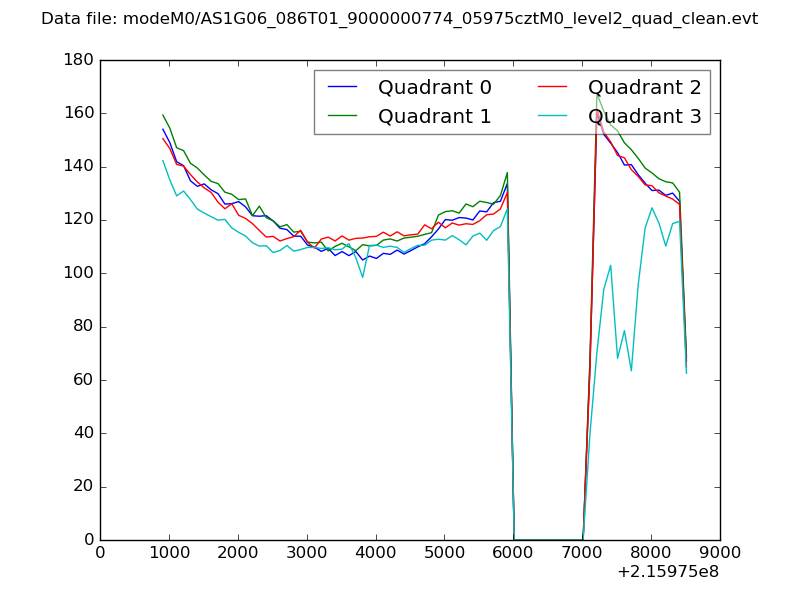 |
|
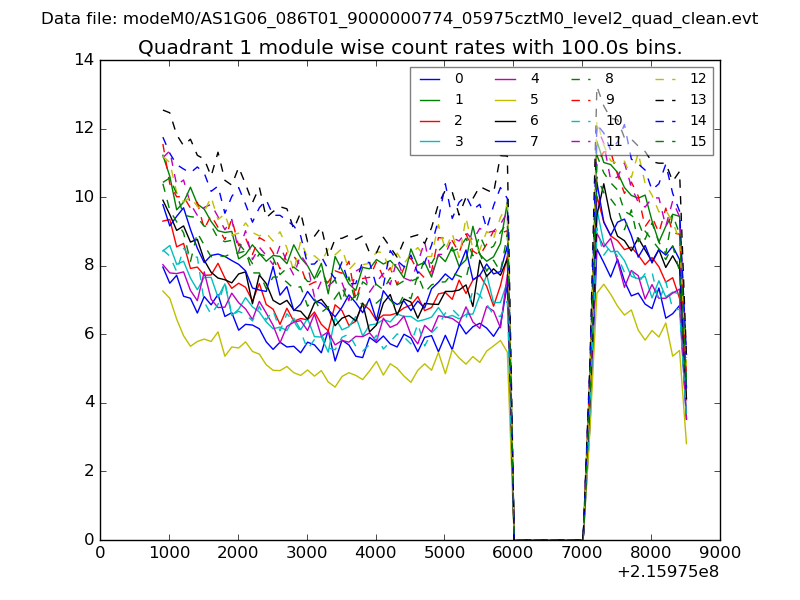
| Module-wise count rates for Quadrant A Data is divided into 100 sec bins |
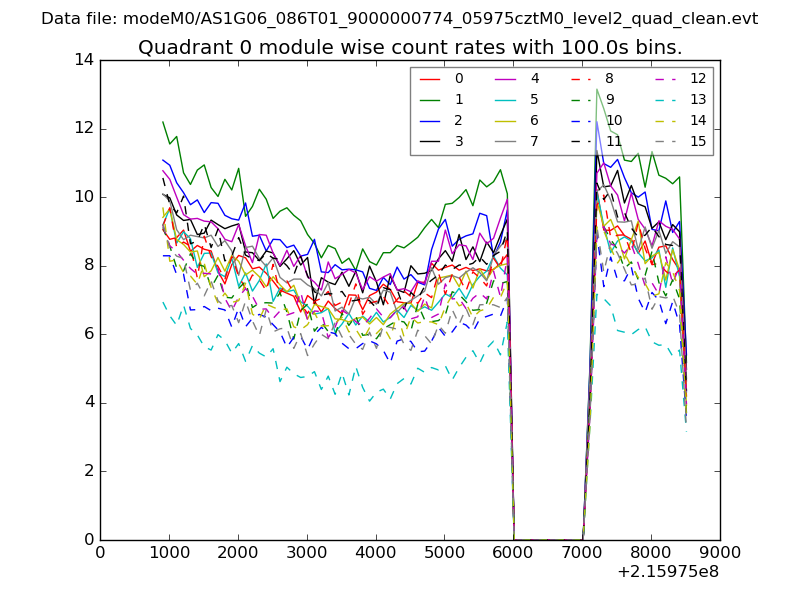 |
 |
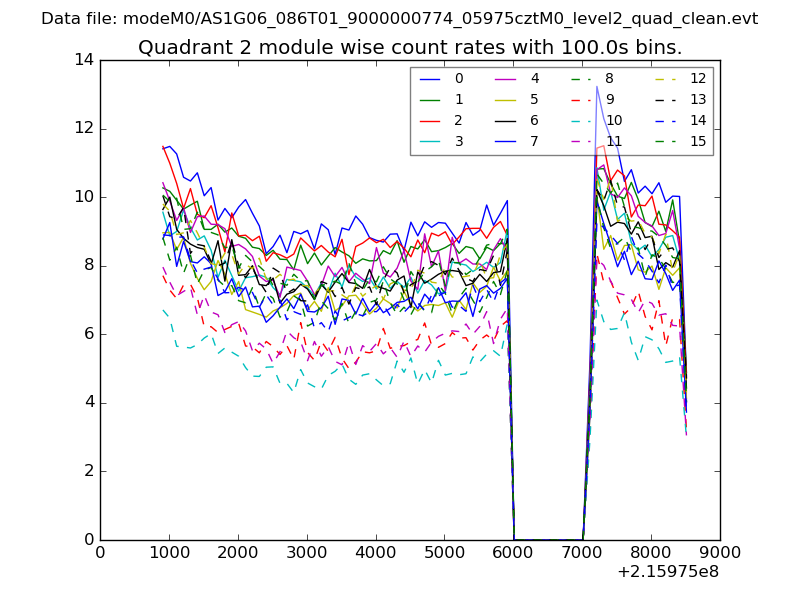
| Module-wise count rates for Quadrant B Data is divided into 100 sec bins |
 |
 |
| Module-wise count rates for Quadrant C Data is divided into 100 sec bins |
 |
 |
| Module-wise count rates for Quadrant D Data is divided into 100 sec bins |
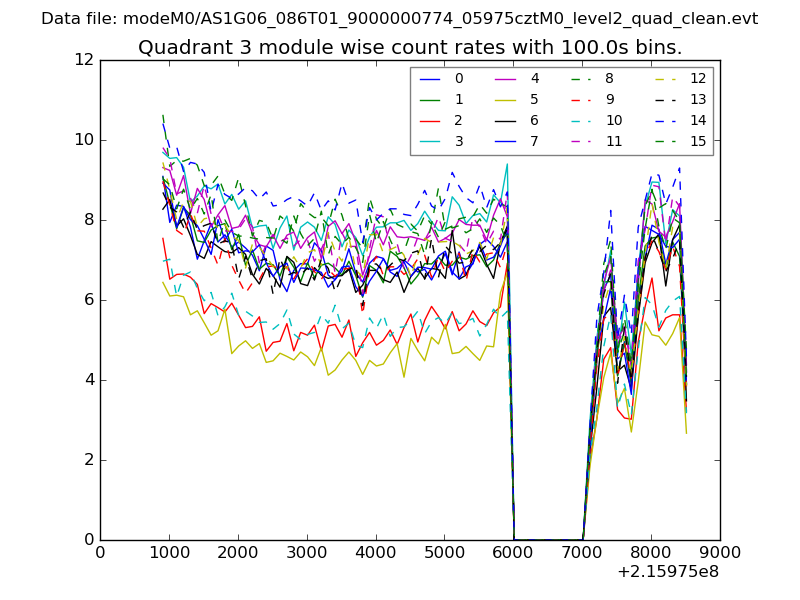 |
 |
| Parameter | Plot |
|---|---|
| CZT HV Monitor | 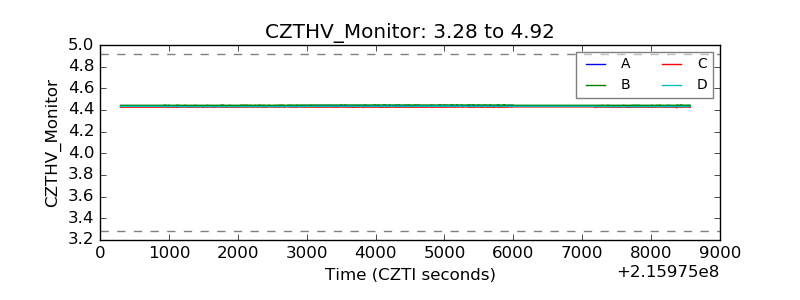 |
| D_VDD | 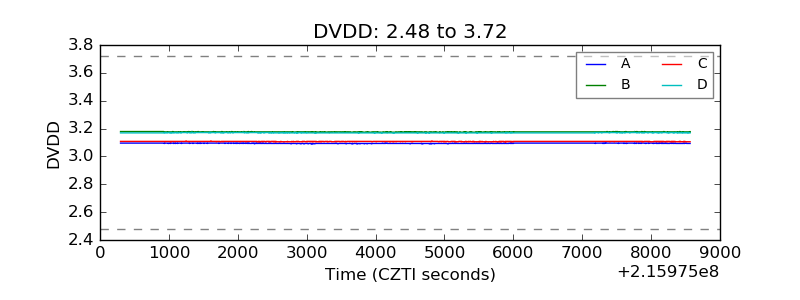 |
| Temperature 1 | 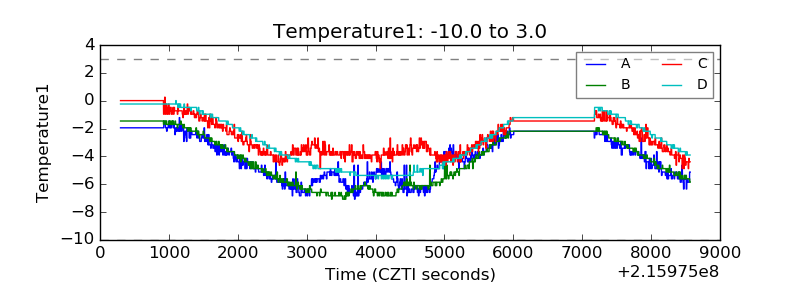 |
| Veto HV Monitor | 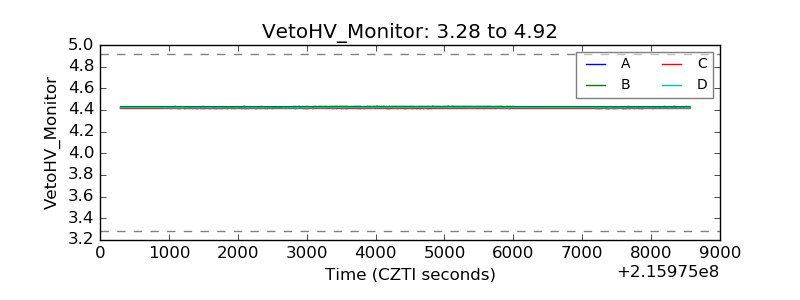 |
| Veto LLD | 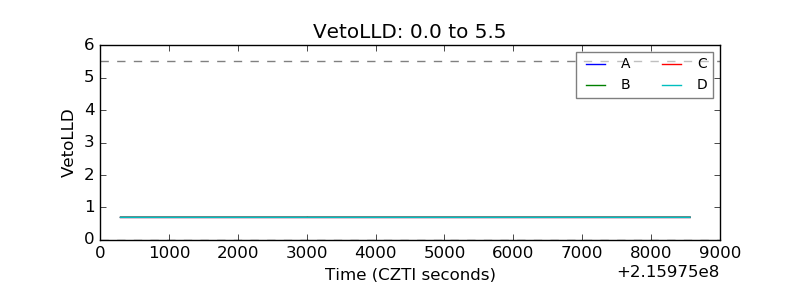 |
| Alpha Counter | 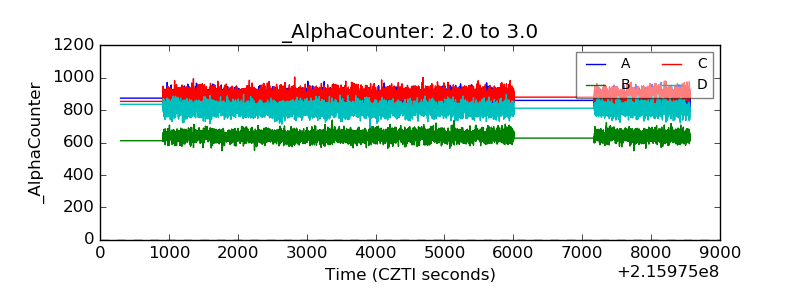 |
| _CPM_Rate | 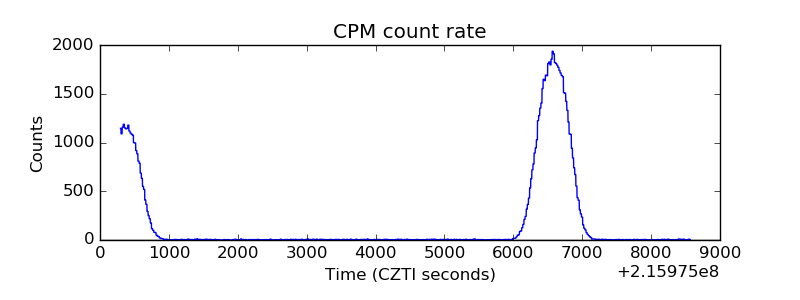 |
| CZT Counter | 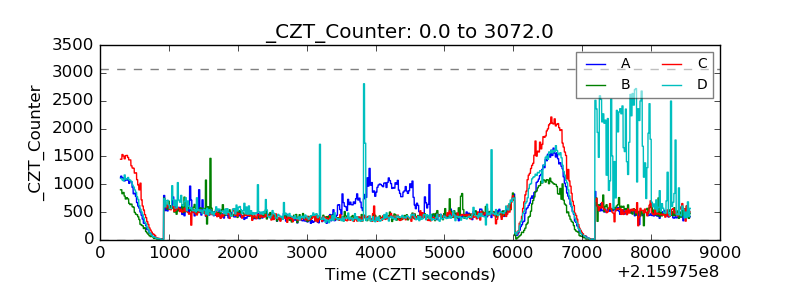 |
| +2.5 Volts monitor |  |
| +5 Volts monitor |  |
| _ROLL_ROT | 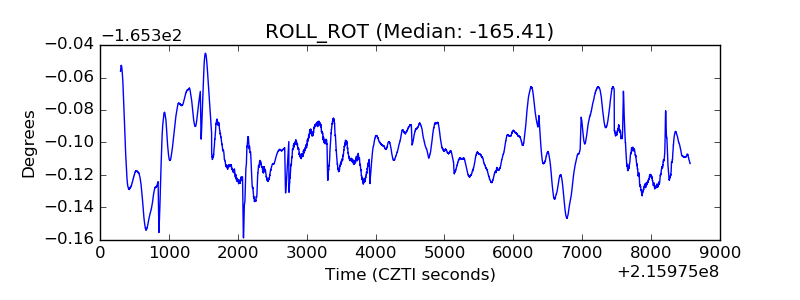 |
| _Roll_DEC | 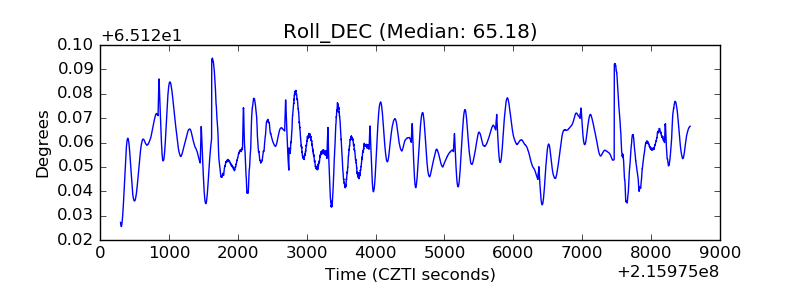 |
| _Roll_RA | 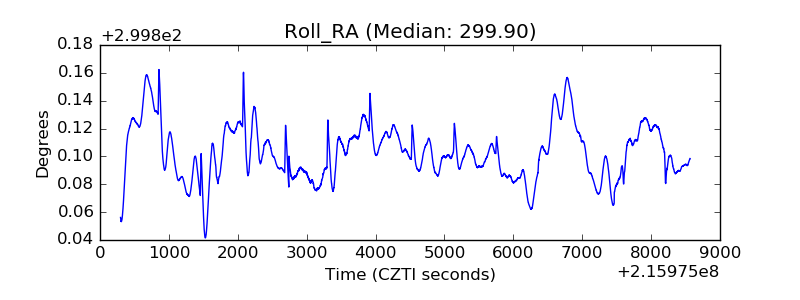 |
| Veto Counter | 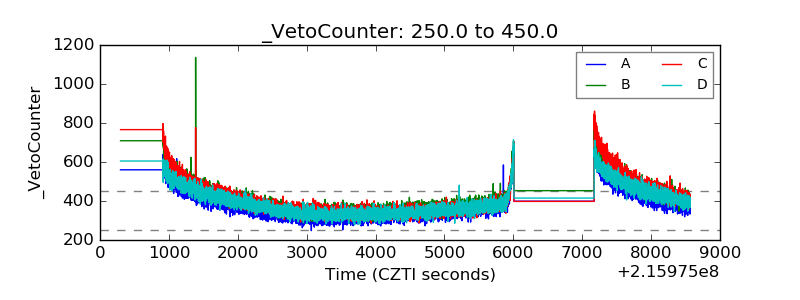 |