| Param | Original file | Final file |
|---|---|---|
| Filename | modeM0/AS1G06_086T01_9000000774_05976cztM0_level2.evt | modeM0/AS1G06_086T01_9000000774_05976cztM0_level2_quad_clean.evt |
| Size (bytes) | 471,090,240 | 120,274,560 |
| Size | 449.3 MB | 114.7 MB |
| Events in quadrant A | 2,943,829 | 812,343 |
| Events in quadrant B | 3,040,946 | 843,468 |
| Events in quadrant C | 2,914,087 | 818,364 |
| Events in quadrant D | 4,935,344 | 724,113 |
| Mode SS | |||
|---|---|---|---|
| Quadrant | BADHDUFLAG | Total packets | Discarded packets |
| A | 0 | 128 | 0 |
| B | 0 | 128 | 0 |
| C | 0 | 128 | 0 |
| D | 0 | 128 | 0 |
| Mode M9 | |||
|---|---|---|---|
| Quadrant | BADHDUFLAG | Total packets | Discarded packets |
| A | 0 | 17 | 0 |
| B | 0 | 17 | 0 |
| C | 0 | 17 | 0 |
| D | 0 | 18 | 0 |
| Mode M0 | |||
|---|---|---|---|
| Quadrant | BADHDUFLAG | Total packets | Discarded packets |
| A | 0 | 13187 | 5 |
| B | 0 | 13386 | 4 |
| C | 0 | 13076 | 2 |
| D | 0 | 19087 | 2 |
| Quadrant | Total seconds | Saturated seconds | Saturation percentage |
|---|---|---|---|
| A | 6371 | 24 | 0.376707% |
| B | 6371 | 21 | 0.329619% |
| C | 6372 | 19 | 0.298180% |
| D | 6372 | 658 | 10.326428% |
Noise dominated data is calculated using 1-second bins in cleaned event files. If a bin has >2000 counts, and if more than 50% of those come from <1% of pixels, then it is considered to be noise-dominated and hence unusable.
| Quadrant | # 1 sec bins | Bins with >0 counts | Bins with >2000 counts | High rate bins dominated by noise | Noise dominated (total time) | Noise dominated (detector-on time) | Marked lightcurve |
|---|---|---|---|---|---|---|---|
| A | 7617 | 6373 | 4 | 4 | 0.05% | 0.06% | 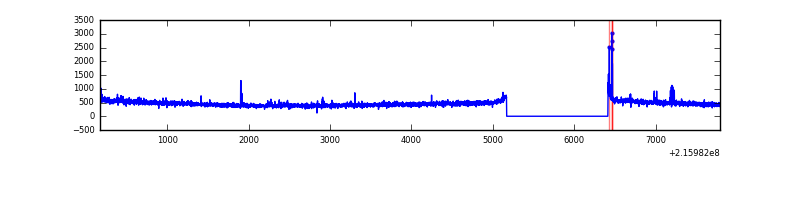 |
| B | 7617 | 6373 | 2 | 2 | 0.03% | 0.03% | 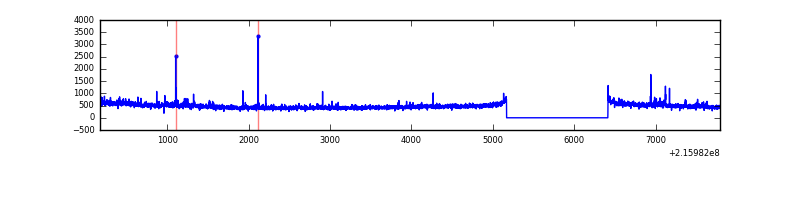 |
| C | 7617 | 6373 | 0 | 0 | 0.00% | 0.00% | 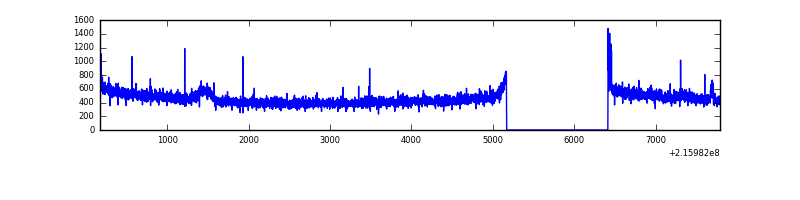 |
| D | 7617 | 6373 | 511 | 511 | 6.71% | 8.02% | 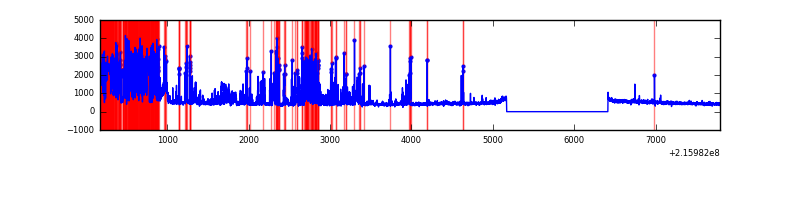 |
Top three noisy pixels from each quadrant. If the there are fewer than three noisy pixels in the level2.evt file, extra rows are filled as -1
| Pixel properties | Quadrant properties | ||||||
|---|---|---|---|---|---|---|---|
| Quadrant | DetID | PixID | Counts | Sigma | Mean | Median | Sigma |
| A | 4 | 2 | 30454 | 200.35 | 736 | 720 | 148.4 |
| A | 0 | 50 | 29856 | 196.32 | 736 | 720 | 148.4 |
| A | 8 | 192 | 28972 | 190.36 | 736 | 720 | 148.4 |
| B | 4 | 81 | 33245 | 229.56 | 754 | 737 | 141.6 |
| B | 0 | 219 | 24886 | 170.53 | 754 | 737 | 141.6 |
| B | 0 | 214 | 24567 | 168.28 | 754 | 737 | 141.6 |
| C | 14 | 206 | 38729 | 224.47 | 731 | 735 | 169.3 |
| C | 1 | 16 | 18246 | 103.45 | 731 | 735 | 169.3 |
| C | 13 | 61 | 5999 | 31.1 | 731 | 735 | 169.3 |
| D | 2 | 63 | 2099350 | 12588.99 | 680 | 658 | 166.7 |
| D | 1 | 239 | 107430 | 640.47 | 680 | 658 | 166.7 |
| D | 12 | 221 | 78420 | 466.45 | 680 | 658 | 166.7 |
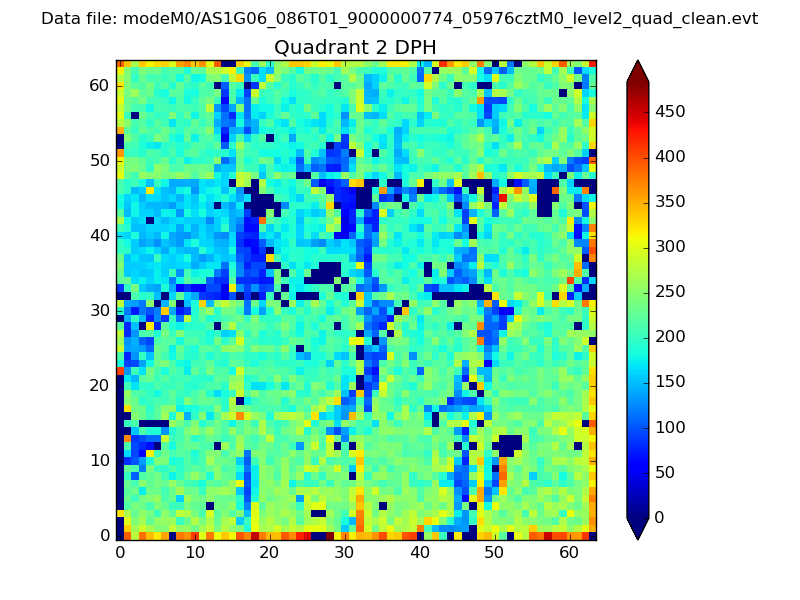
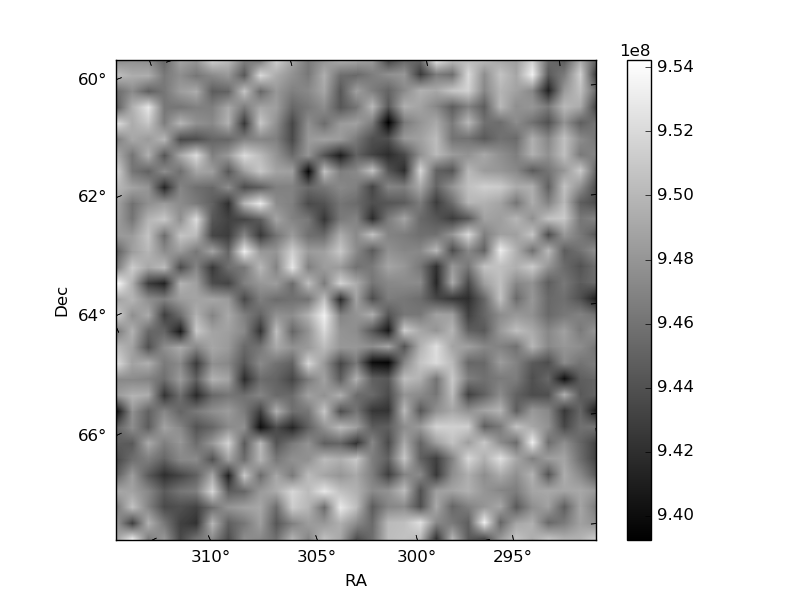
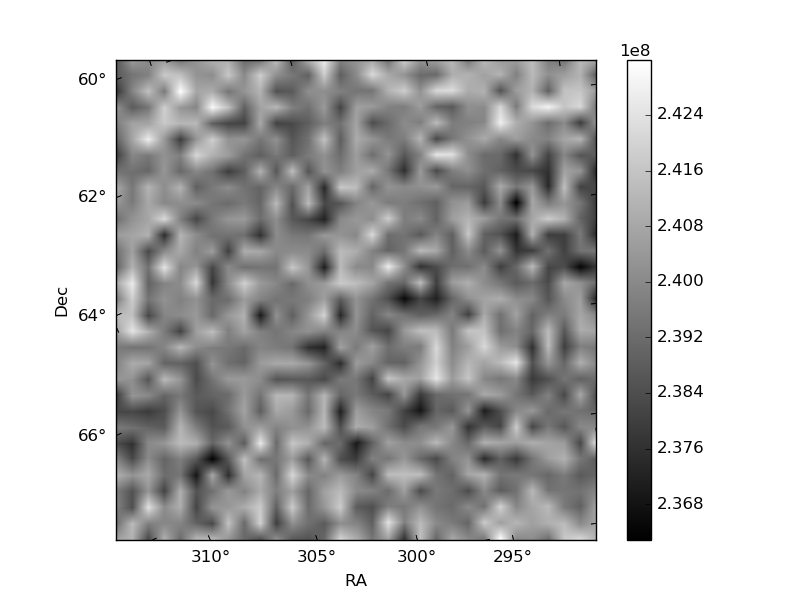
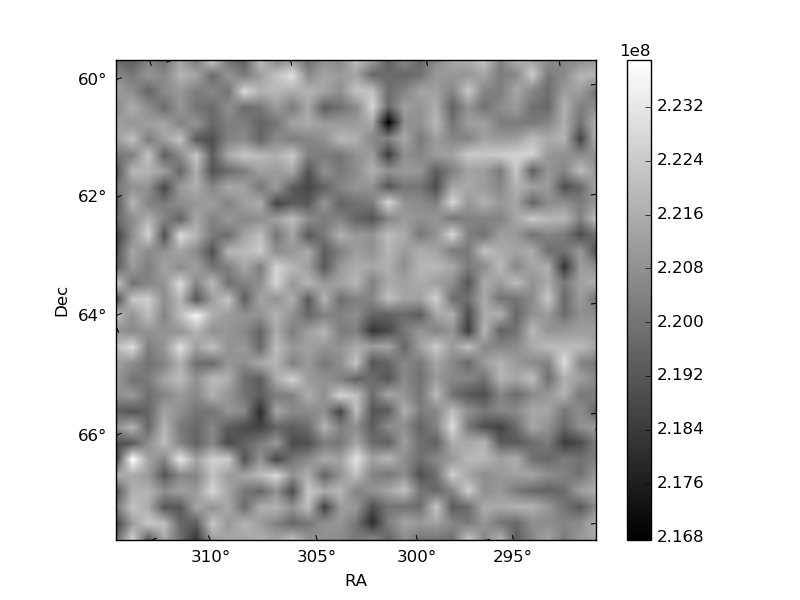
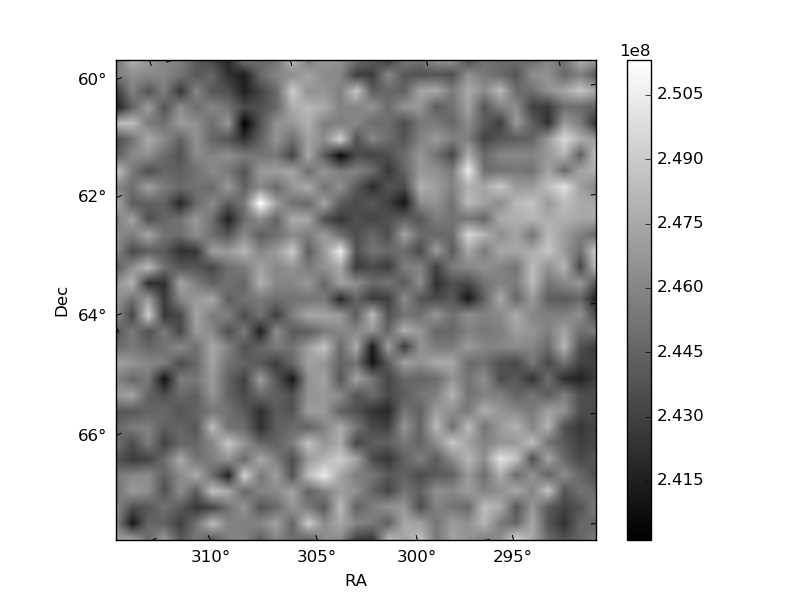
Histogram calculated using DETX and DETY for each event in the final _common_clean file
| Quadrant A | 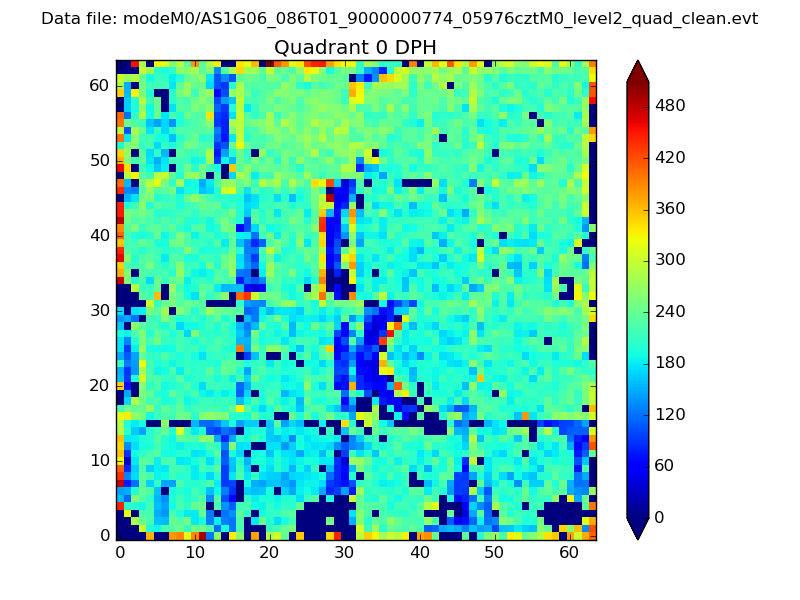 |
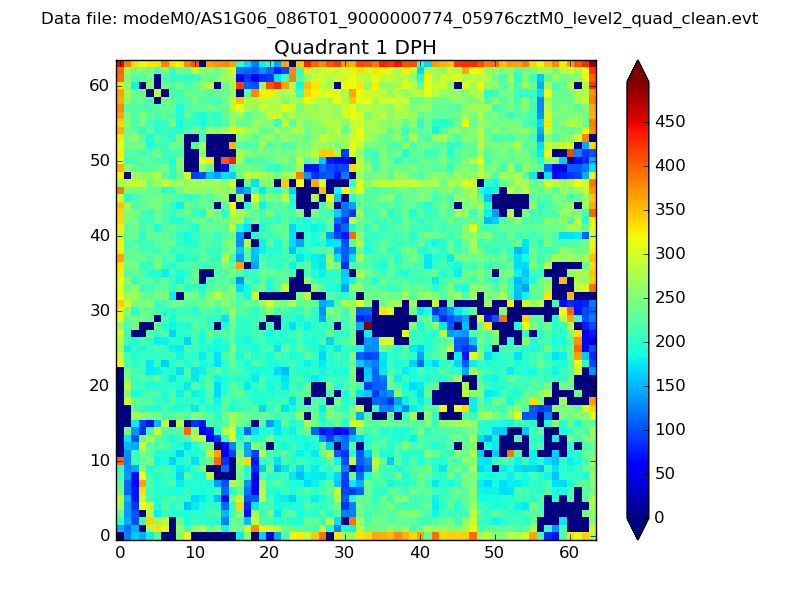 |
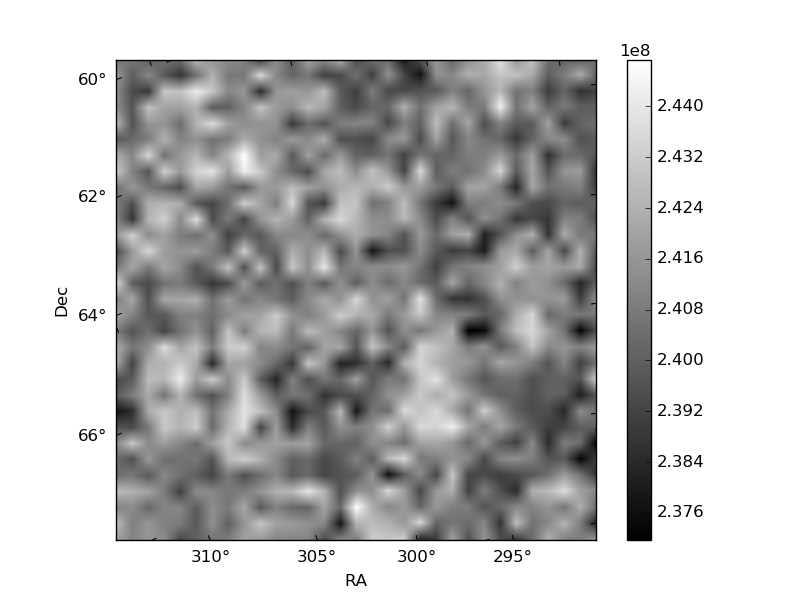
Quadrant B |
|---|---|---|---|
| Quadrant D | 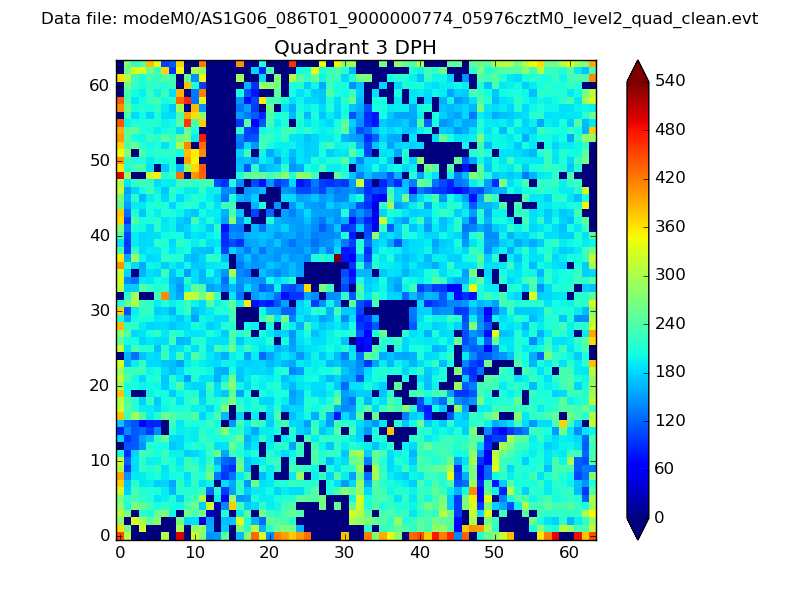 |
 |
Quadrant C |
| Plot type | Count rate plots | Images |
|---|---|---|
| Comparison with Poisson distribution Blue bars denote a histogram of data divided into 1 sec bins. Red curve is a Poisson curve with rate = median count rate of data. |
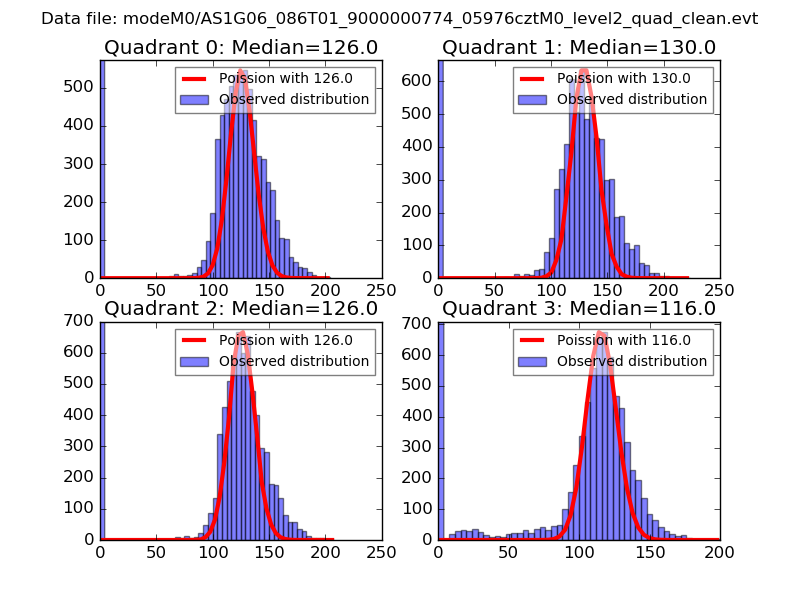 |
 |
| Quadrant-wise count rates Data is divided into 100 sec bins |
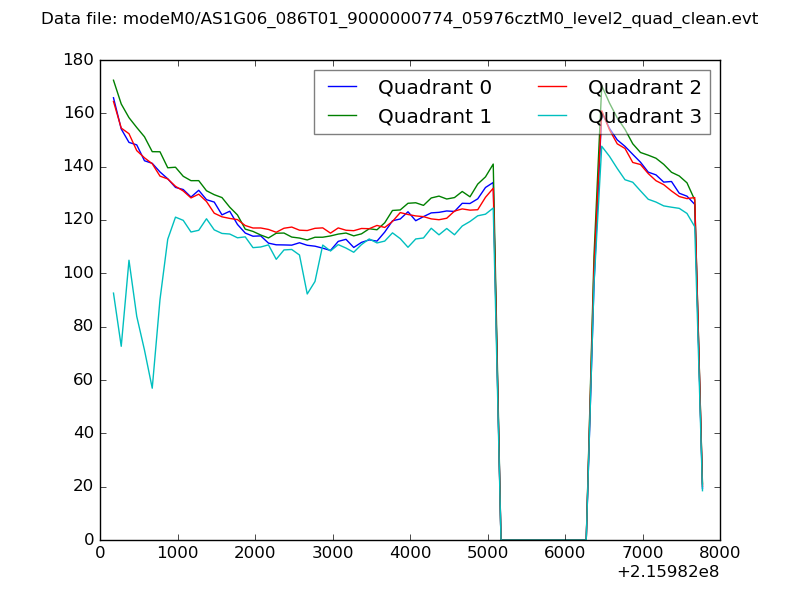 |
|
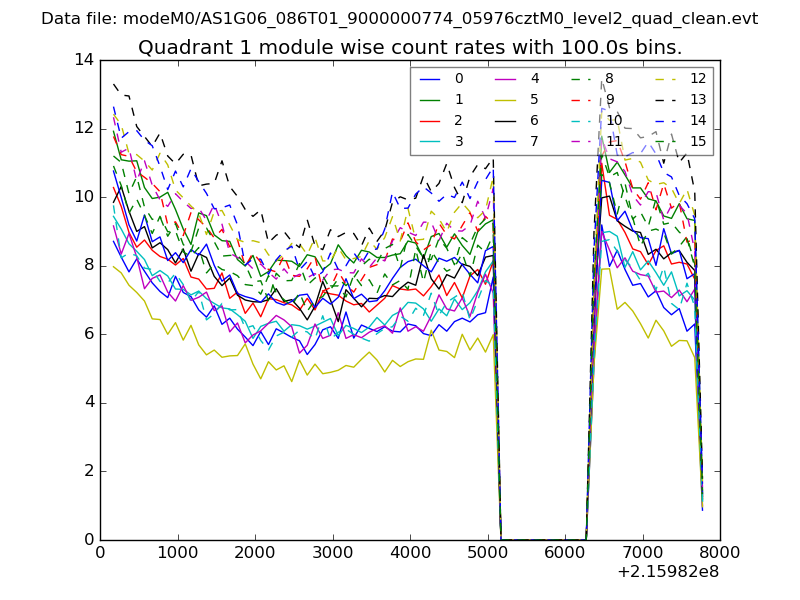
| Module-wise count rates for Quadrant A Data is divided into 100 sec bins |
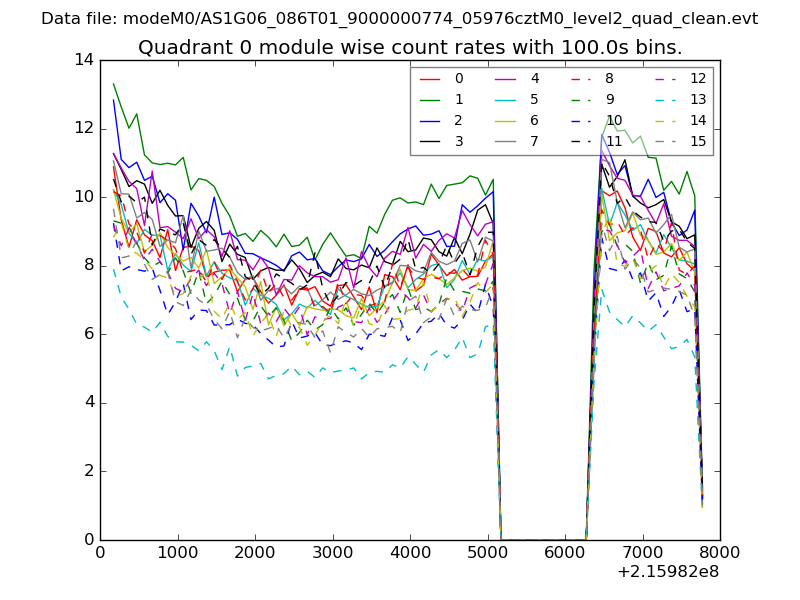 |
 |
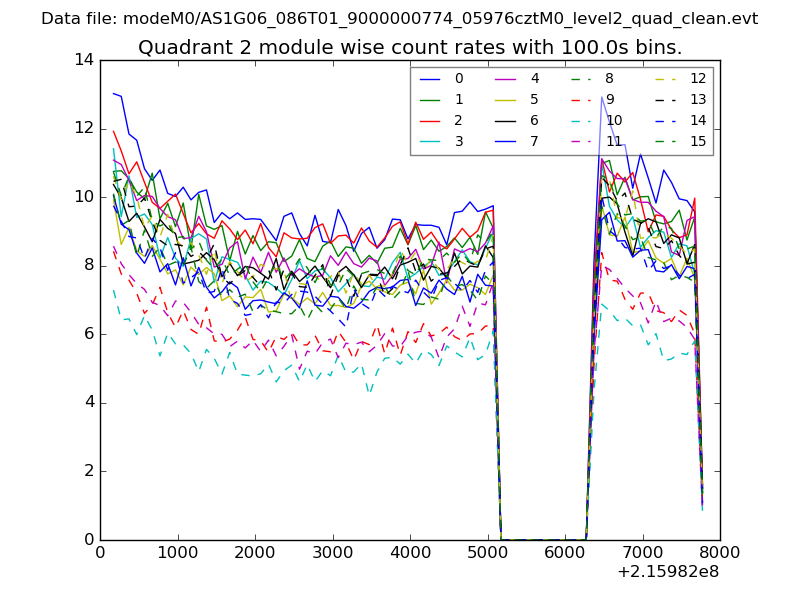
| Module-wise count rates for Quadrant B Data is divided into 100 sec bins |
 |
 |
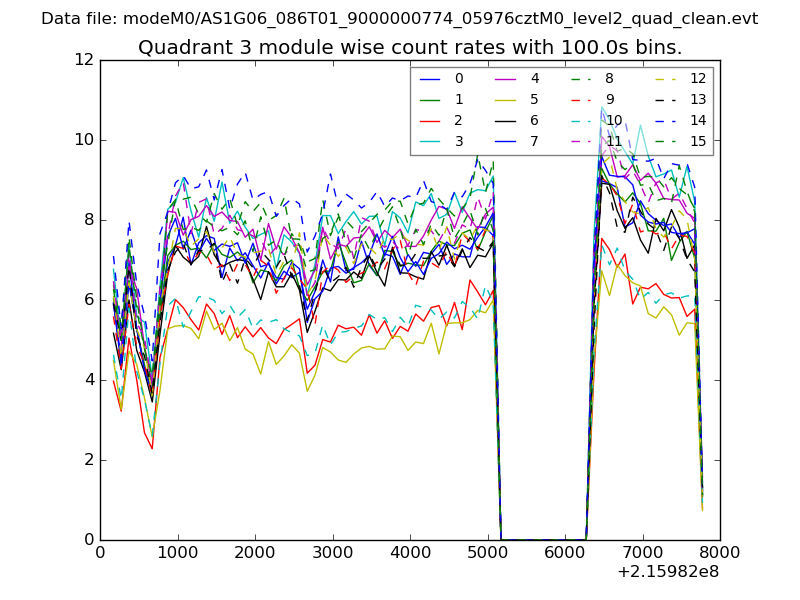
| Module-wise count rates for Quadrant C Data is divided into 100 sec bins |
 |
 |
| Module-wise count rates for Quadrant D Data is divided into 100 sec bins |
 |
 |
| Parameter | Plot |
|---|---|
| CZT HV Monitor | 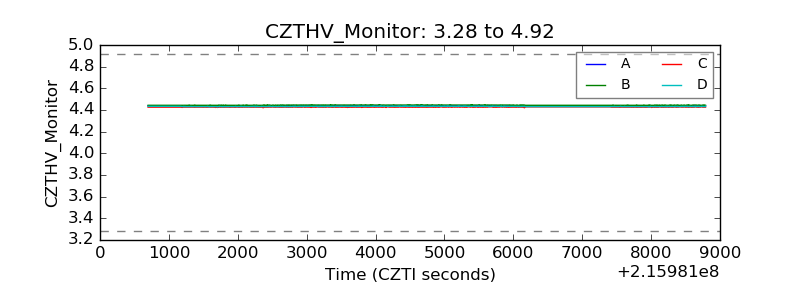 |
| D_VDD | 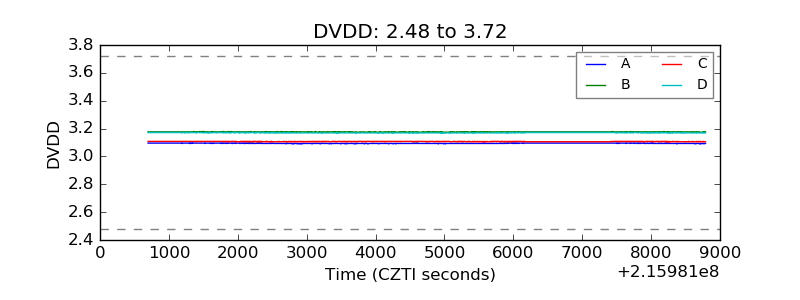 |
| Temperature 1 |  |
| Veto HV Monitor | 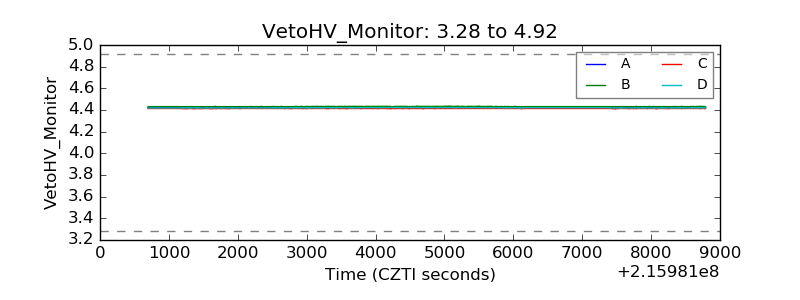 |
| Veto LLD | 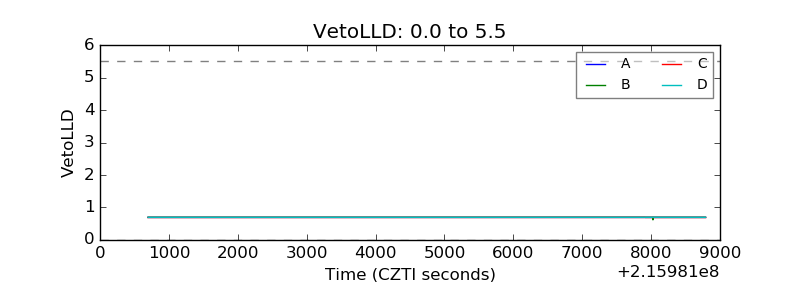 |
| Alpha Counter | 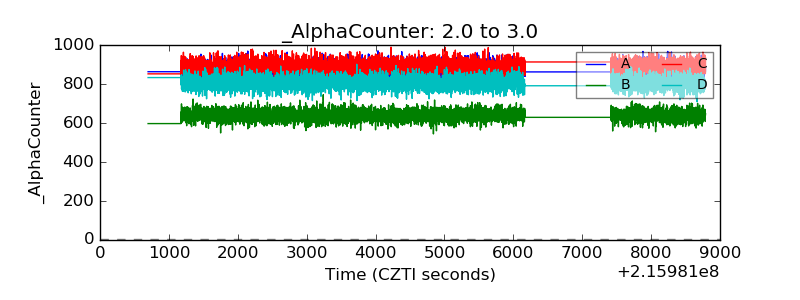 |
| _CPM_Rate | 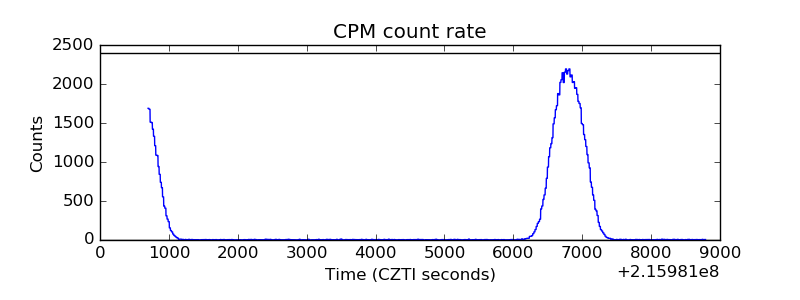 |
| CZT Counter | 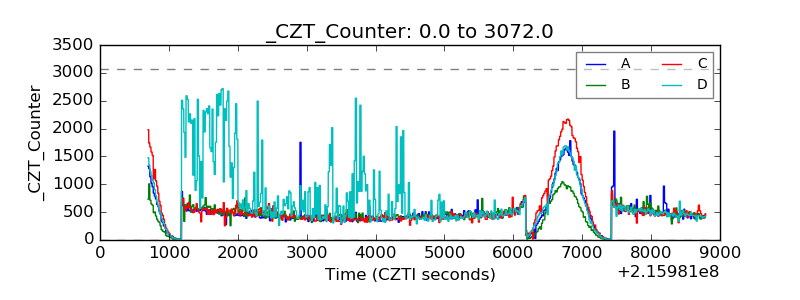 |
| +2.5 Volts monitor |  |
| +5 Volts monitor |  |
| _ROLL_ROT | 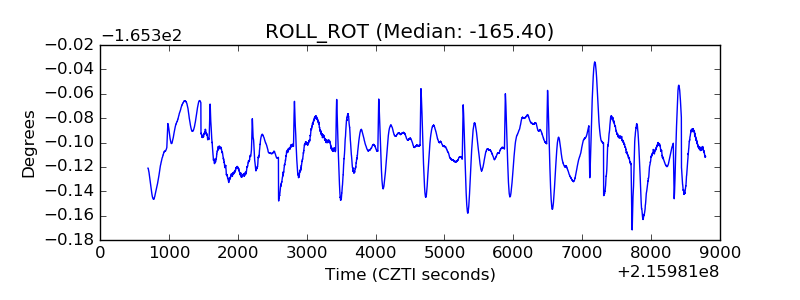 |
| _Roll_DEC |  |
| _Roll_RA | 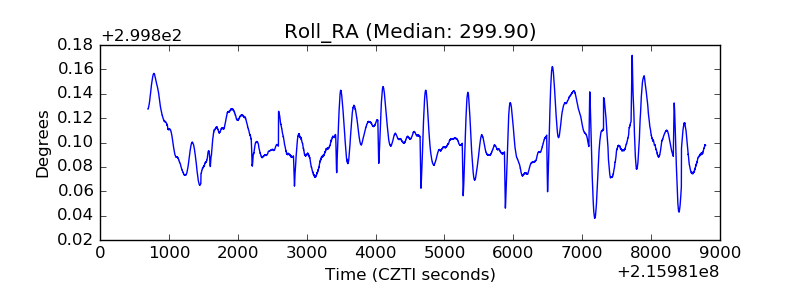 |
| Veto Counter | 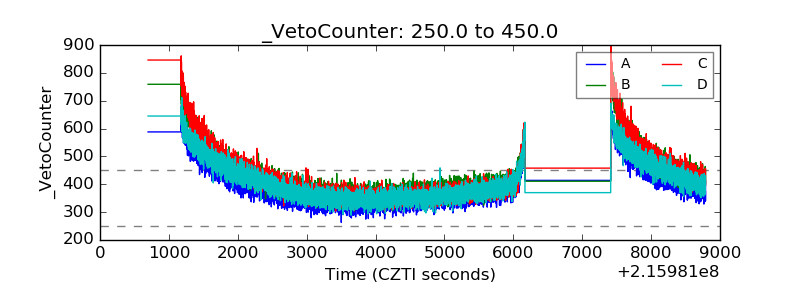 |