| Param | Original file | Final file |
|---|---|---|
| Filename | modeM0/AS1G06_086T01_9000000774_05978cztM0_level2.evt | modeM0/AS1G06_086T01_9000000774_05978cztM0_level2_quad_clean.evt |
| Size (bytes) | 431,447,040 | 126,164,160 |
| Size | 411.5 MB | 120.3 MB |
| Events in quadrant A | 3,032,845 | 840,109 |
| Events in quadrant B | 3,251,825 | 869,705 |
| Events in quadrant C | 3,075,445 | 847,819 |
| Events in quadrant D | 3,247,578 | 793,721 |
| Mode SS | |||
|---|---|---|---|
| Quadrant | BADHDUFLAG | Total packets | Discarded packets |
| A | 0 | 140 | 0 |
| B | 0 | 140 | 0 |
| C | 0 | 140 | 0 |
| D | 0 | 140 | 0 |
| Mode M9 | |||
|---|---|---|---|
| Quadrant | BADHDUFLAG | Total packets | Discarded packets |
| A | 0 | 25 | 0 |
| B | 0 | 25 | 0 |
| C | 0 | 25 | 0 |
| D | 0 | 25 | 0 |
| Mode M0 | |||
|---|---|---|---|
| Quadrant | BADHDUFLAG | Total packets | Discarded packets |
| A | 0 | 13944 | 3 |
| B | 0 | 14344 | 2 |
| C | 0 | 14039 | 2 |
| D | 0 | 14710 | 5 |
| Quadrant | Total seconds | Saturated seconds | Saturation percentage |
|---|---|---|---|
| A | 6740 | 31 | 0.459941% |
| B | 6740 | 66 | 0.979228% |
| C | 6740 | 39 | 0.578635% |
| D | 6739 | 76 | 1.127764% |
Noise dominated data is calculated using 1-second bins in cleaned event files. If a bin has >2000 counts, and if more than 50% of those come from <1% of pixels, then it is considered to be noise-dominated and hence unusable.
| Quadrant | # 1 sec bins | Bins with >0 counts | Bins with >2000 counts | High rate bins dominated by noise | Noise dominated (total time) | Noise dominated (detector-on time) | Marked lightcurve |
|---|---|---|---|---|---|---|---|
| A | 9296 | 6743 | 4 | 4 | 0.04% | 0.06% | 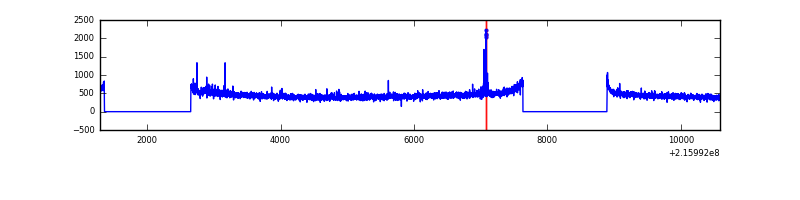 |
| B | 9296 | 6743 | 6 | 6 | 0.06% | 0.09% | 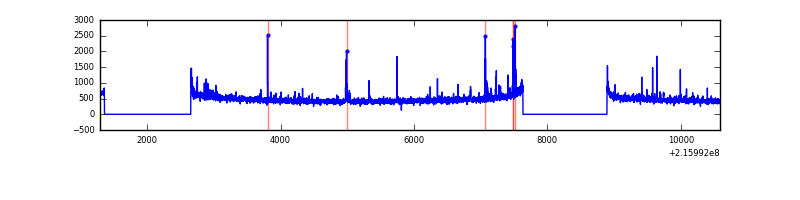 |
| C | 9296 | 6743 | 10 | 10 | 0.11% | 0.15% | 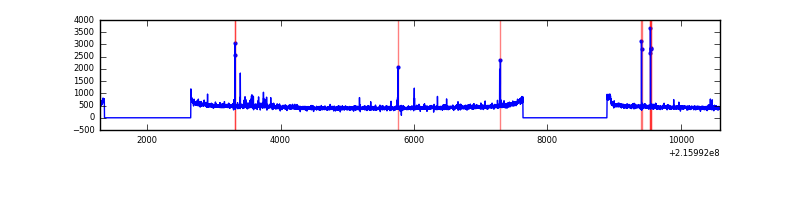 |
| D | 9295 | 6742 | 39 | 39 | 0.42% | 0.58% | 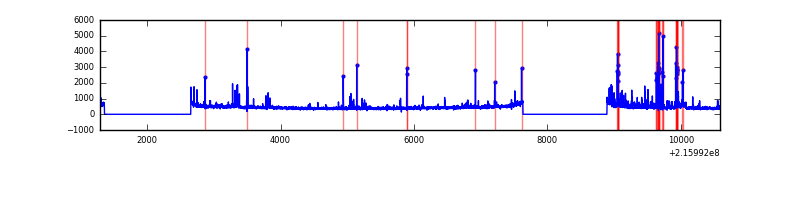 |
Top three noisy pixels from each quadrant. If the there are fewer than three noisy pixels in the level2.evt file, extra rows are filled as -1
| Pixel properties | Quadrant properties | ||||||
|---|---|---|---|---|---|---|---|
| Quadrant | DetID | PixID | Counts | Sigma | Mean | Median | Sigma |
| A | 4 | 2 | 31002 | 192.83 | 770 | 754 | 156.9 |
| A | 15 | 234 | 16843 | 102.56 | 770 | 754 | 156.9 |
| A | 8 | 192 | 11856 | 70.77 | 770 | 754 | 156.9 |
| B | 4 | 81 | 79333 | 530.76 | 789 | 770 | 148.0 |
| B | 4 | 48 | 28389 | 186.59 | 789 | 770 | 148.0 |
| B | 0 | 214 | 26043 | 170.74 | 789 | 770 | 148.0 |
| C | 1 | 16 | 60982 | 344.91 | 759 | 761 | 174.6 |
| C | 9 | 54 | 22997 | 127.35 | 759 | 761 | 174.6 |
| C | 1 | 241 | 18304 | 100.48 | 759 | 761 | 174.6 |
| D | 6 | 112 | 124280 | 675.35 | 744 | 719 | 183.0 |
| D | 2 | 63 | 113783 | 617.97 | 744 | 719 | 183.0 |
| D | 8 | 195 | 61008 | 329.52 | 744 | 719 | 183.0 |
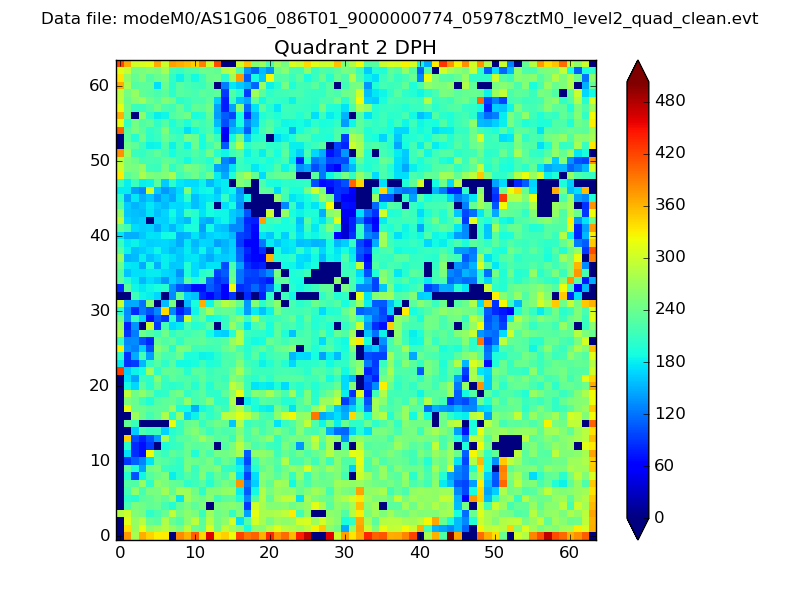
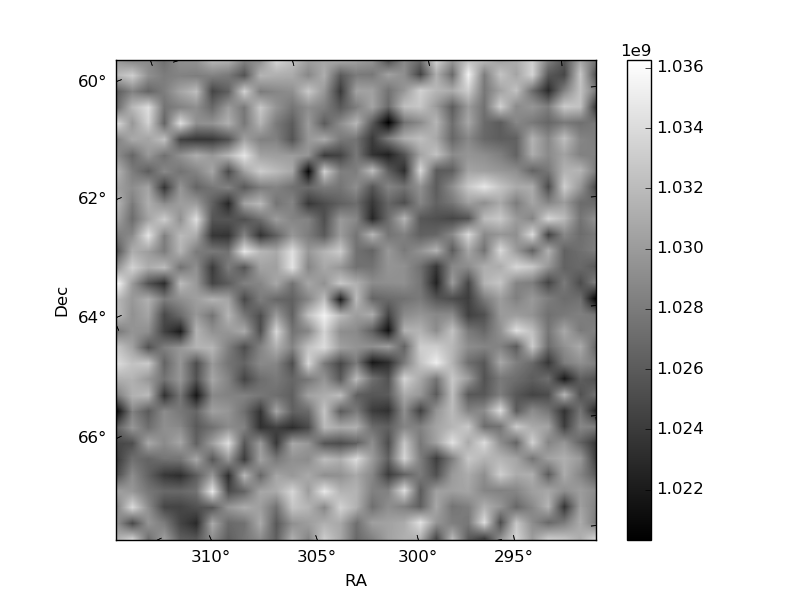
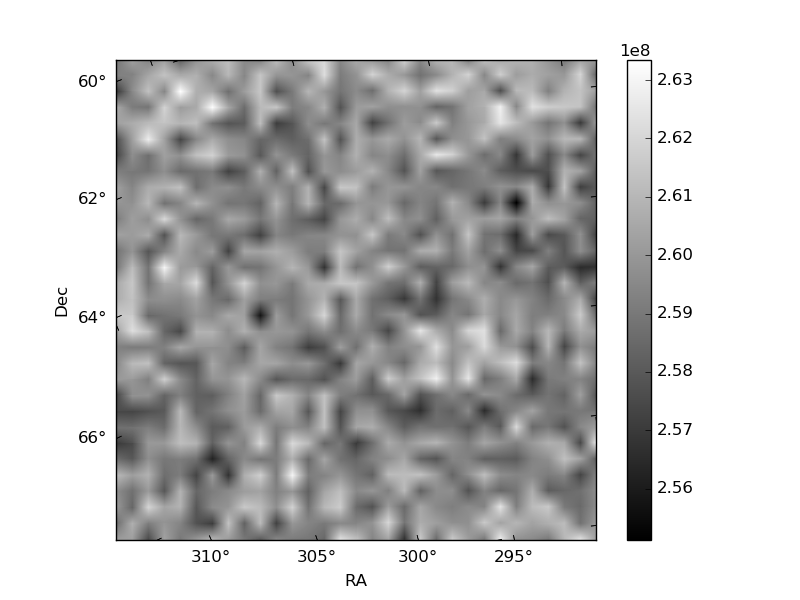
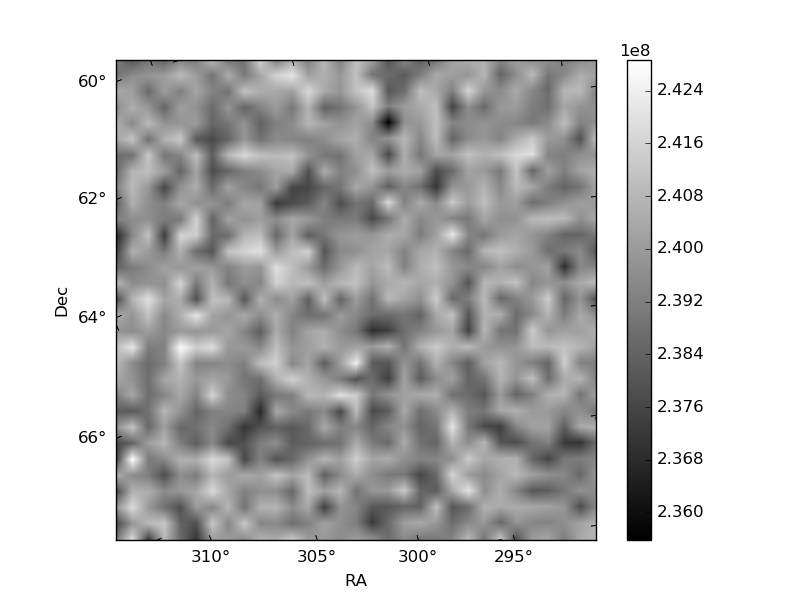
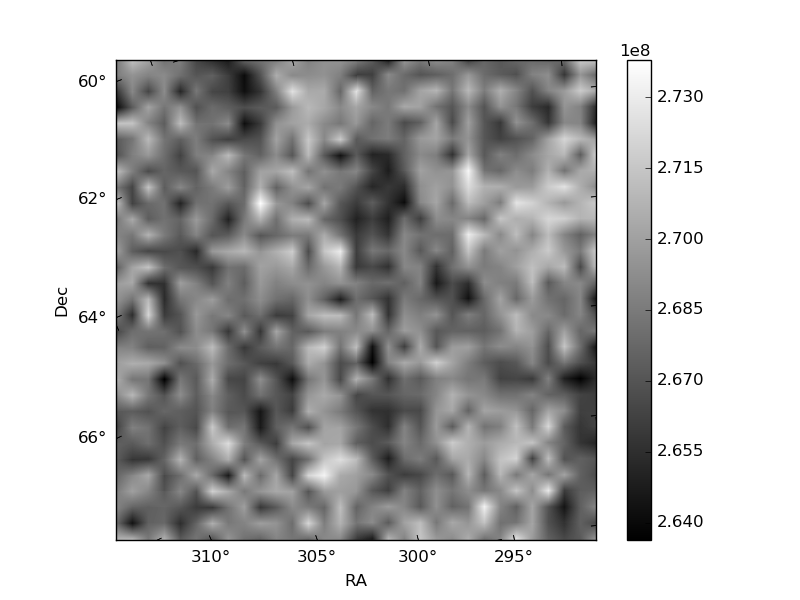
Histogram calculated using DETX and DETY for each event in the final _common_clean file
| Quadrant A | 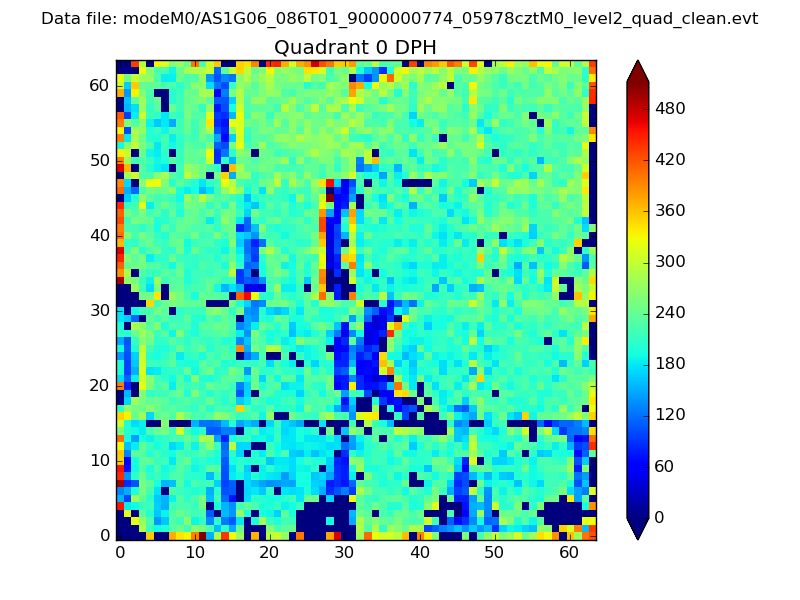 |
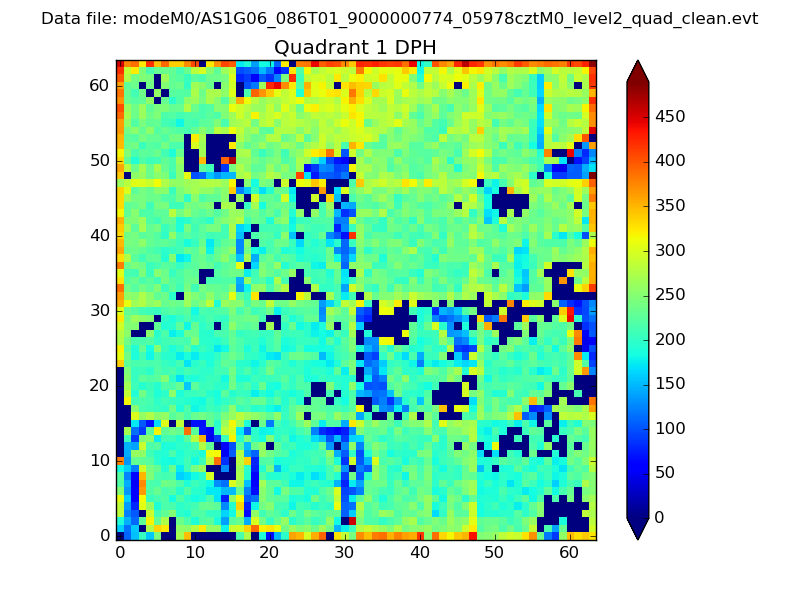 |
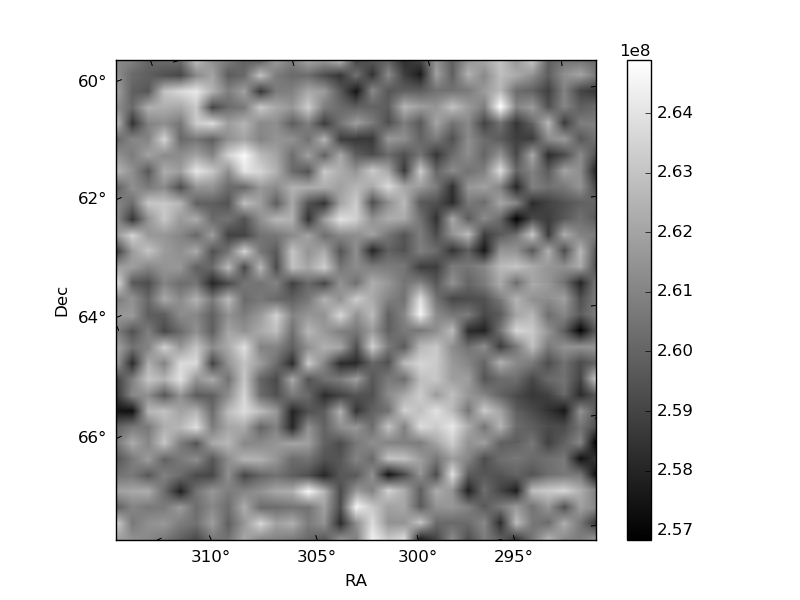
Quadrant B |
|---|---|---|---|
| Quadrant D | 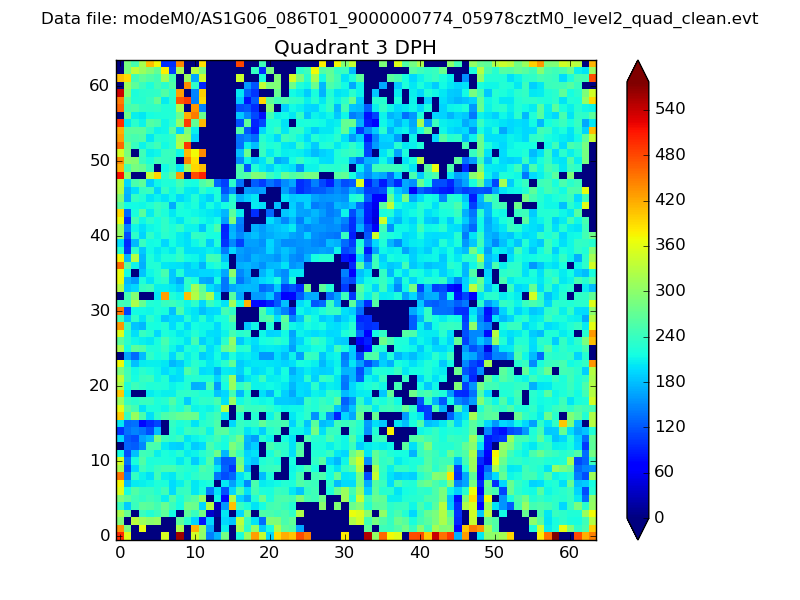 |
 |
Quadrant C |
| Plot type | Count rate plots | Images |
|---|---|---|
| Comparison with Poisson distribution Blue bars denote a histogram of data divided into 1 sec bins. Red curve is a Poisson curve with rate = median count rate of data. |
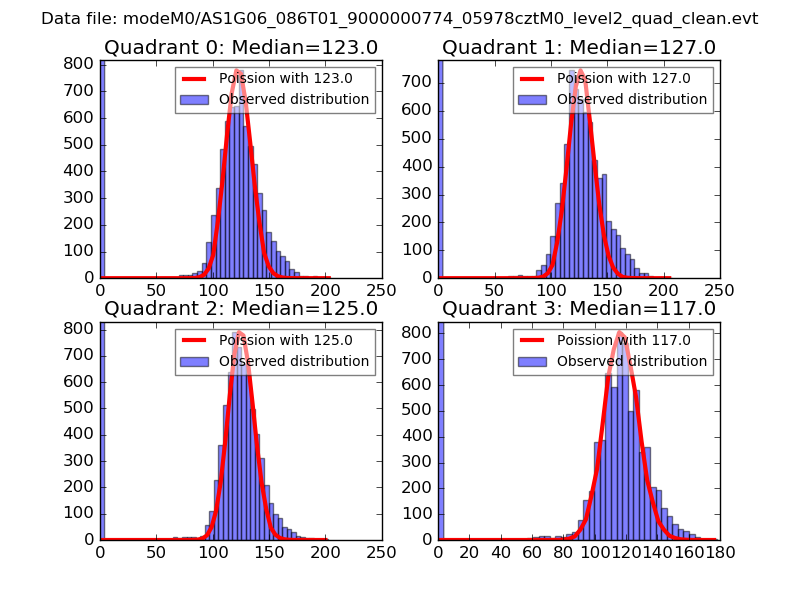 |
 |
| Quadrant-wise count rates Data is divided into 100 sec bins |
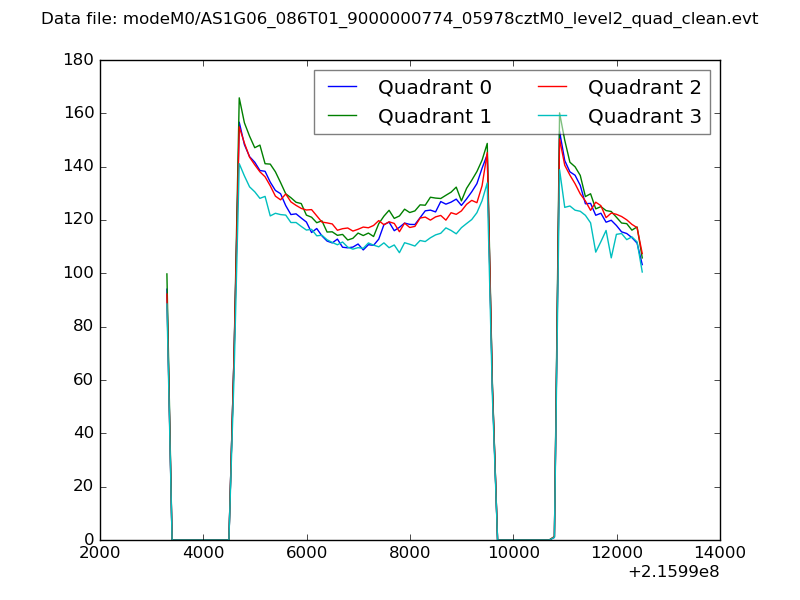 |
|
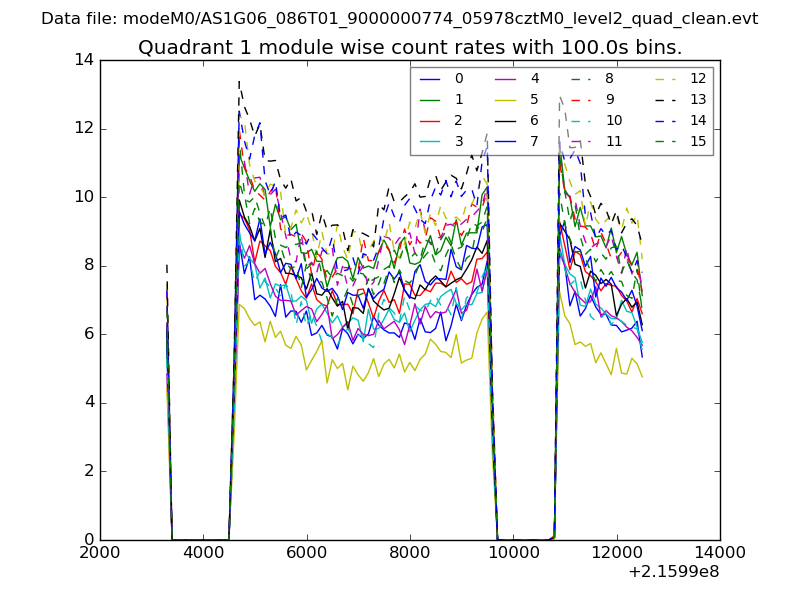
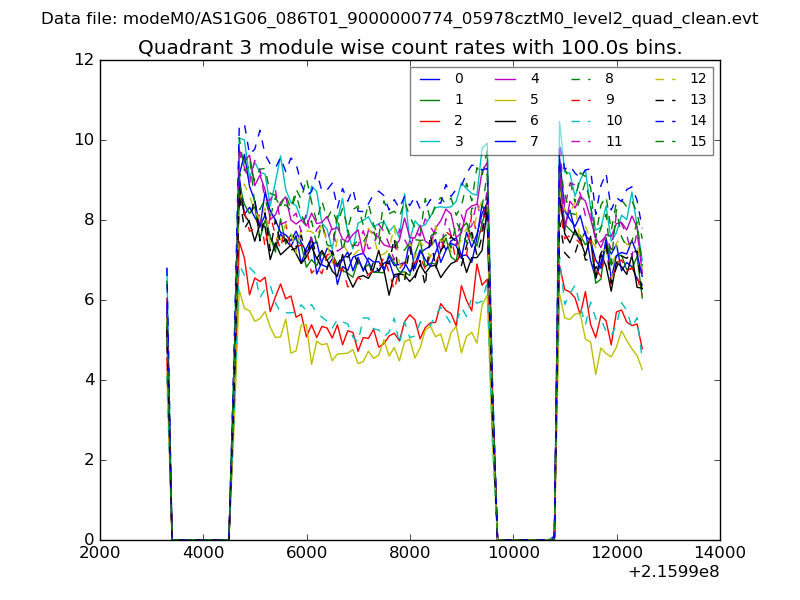
| Module-wise count rates for Quadrant A Data is divided into 100 sec bins |
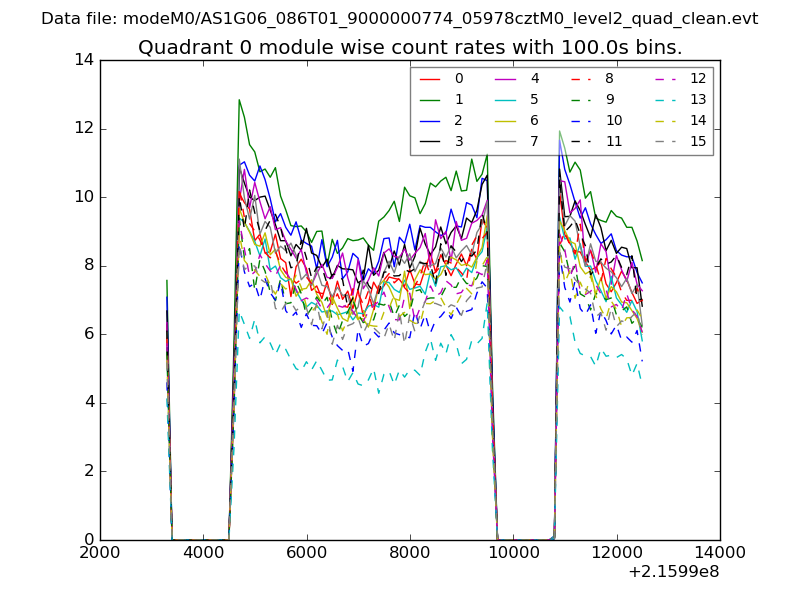 |
 |
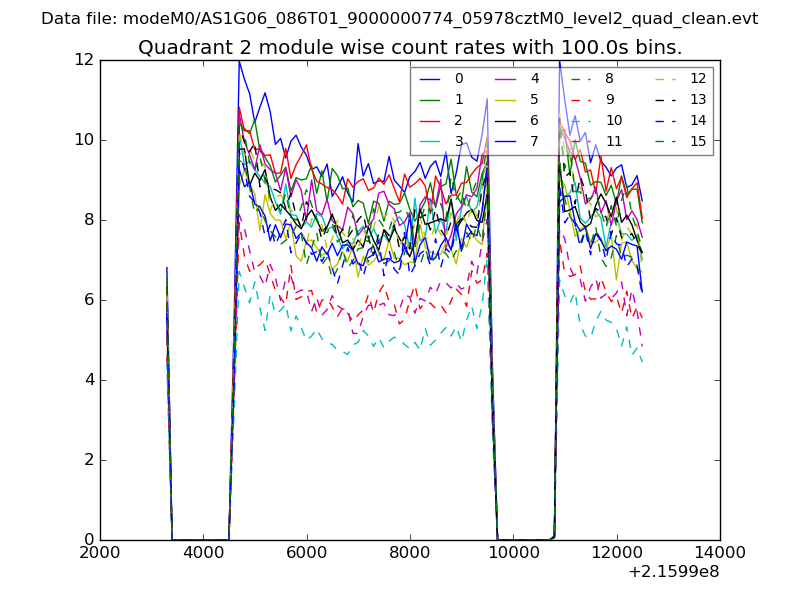
| Module-wise count rates for Quadrant B Data is divided into 100 sec bins |
 |
 |
| Module-wise count rates for Quadrant C Data is divided into 100 sec bins |
 |
 |
| Module-wise count rates for Quadrant D Data is divided into 100 sec bins |
 |
 |
| Parameter | Plot |
|---|---|
| CZT HV Monitor | 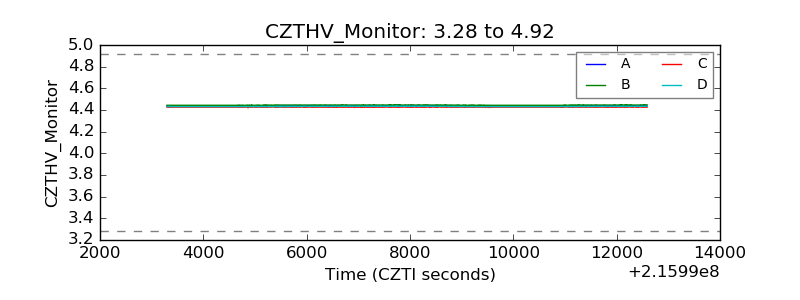 |
| D_VDD | 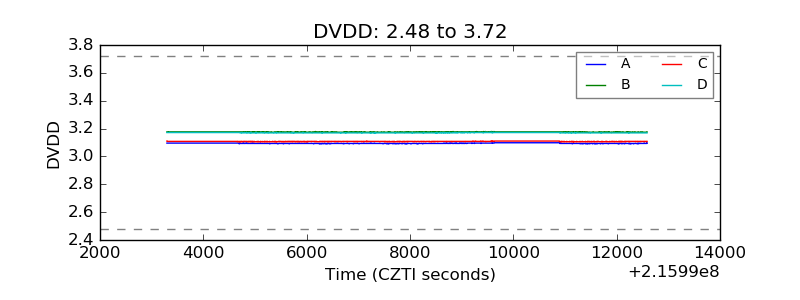 |
| Temperature 1 | 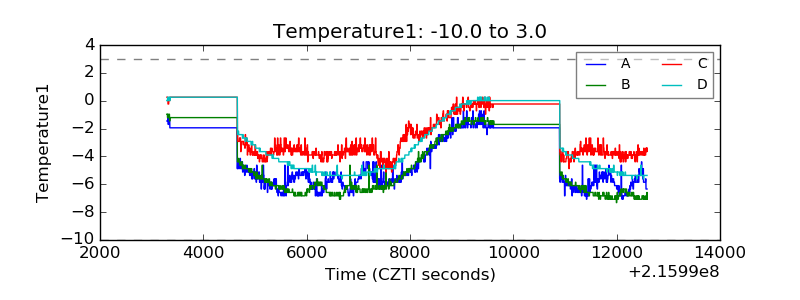 |
| Veto HV Monitor | 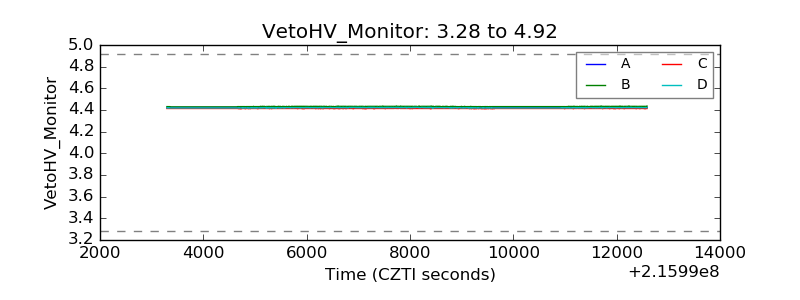 |
| Veto LLD | 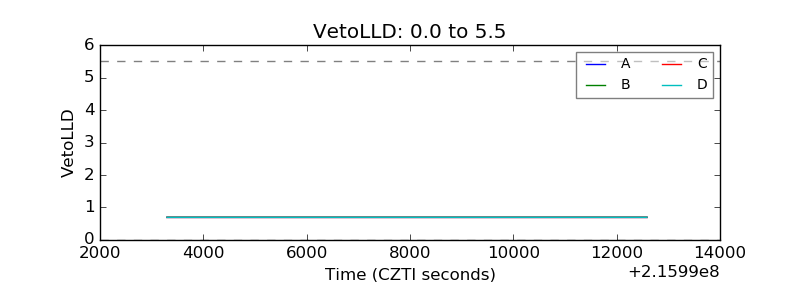 |
| Alpha Counter | 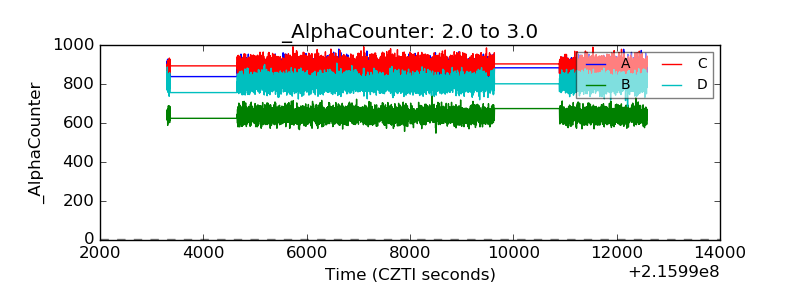 |
| _CPM_Rate | 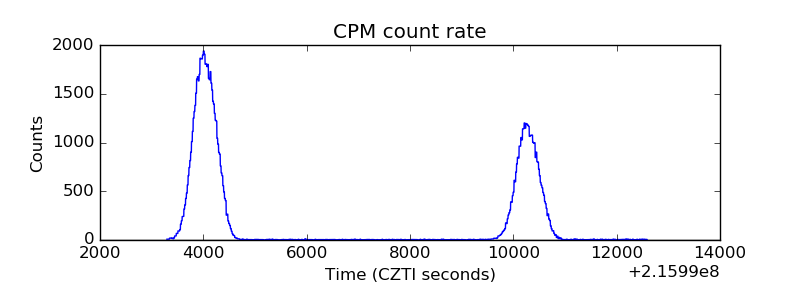 |
| CZT Counter | 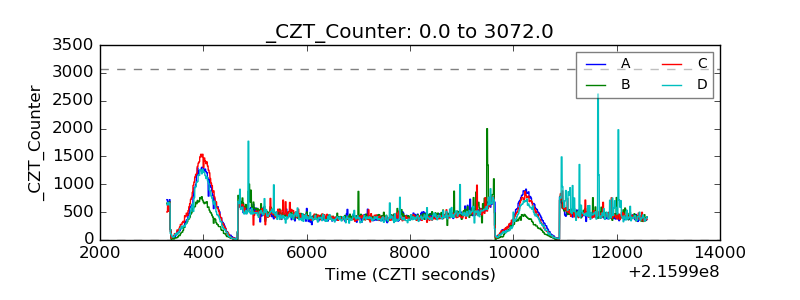 |
| +2.5 Volts monitor | 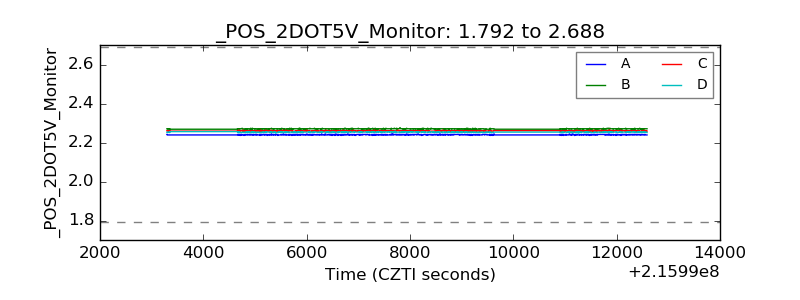 |
| +5 Volts monitor |  |
| _ROLL_ROT | 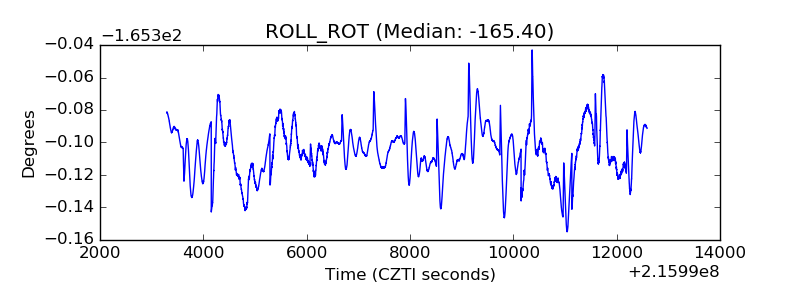 |
| _Roll_DEC | 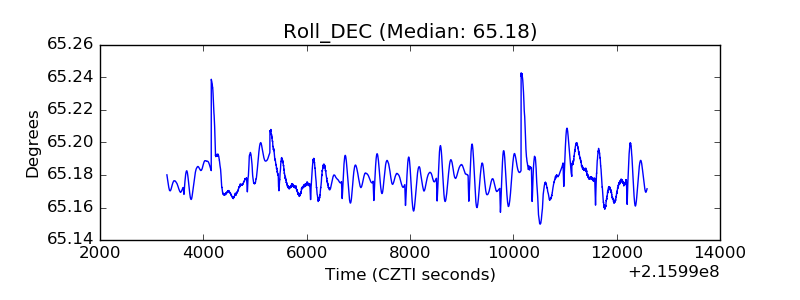 |
| _Roll_RA | 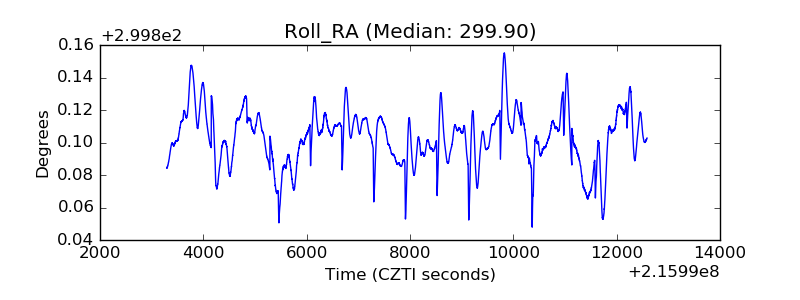 |
| Veto Counter | 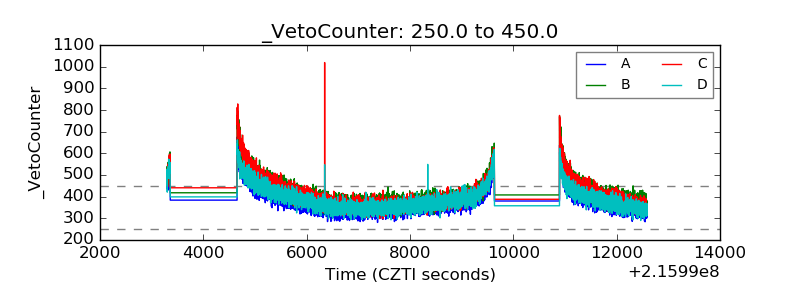 |