| Param | Original file | Final file |
|---|---|---|
| Filename | modeM0/AS1G06_086T01_9000000774_05979cztM0_level2.evt | modeM0/AS1G06_086T01_9000000774_05979cztM0_level2_quad_clean.evt |
| Size (bytes) | 393,480,000 | 115,064,640 |
| Size | 375.3 MB | 109.7 MB |
| Events in quadrant A | 2,759,012 | 764,497 |
| Events in quadrant B | 2,990,938 | 784,460 |
| Events in quadrant C | 2,743,764 | 767,434 |
| Events in quadrant D | 2,987,858 | 723,044 |
| Mode SS | |||
|---|---|---|---|
| Quadrant | BADHDUFLAG | Total packets | Discarded packets |
| A | 0 | 128 | 0 |
| B | 0 | 128 | 0 |
| C | 0 | 128 | 0 |
| D | 0 | 128 | 0 |
| Mode M9 | |||
|---|---|---|---|
| Quadrant | BADHDUFLAG | Total packets | Discarded packets |
| A | 0 | 12 | 0 |
| B | 0 | 12 | 0 |
| C | 0 | 12 | 0 |
| D | 0 | 12 | 0 |
| Mode M0 | |||
|---|---|---|---|
| Quadrant | BADHDUFLAG | Total packets | Discarded packets |
| A | 0 | 13000 | 2 |
| B | 0 | 13373 | 1 |
| C | 0 | 13022 | 1 |
| D | 0 | 13781 | 1 |
| Quadrant | Total seconds | Saturated seconds | Saturation percentage |
|---|---|---|---|
| A | 6394 | 18 | 0.281514% |
| B | 6394 | 30 | 0.469190% |
| C | 6394 | 17 | 0.265874% |
| D | 6394 | 79 | 1.235533% |
Noise dominated data is calculated using 1-second bins in cleaned event files. If a bin has >2000 counts, and if more than 50% of those come from <1% of pixels, then it is considered to be noise-dominated and hence unusable.
| Quadrant | # 1 sec bins | Bins with >0 counts | Bins with >2000 counts | High rate bins dominated by noise | Noise dominated (total time) | Noise dominated (detector-on time) | Marked lightcurve |
|---|---|---|---|---|---|---|---|
| A | 7569 | 6395 | 0 | 0 | 0.00% | 0.00% | 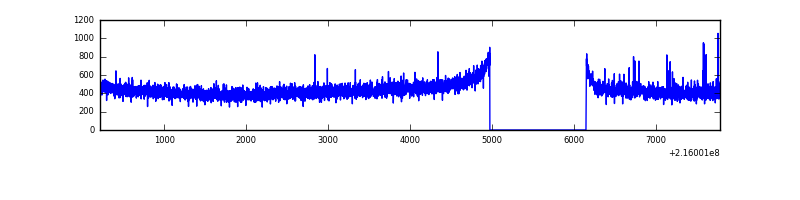 |
| B | 7569 | 6395 | 2 | 2 | 0.03% | 0.03% | 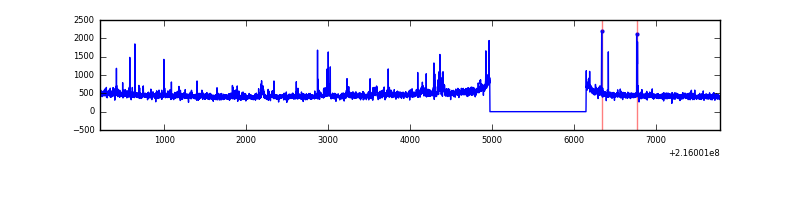 |
| C | 7569 | 6395 | 6 | 6 | 0.08% | 0.09% | 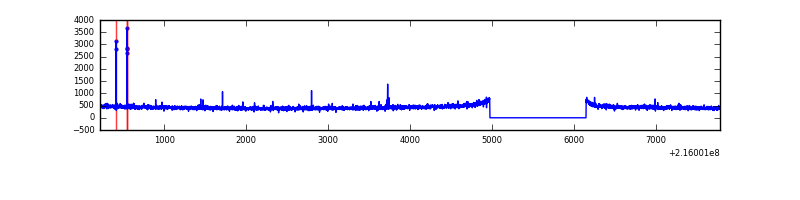 |
| D | 7569 | 6395 | 49 | 49 | 0.65% | 0.77% | 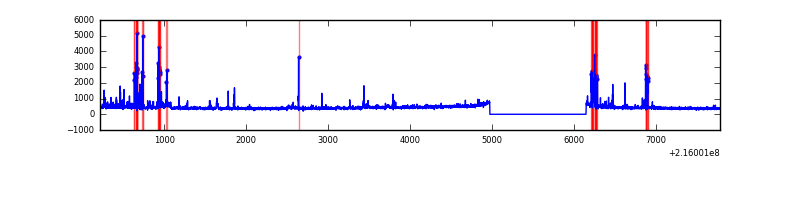 |
Top three noisy pixels from each quadrant. If the there are fewer than three noisy pixels in the level2.evt file, extra rows are filled as -1
| Pixel properties | Quadrant properties | ||||||
|---|---|---|---|---|---|---|---|
| Quadrant | DetID | PixID | Counts | Sigma | Mean | Median | Sigma |
| A | 8 | 192 | 13069 | 85.53 | 709 | 692 | 144.7 |
| A | 4 | 2 | 9043 | 57.71 | 709 | 692 | 144.7 |
| A | 0 | 226 | 6687 | 41.43 | 709 | 692 | 144.7 |
| B | 4 | 81 | 87511 | 634.86 | 722 | 704 | 136.7 |
| B | 4 | 48 | 26057 | 185.42 | 722 | 704 | 136.7 |
| B | 15 | 204 | 25097 | 178.4 | 722 | 704 | 136.7 |
| C | 1 | 241 | 18113 | 109.47 | 692 | 695 | 159.1 |
| C | 1 | 16 | 11323 | 66.8 | 692 | 695 | 159.1 |
| C | 9 | 54 | 7474 | 42.61 | 692 | 695 | 159.1 |
| D | 2 | 63 | 207369 | 1236.55 | 678 | 654 | 167.2 |
| D | 6 | 112 | 104570 | 621.61 | 678 | 654 | 167.2 |
| D | 8 | 195 | 61619 | 364.69 | 678 | 654 | 167.2 |
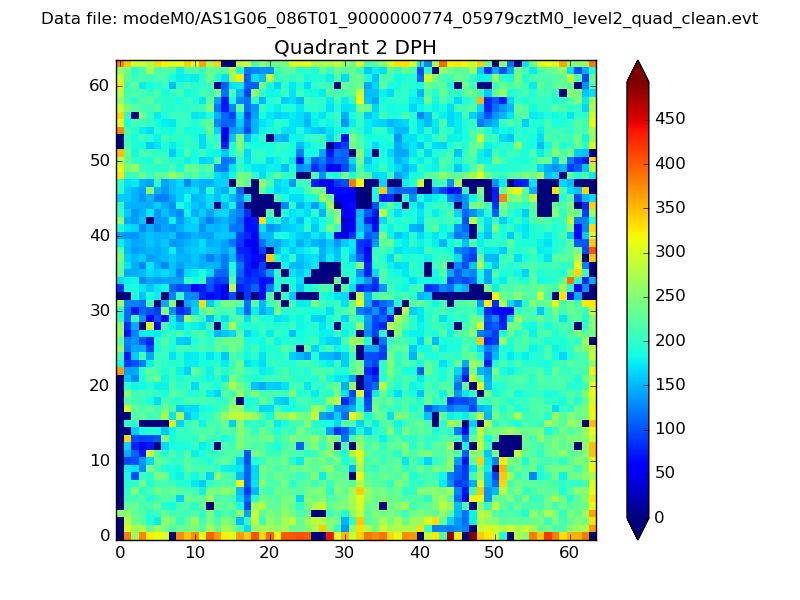
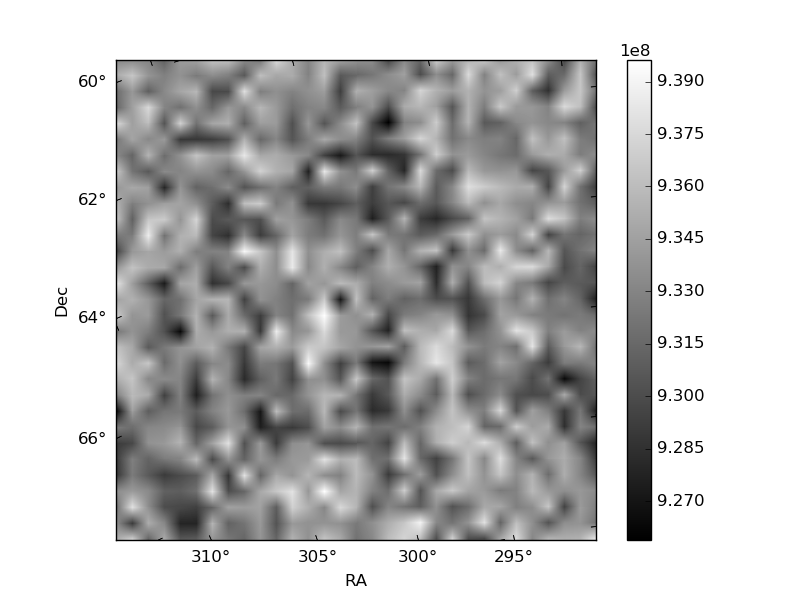
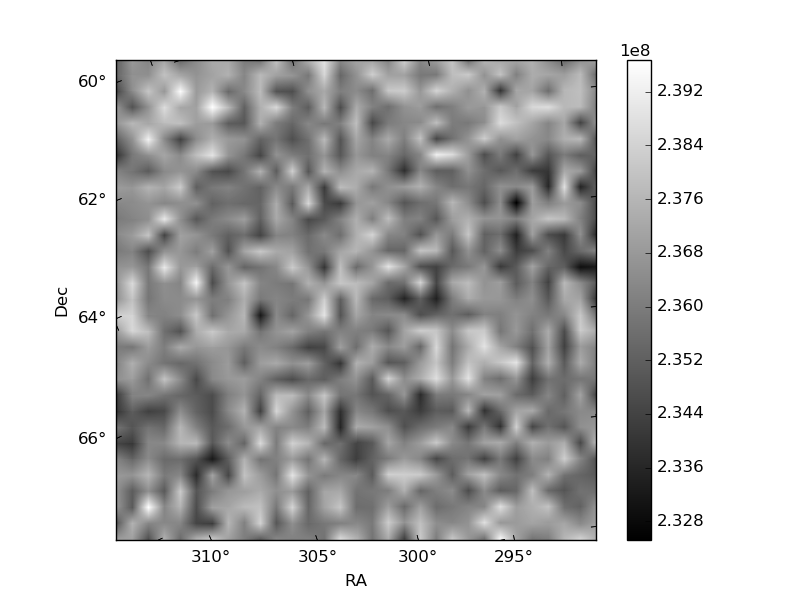
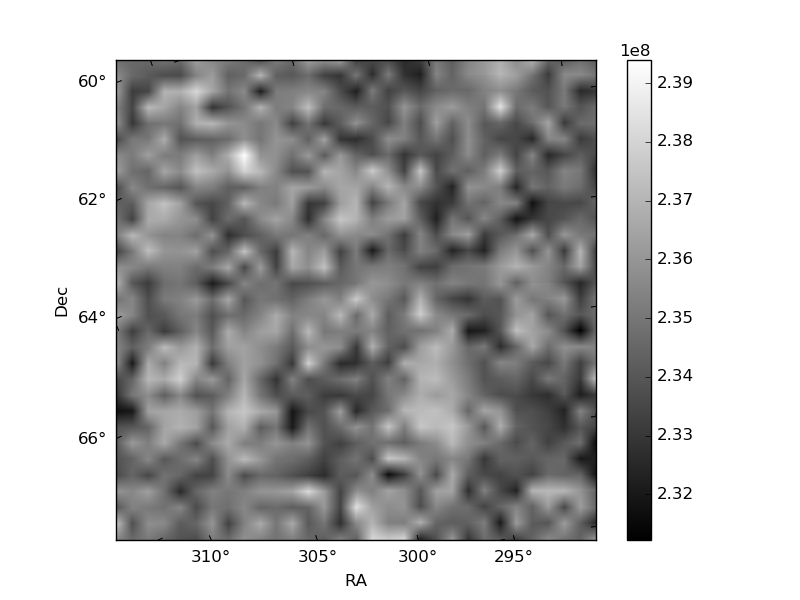
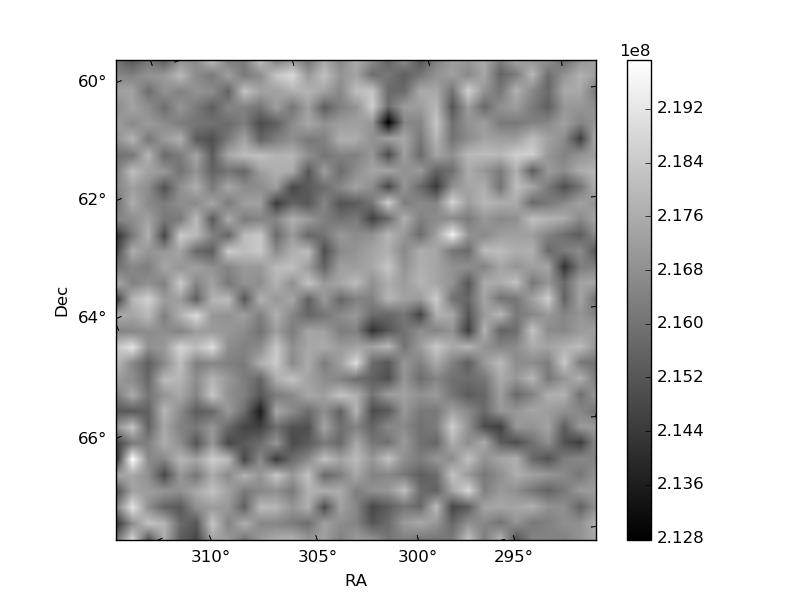
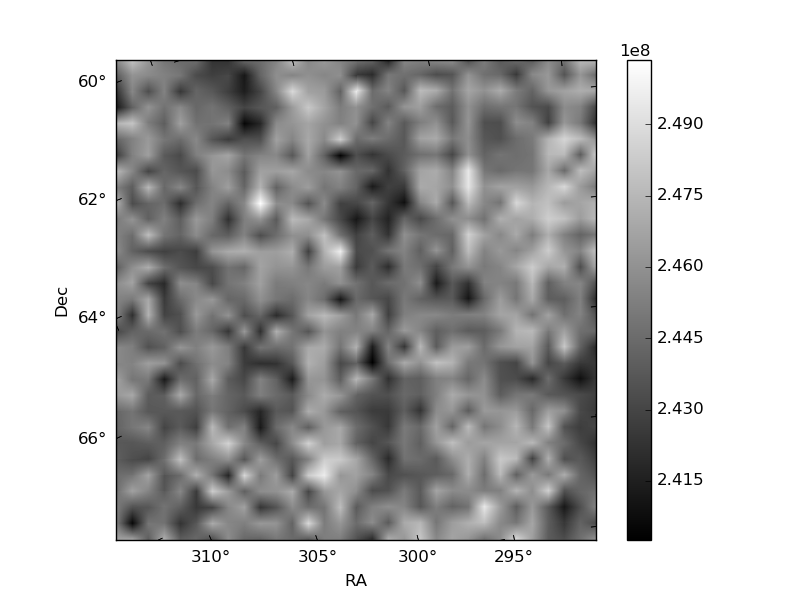
Histogram calculated using DETX and DETY for each event in the final _common_clean file
| Quadrant A | 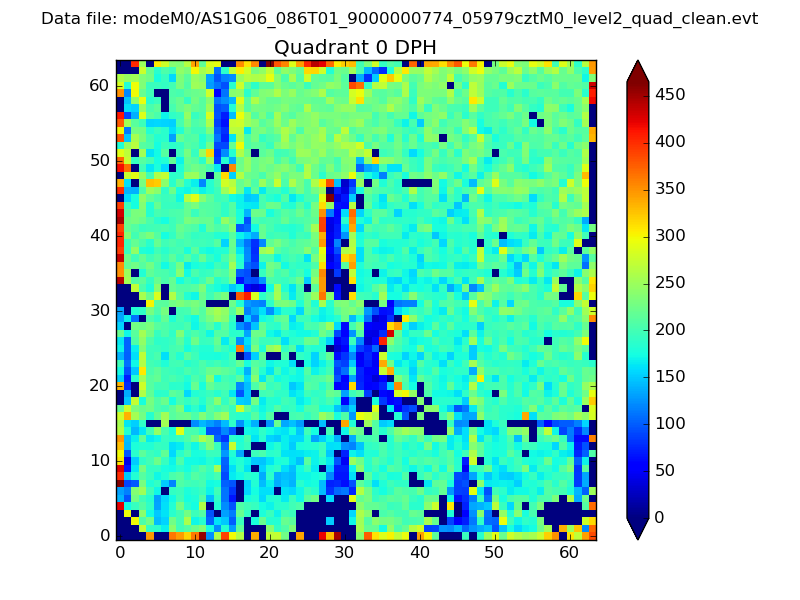 |
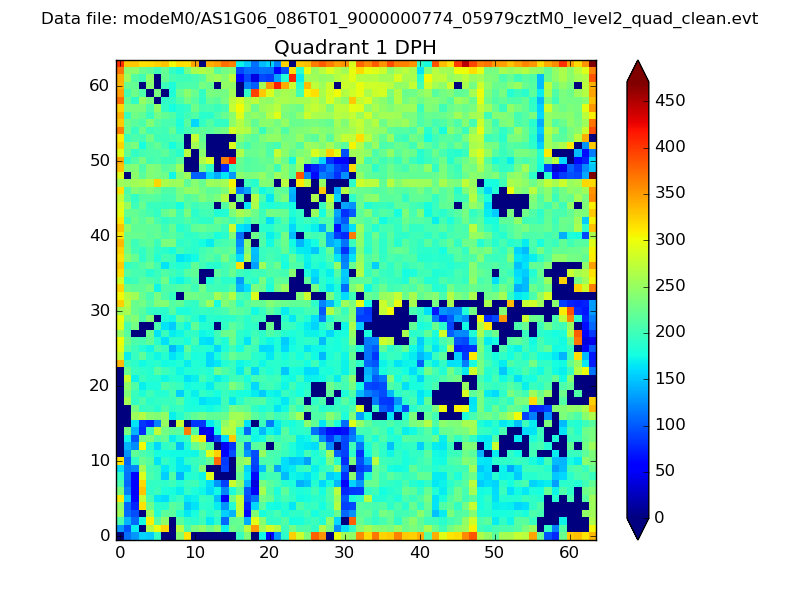 |
Quadrant B |
|---|---|---|---|
| Quadrant D | 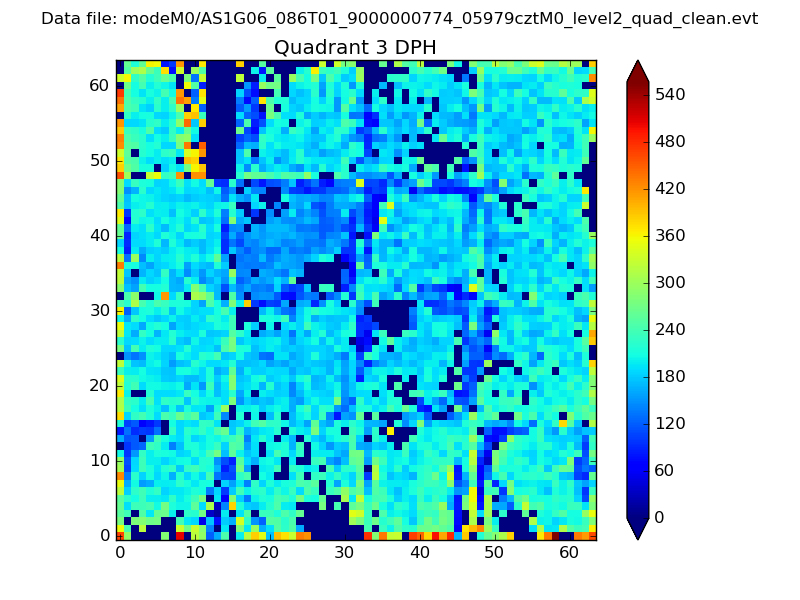 |
 |
Quadrant C |
| Plot type | Count rate plots | Images |
|---|---|---|
| Comparison with Poisson distribution Blue bars denote a histogram of data divided into 1 sec bins. Red curve is a Poisson curve with rate = median count rate of data. |
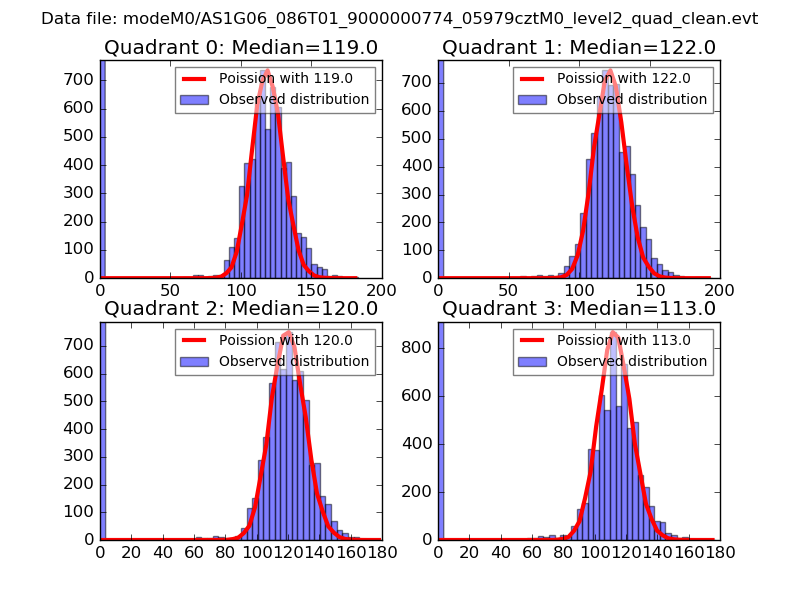 |
 |
| Quadrant-wise count rates Data is divided into 100 sec bins |
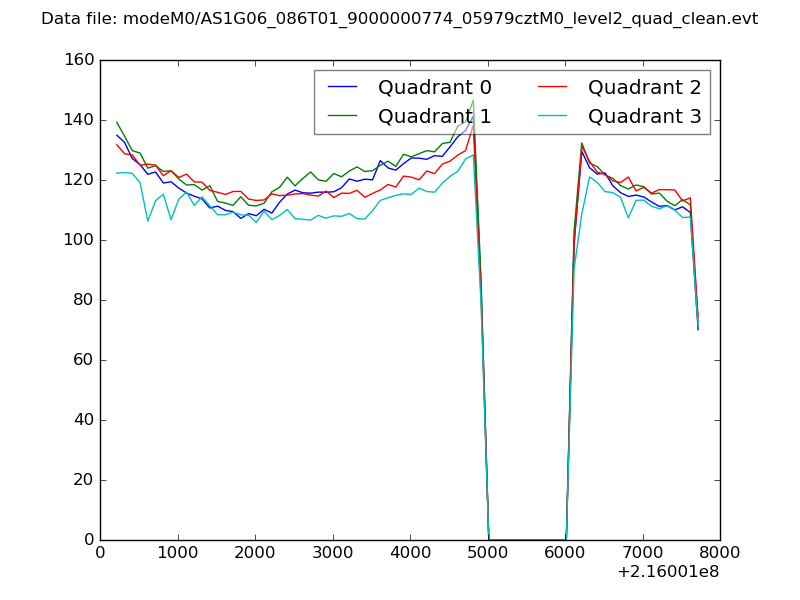 |
|
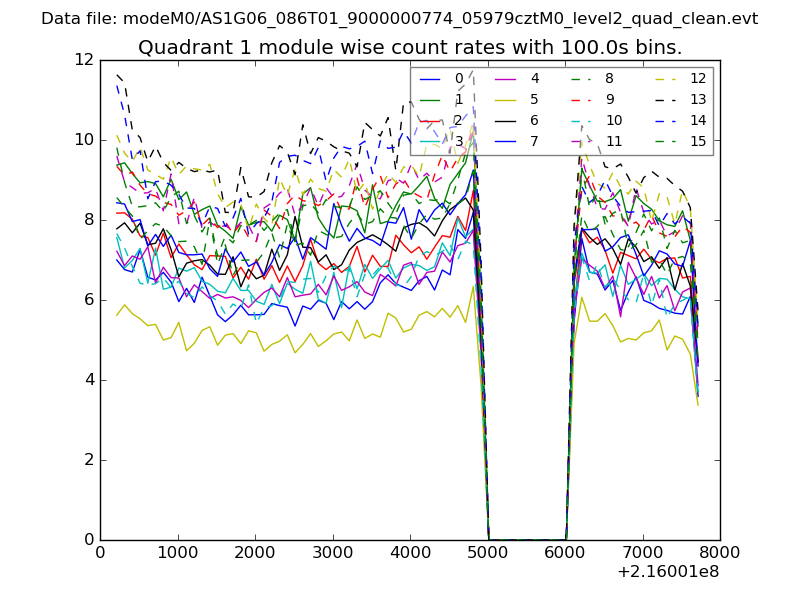
| Module-wise count rates for Quadrant A Data is divided into 100 sec bins |
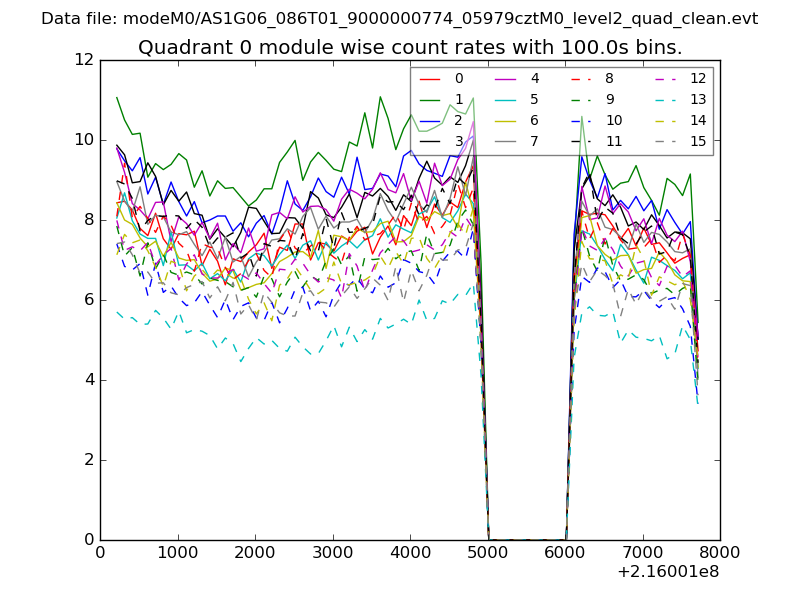 |
 |
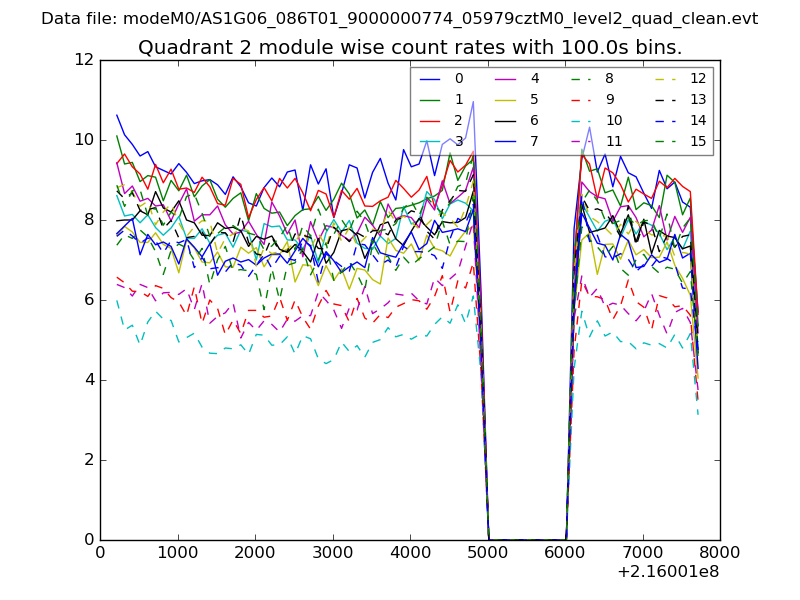
| Module-wise count rates for Quadrant B Data is divided into 100 sec bins |
 |
 |
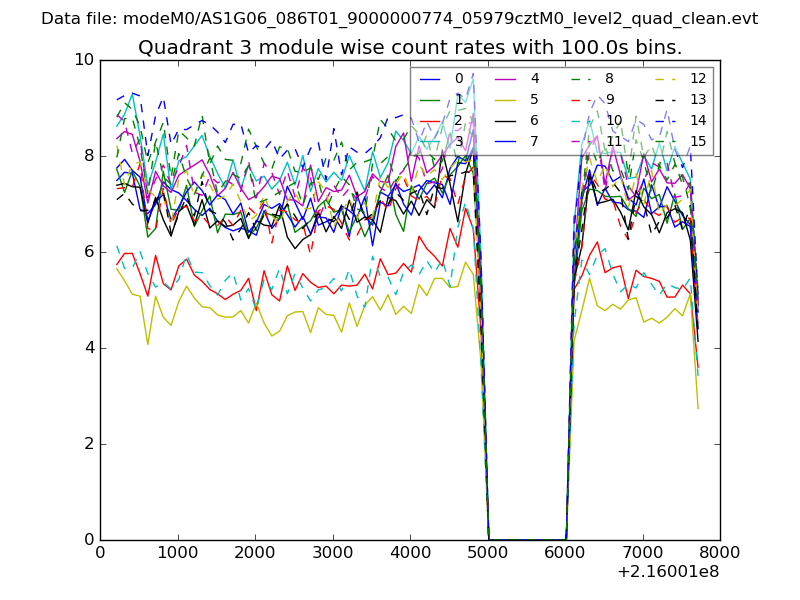
| Module-wise count rates for Quadrant C Data is divided into 100 sec bins |
 |
 |
| Module-wise count rates for Quadrant D Data is divided into 100 sec bins |
 |
 |
| Parameter | Plot |
|---|---|
| CZT HV Monitor |  |
| D_VDD | 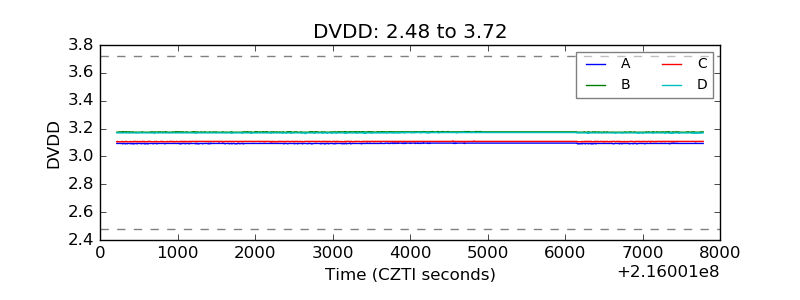 |
| Temperature 1 | 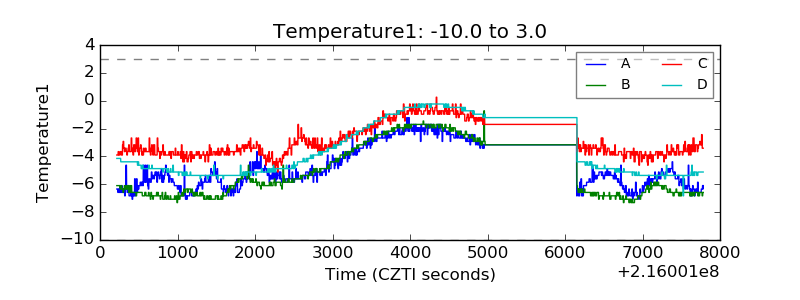 |
| Veto HV Monitor | 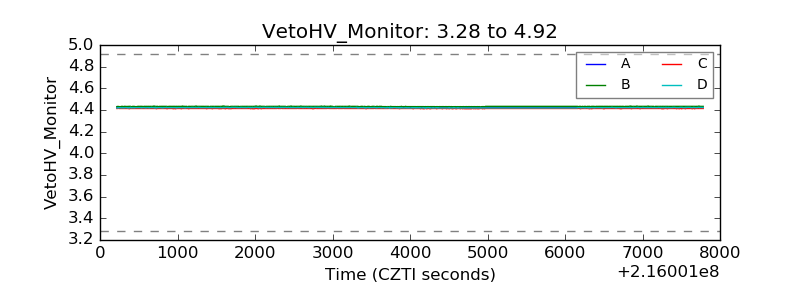 |
| Veto LLD | 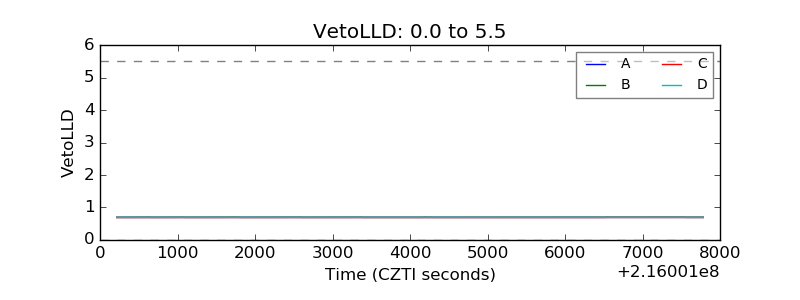 |
| Alpha Counter | 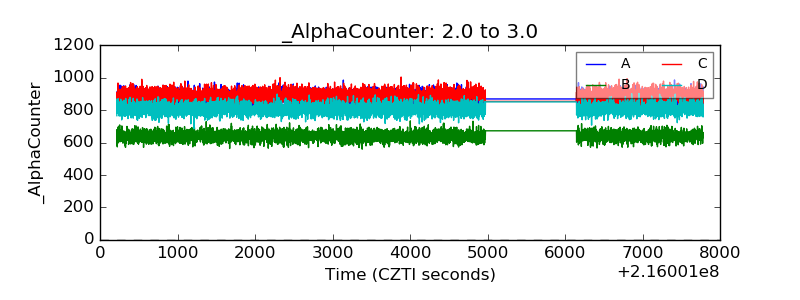 |
| _CPM_Rate | 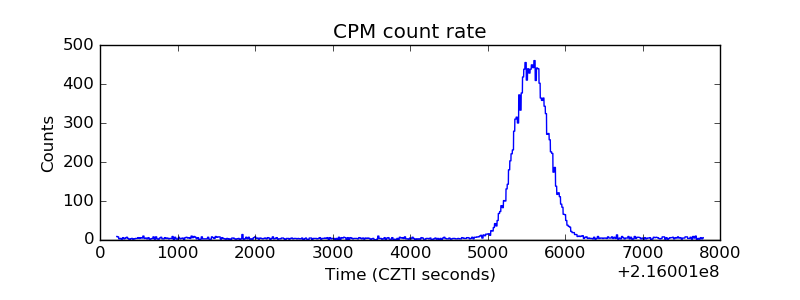 |
| CZT Counter | 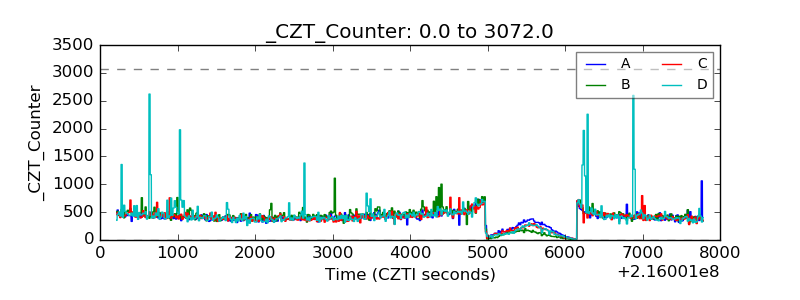 |
| +2.5 Volts monitor | 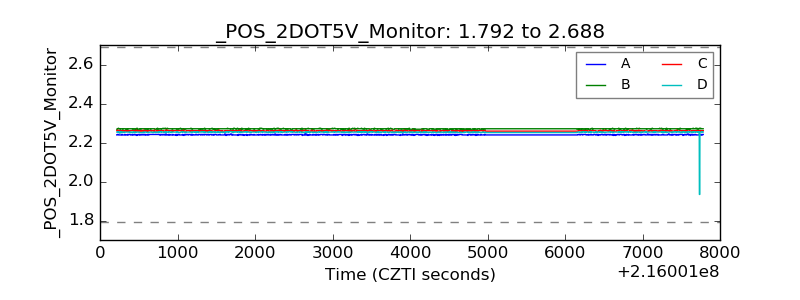 |
| +5 Volts monitor | 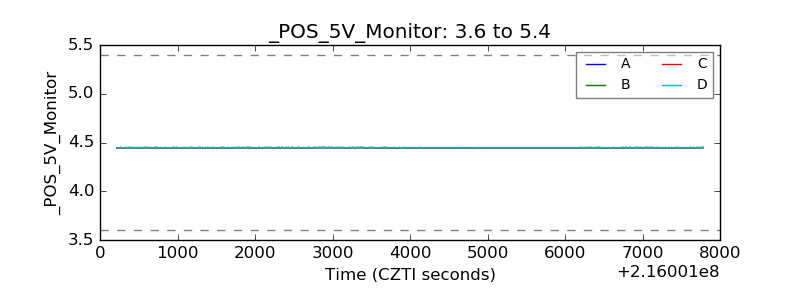 |
| _ROLL_ROT | 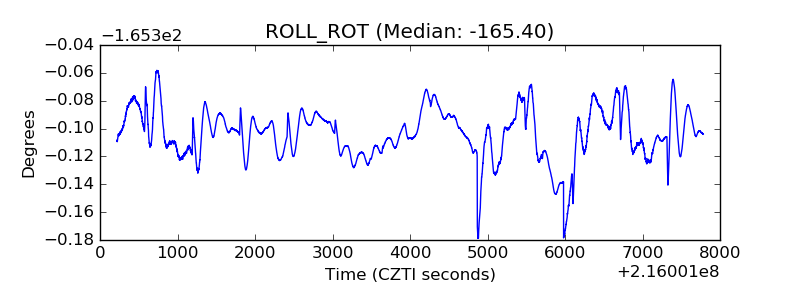 |
| _Roll_DEC | 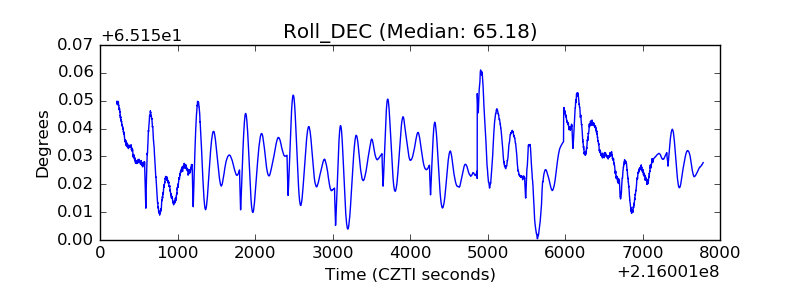 |
| _Roll_RA | 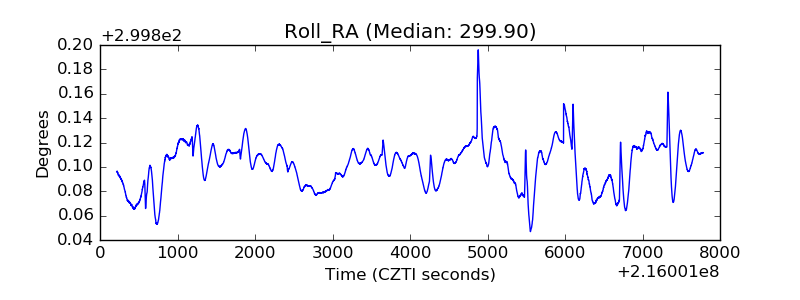 |
| Veto Counter | 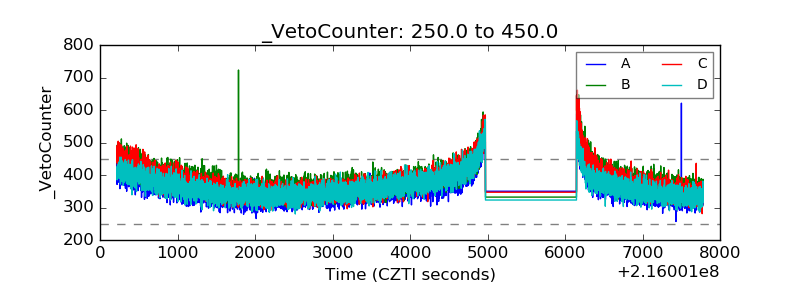 |