| Param | Original file | Final file |
|---|---|---|
| Filename | modeM0/AS1G06_086T01_9000000774_05980cztM0_level2.evt | modeM0/AS1G06_086T01_9000000774_05980cztM0_level2_quad_clean.evt |
| Size (bytes) | 446,086,080 | 125,527,680 |
| Size | 425.4 MB | 119.7 MB |
| Events in quadrant A | 3,223,543 | 830,158 |
| Events in quadrant B | 3,551,541 | 850,088 |
| Events in quadrant C | 3,055,479 | 835,080 |
| Events in quadrant D | 3,198,352 | 794,314 |
| Mode SS | |||
|---|---|---|---|
| Quadrant | BADHDUFLAG | Total packets | Discarded packets |
| A | 0 | 144 | 0 |
| B | 0 | 144 | 0 |
| C | 0 | 144 | 0 |
| D | 0 | 144 | 0 |
| Mode M9 | |||
|---|---|---|---|
| Quadrant | BADHDUFLAG | Total packets | Discarded packets |
| A | 0 | 21 | 0 |
| B | 0 | 21 | 0 |
| C | 0 | 21 | 0 |
| D | 0 | 21 | 0 |
| Mode M0 | |||
|---|---|---|---|
| Quadrant | BADHDUFLAG | Total packets | Discarded packets |
| A | 0 | 14834 | 3 |
| B | 0 | 15604 | 2 |
| C | 0 | 14508 | 2 |
| D | 0 | 15009 | 2 |
| Quadrant | Total seconds | Saturated seconds | Saturation percentage |
|---|---|---|---|
| A | 7076 | 48 | 0.678349% |
| B | 7076 | 75 | 1.059921% |
| C | 7076 | 21 | 0.296778% |
| D | 7076 | 52 | 0.734878% |
Noise dominated data is calculated using 1-second bins in cleaned event files. If a bin has >2000 counts, and if more than 50% of those come from <1% of pixels, then it is considered to be noise-dominated and hence unusable.
| Quadrant | # 1 sec bins | Bins with >0 counts | Bins with >2000 counts | High rate bins dominated by noise | Noise dominated (total time) | Noise dominated (detector-on time) | Marked lightcurve |
|---|---|---|---|---|---|---|---|
| A | 9116 | 7079 | 9 | 9 | 0.10% | 0.13% |  |
| B | 9116 | 7079 | 6 | 6 | 0.07% | 0.08% | 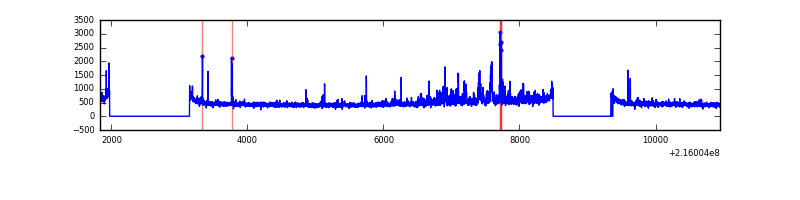 |
| C | 9116 | 7079 | 0 | 0 | 0.00% | 0.00% | 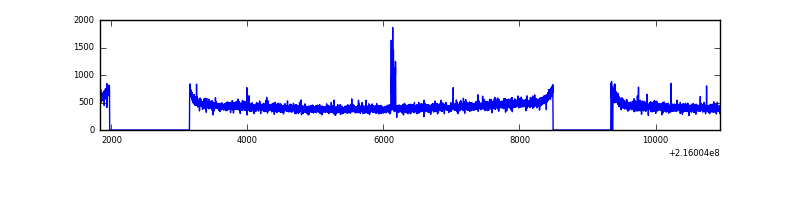 |
| D | 9116 | 7079 | 26 | 26 | 0.29% | 0.37% | 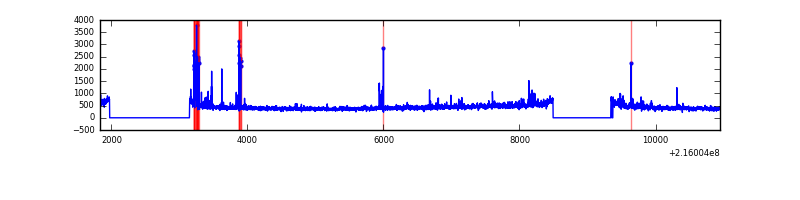 |
Top three noisy pixels from each quadrant. If the there are fewer than three noisy pixels in the level2.evt file, extra rows are filled as -1
| Pixel properties | Quadrant properties | ||||||
|---|---|---|---|---|---|---|---|
| Quadrant | DetID | PixID | Counts | Sigma | Mean | Median | Sigma |
| A | 4 | 2 | 87276 | 536.2 | 791 | 773 | 161.3 |
| A | 15 | 234 | 39748 | 241.59 | 791 | 773 | 161.3 |
| A | 7 | 16 | 23524 | 141.03 | 791 | 773 | 161.3 |
| B | 15 | 204 | 266852 | 1736.89 | 803 | 782 | 153.2 |
| B | 4 | 81 | 56579 | 364.24 | 803 | 782 | 153.2 |
| B | 0 | 219 | 44375 | 284.57 | 803 | 782 | 153.2 |
| C | 9 | 54 | 25556 | 138.7 | 774 | 776 | 178.7 |
| C | 13 | 61 | 6356 | 31.23 | 774 | 776 | 178.7 |
| C | 12 | 4 | 4042 | 18.28 | 774 | 776 | 178.7 |
| D | 2 | 63 | 112530 | 597.6 | 763 | 736 | 187.1 |
| D | 1 | 239 | 112520 | 597.55 | 763 | 736 | 187.1 |
| D | 8 | 195 | 50406 | 265.52 | 763 | 736 | 187.1 |
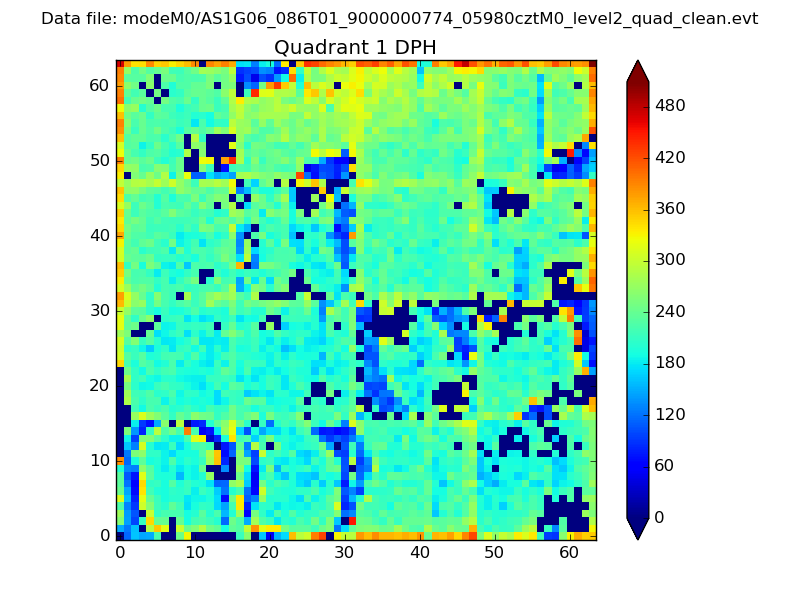
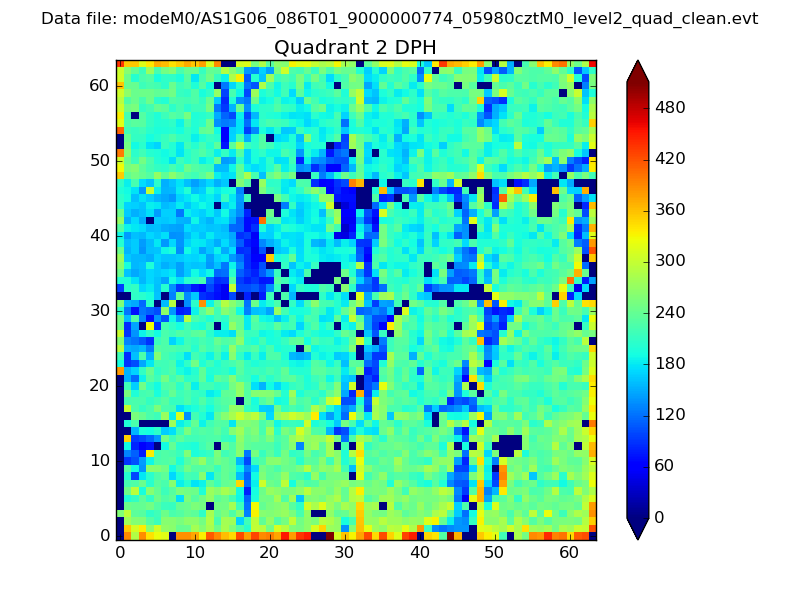
Histogram calculated using DETX and DETY for each event in the final _common_clean file
| Quadrant A | 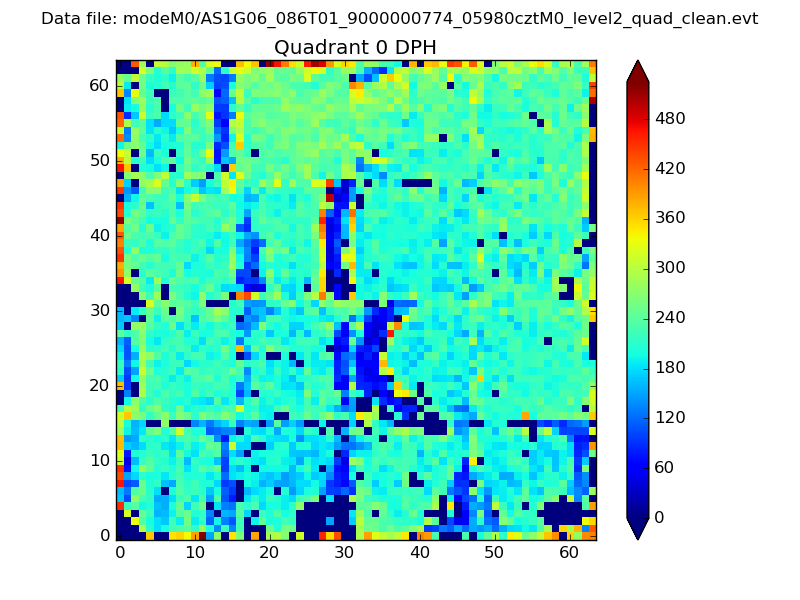 |
 |
Quadrant B |
|---|---|---|---|
| Quadrant D | 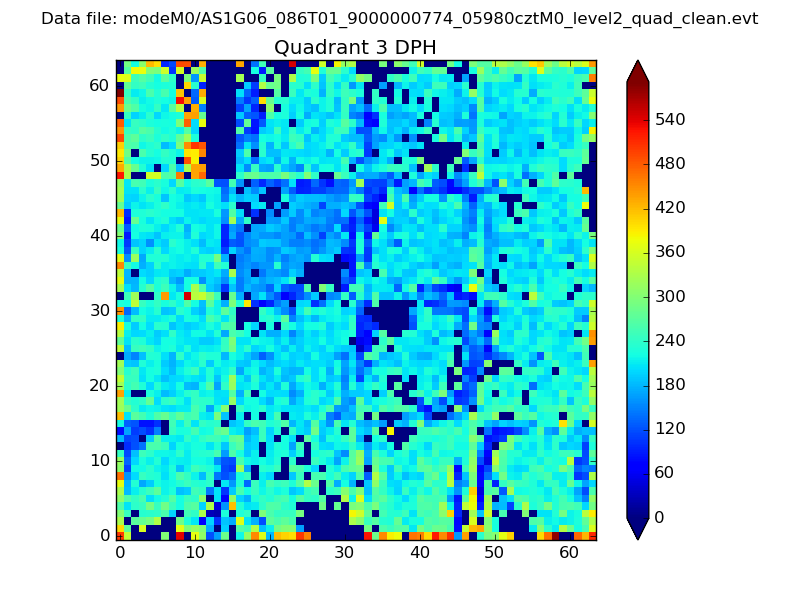 |
 |
Quadrant C |
| Plot type | Count rate plots | Images |
|---|---|---|
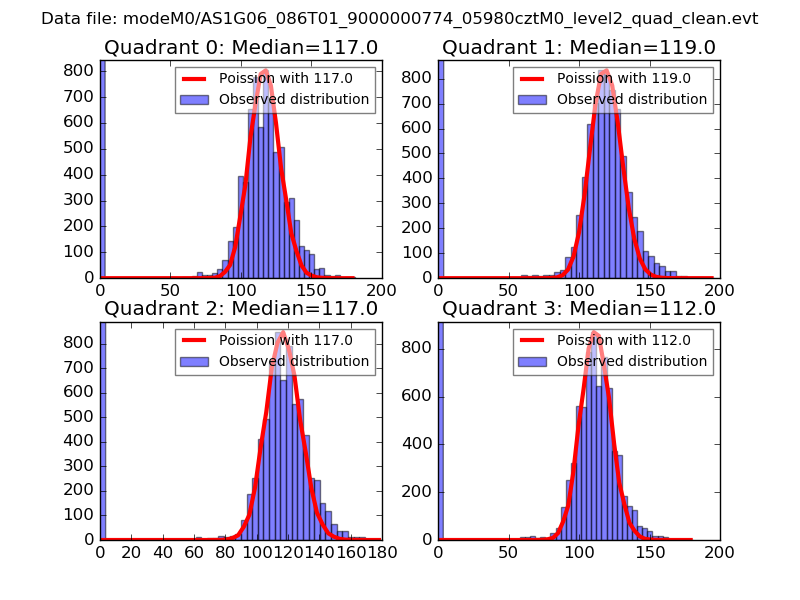
| Comparison with Poisson distribution Blue bars denote a histogram of data divided into 1 sec bins. Red curve is a Poisson curve with rate = median count rate of data. |
 |
 |
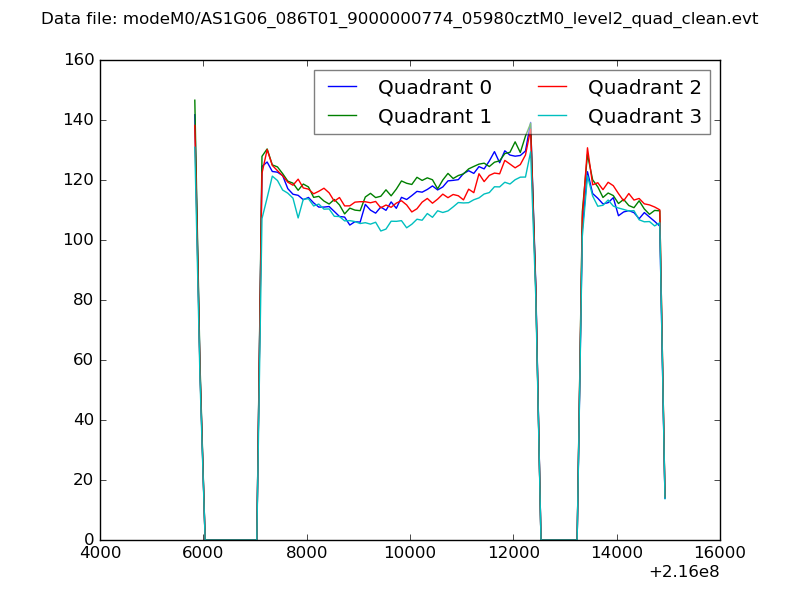
| Quadrant-wise count rates Data is divided into 100 sec bins |
 |
|
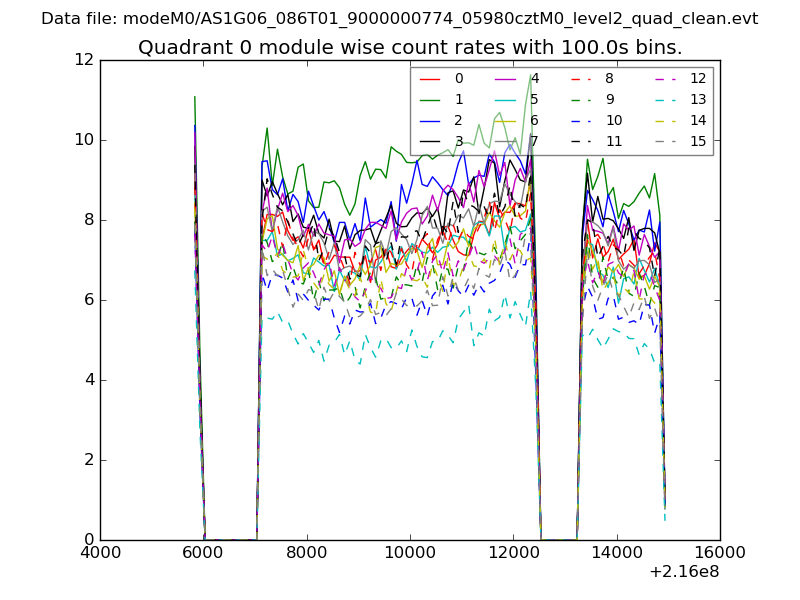
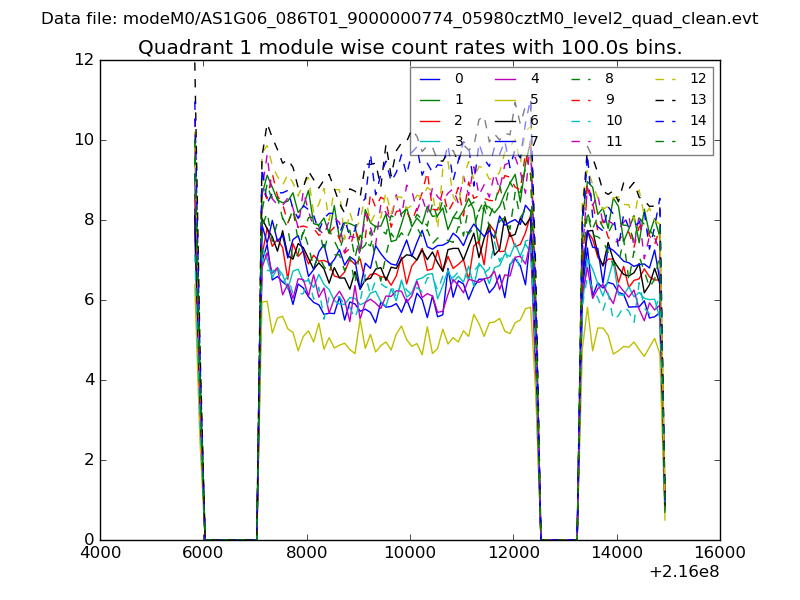
| Module-wise count rates for Quadrant A Data is divided into 100 sec bins |
 |
 |
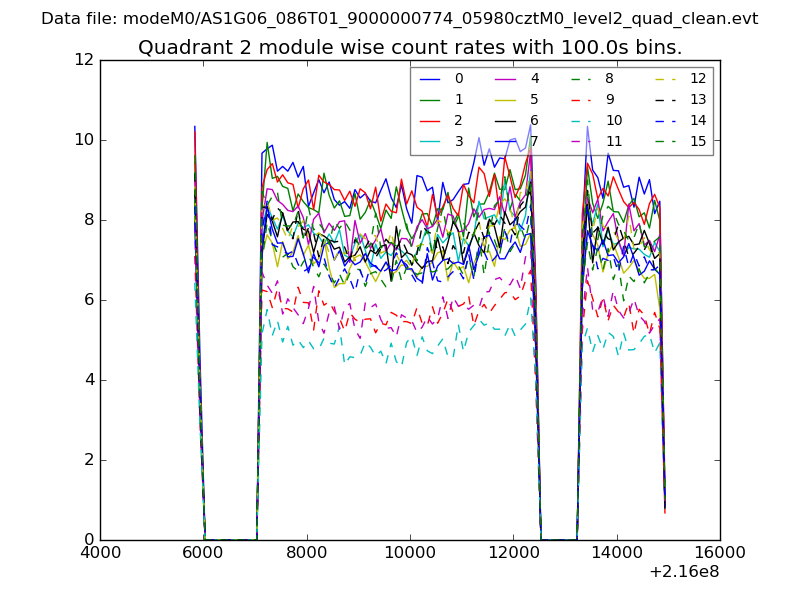
| Module-wise count rates for Quadrant B Data is divided into 100 sec bins |
 |
 |
| Module-wise count rates for Quadrant C Data is divided into 100 sec bins |
 |
 |
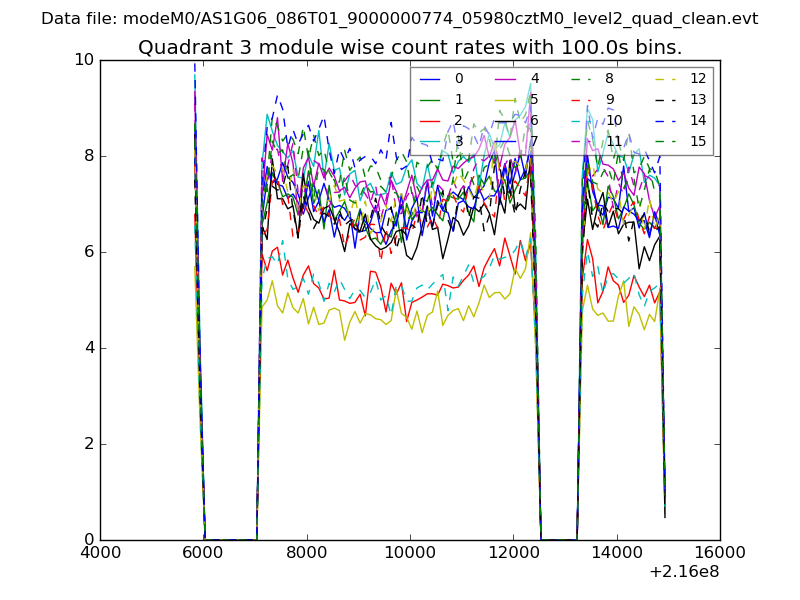
| Module-wise count rates for Quadrant D Data is divided into 100 sec bins |
 |
 |
| Parameter | Plot |
|---|---|
| CZT HV Monitor | 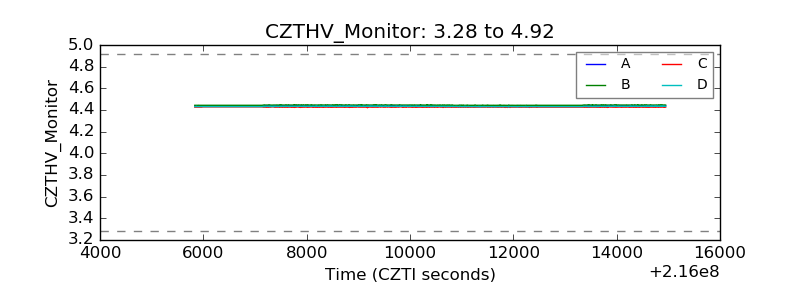 |
| D_VDD | 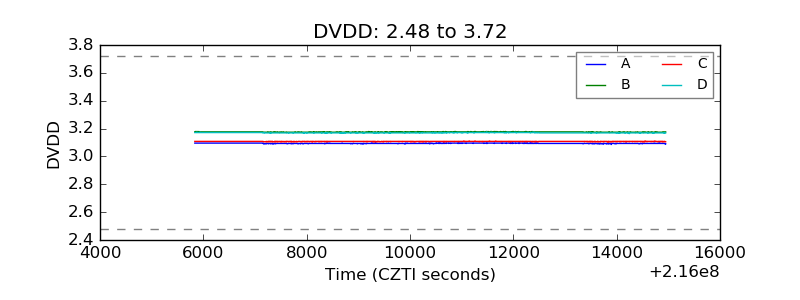 |
| Temperature 1 | 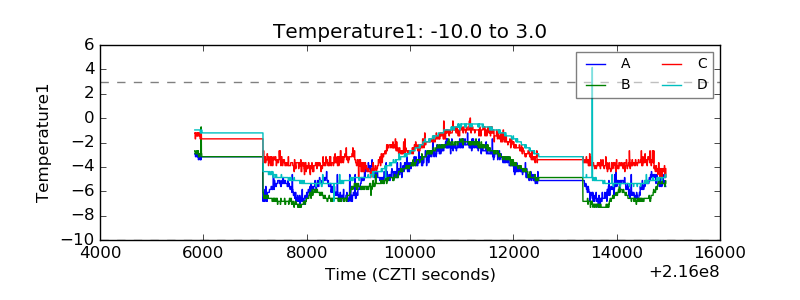 |
| Veto HV Monitor | 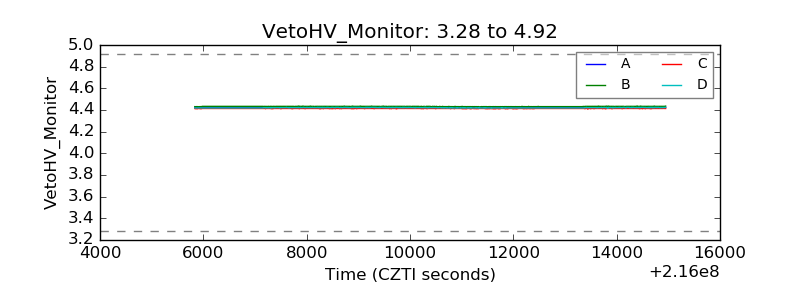 |
| Veto LLD | 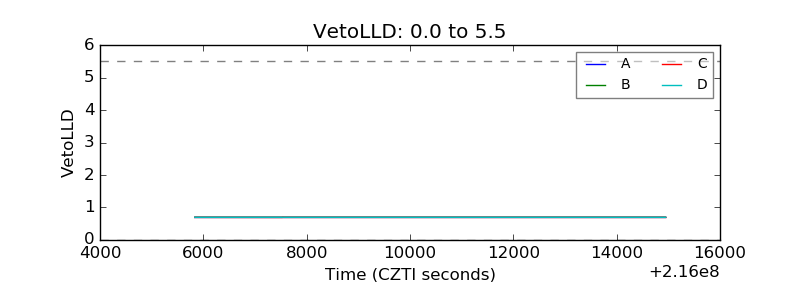 |
| Alpha Counter | 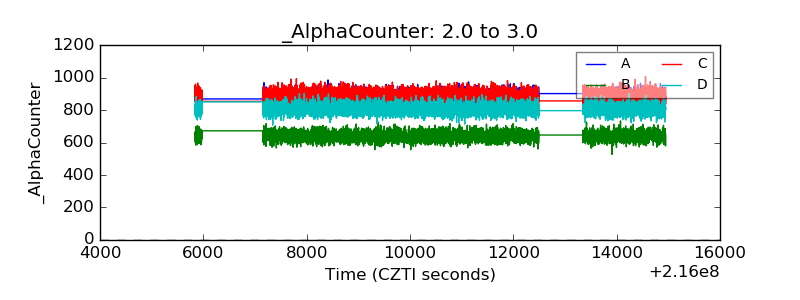 |
| _CPM_Rate | 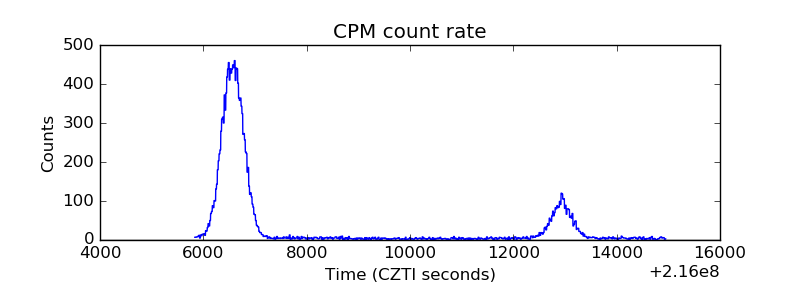 |
| CZT Counter | 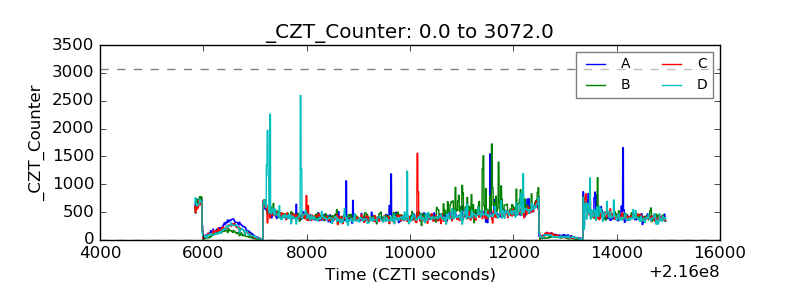 |
| +2.5 Volts monitor |  |
| +5 Volts monitor |  |
| _ROLL_ROT | 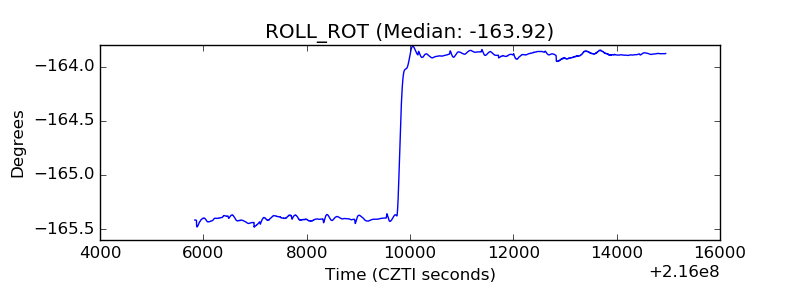 |
| _Roll_DEC | 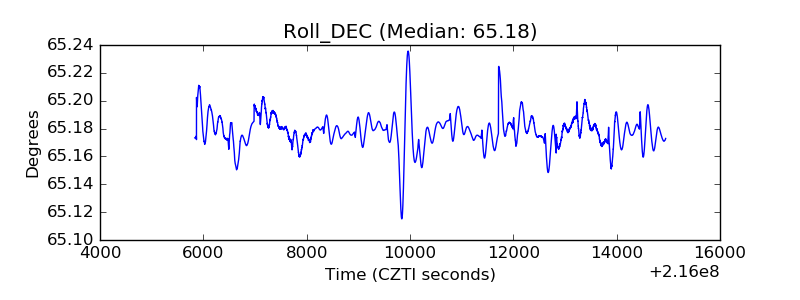 |
| _Roll_RA | 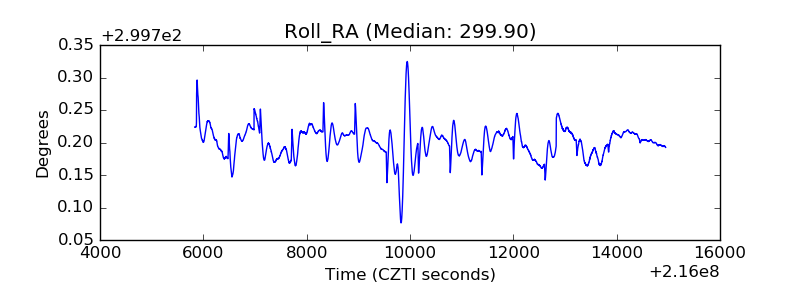 |
| Veto Counter | 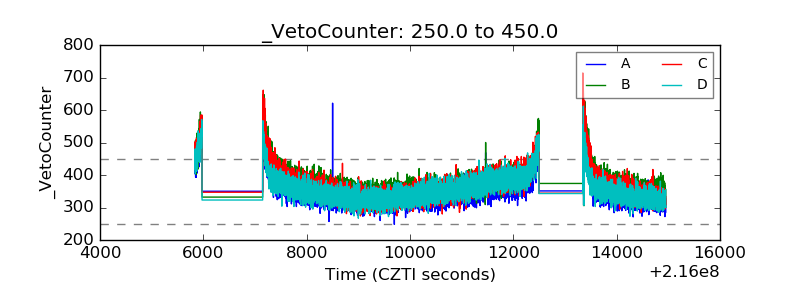 |