| Param | Original file | Final file |
|---|---|---|
| Filename | modeM0/AS1G06_086T01_9000000774_05982cztM0_level2.evt | modeM0/AS1G06_086T01_9000000774_05982cztM0_level2_quad_clean.evt |
| Size (bytes) | 411,658,560 | 116,830,080 |
| Size | 392.6 MB | 111.4 MB |
| Events in quadrant A | 2,997,381 | 774,991 |
| Events in quadrant B | 3,183,211 | 791,454 |
| Events in quadrant C | 2,954,214 | 771,770 |
| Events in quadrant D | 2,878,526 | 735,804 |
| Mode SS | |||
|---|---|---|---|
| Quadrant | BADHDUFLAG | Total packets | Discarded packets |
| A | 0 | 156 | 18 |
| B | 0 | 156 | 24 |
| C | 0 | 156 | 28 |
| D | 0 | 156 | 20 |
| Mode M0 | |||
|---|---|---|---|
| Quadrant | BADHDUFLAG | Total packets | Discarded packets |
| A | 0 | 16040 | 2223 |
| B | 0 | 16275 | 2372 |
| C | 0 | 15881 | 2207 |
| D | 0 | 15922 | 2204 |
| Quadrant | Total seconds | Saturated seconds | Saturation percentage |
|---|---|---|---|
| A | 6646 | 170 | 2.557930% |
| B | 6620 | 127 | 1.918429% |
| C | 6653 | 32 | 0.480986% |
| D | 6659 | 88 | 1.321520% |
Noise dominated data is calculated using 1-second bins in cleaned event files. If a bin has >2000 counts, and if more than 50% of those come from <1% of pixels, then it is considered to be noise-dominated and hence unusable.
| Quadrant | # 1 sec bins | Bins with >0 counts | Bins with >2000 counts | High rate bins dominated by noise | Noise dominated (total time) | Noise dominated (detector-on time) | Marked lightcurve |
|---|---|---|---|---|---|---|---|
| A | 7800 | 7133 | 14 | 14 | 0.18% | 0.20% | 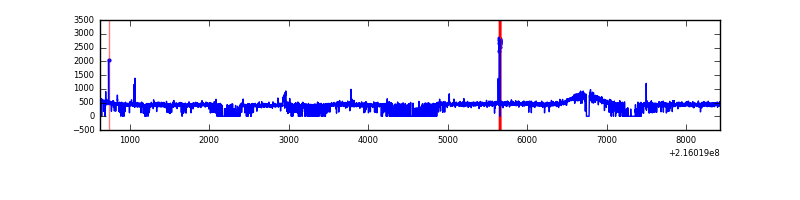 |
| B | 7800 | 7127 | 0 | 0 | 0.00% | 0.00% | 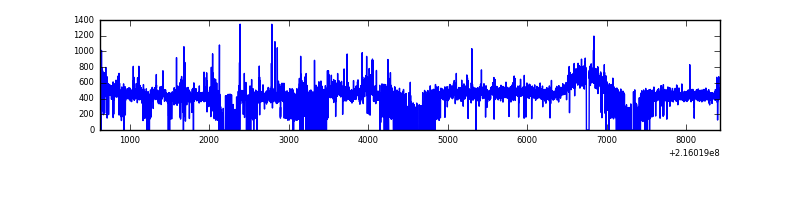 |
| C | 7800 | 7131 | 0 | 0 | 0.00% | 0.00% | 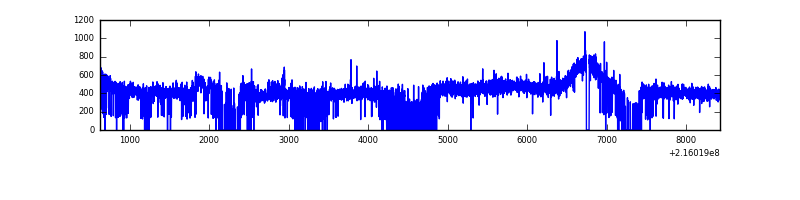 |
| D | 7799 | 7180 | 2 | 2 | 0.03% | 0.03% | 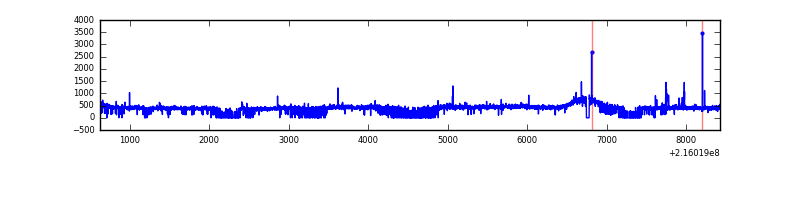 |
Top three noisy pixels from each quadrant. If the there are fewer than three noisy pixels in the level2.evt file, extra rows are filled as -1
| Pixel properties | Quadrant properties | ||||||
|---|---|---|---|---|---|---|---|
| Quadrant | DetID | PixID | Counts | Sigma | Mean | Median | Sigma |
| A | 15 | 234 | 55036 | 344.35 | 759 | 738 | 157.7 |
| A | 14 | 111 | 8476 | 49.07 | 759 | 738 | 157.7 |
| A | 4 | 2 | 8008 | 46.1 | 759 | 738 | 157.7 |
| B | 15 | 204 | 102777 | 682.77 | 767 | 748 | 149.4 |
| B | 4 | 81 | 57711 | 381.19 | 767 | 748 | 149.4 |
| B | 0 | 219 | 29439 | 192.0 | 767 | 748 | 149.4 |
| C | 14 | 206 | 54452 | 314.38 | 738 | 741 | 170.8 |
| C | 12 | 4 | 7274 | 38.24 | 738 | 741 | 170.8 |
| C | 9 | 54 | 6857 | 35.8 | 738 | 741 | 170.8 |
| D | 8 | 195 | 56137 | 302.74 | 735 | 710 | 183.1 |
| D | 12 | 233 | 23719 | 125.68 | 735 | 710 | 183.1 |
| D | 1 | 239 | 11891 | 61.07 | 735 | 710 | 183.1 |
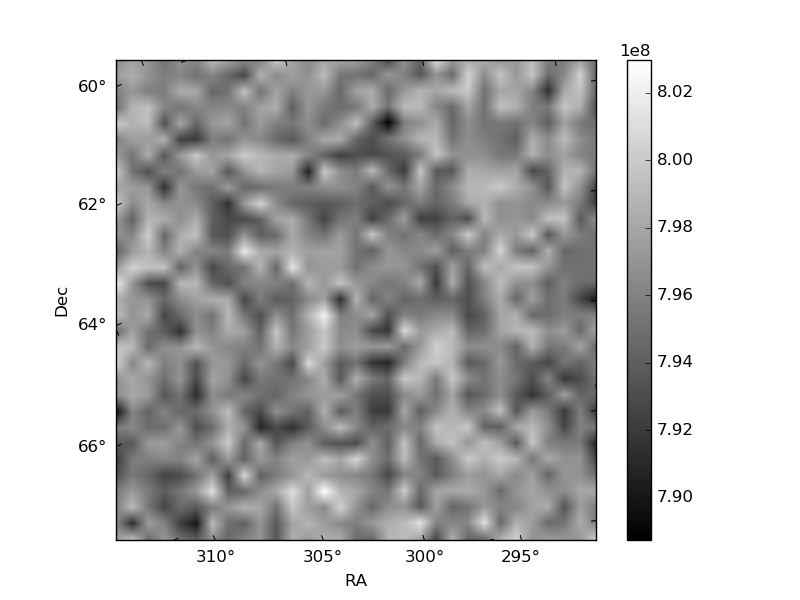
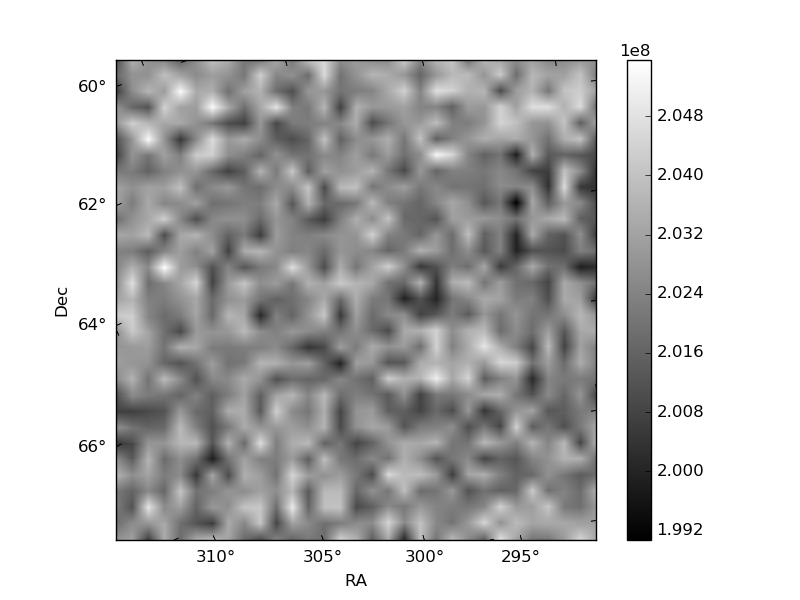
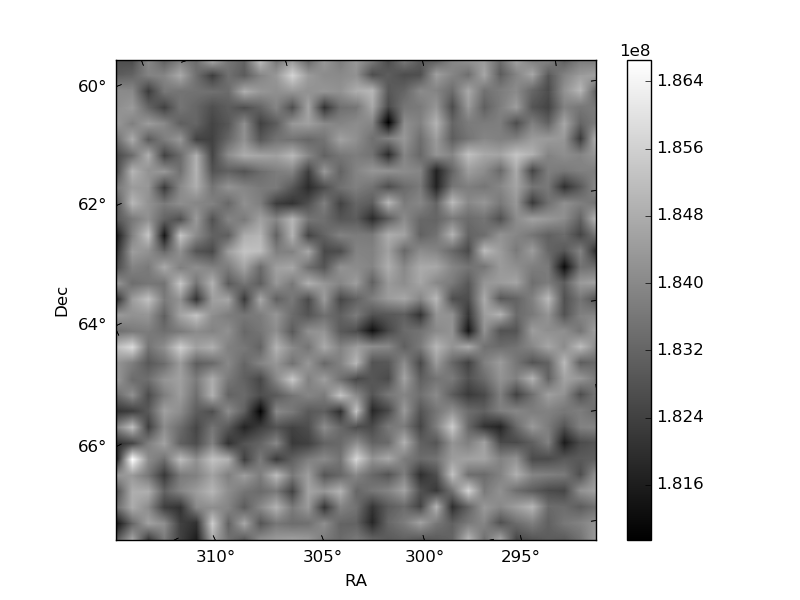
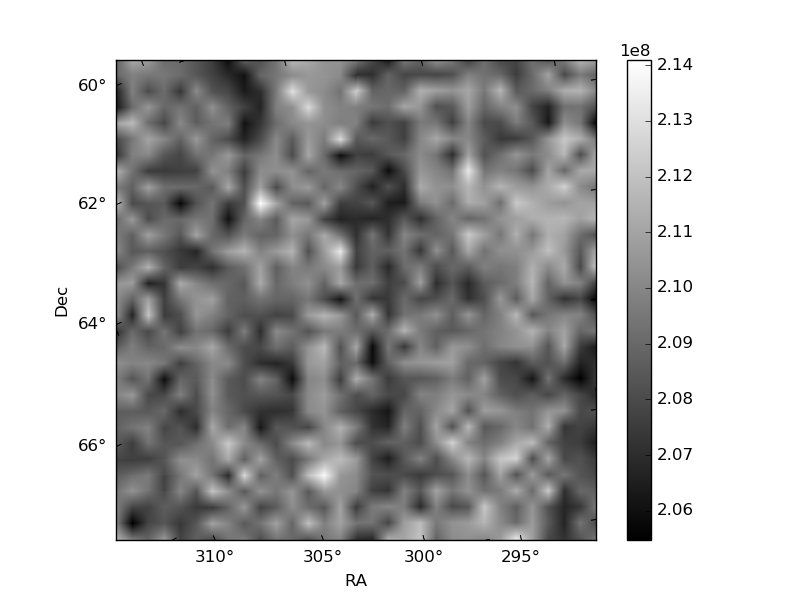
Histogram calculated using DETX and DETY for each event in the final _common_clean file
| Quadrant A | 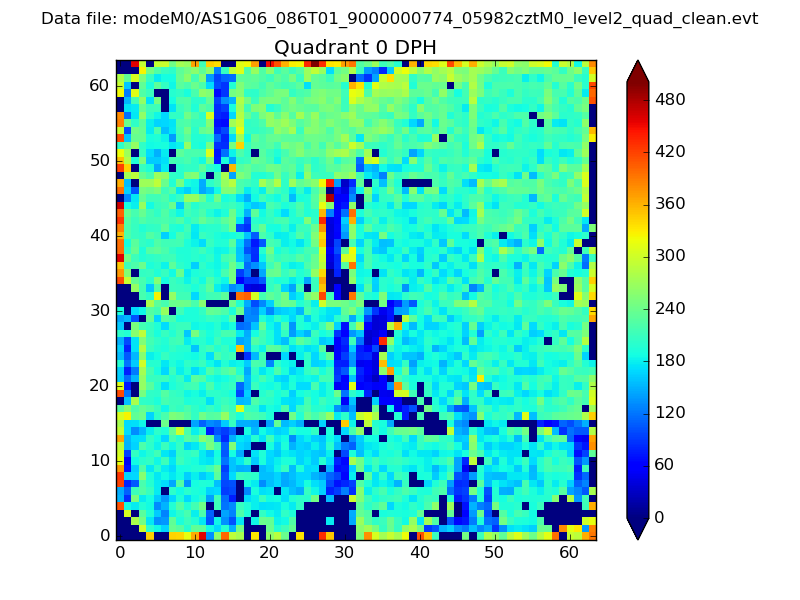 |
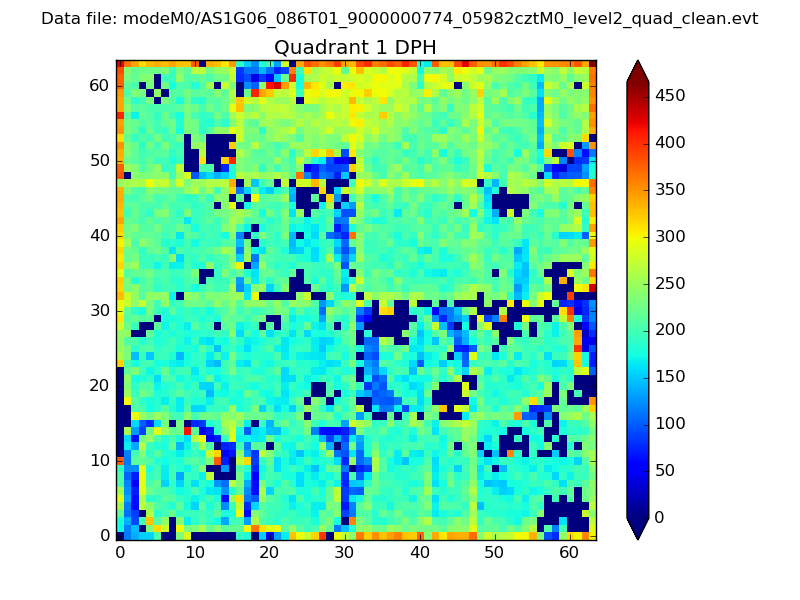 |
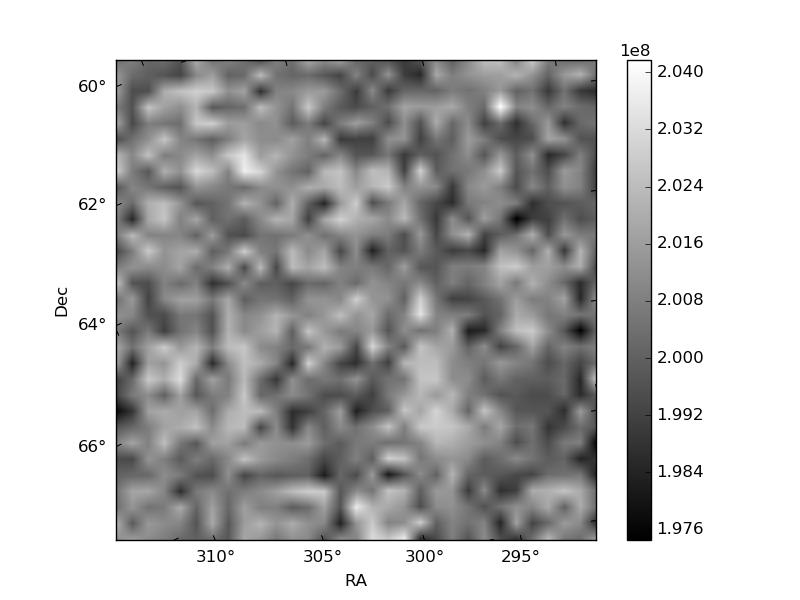
Quadrant B |
|---|---|---|---|
| Quadrant D | 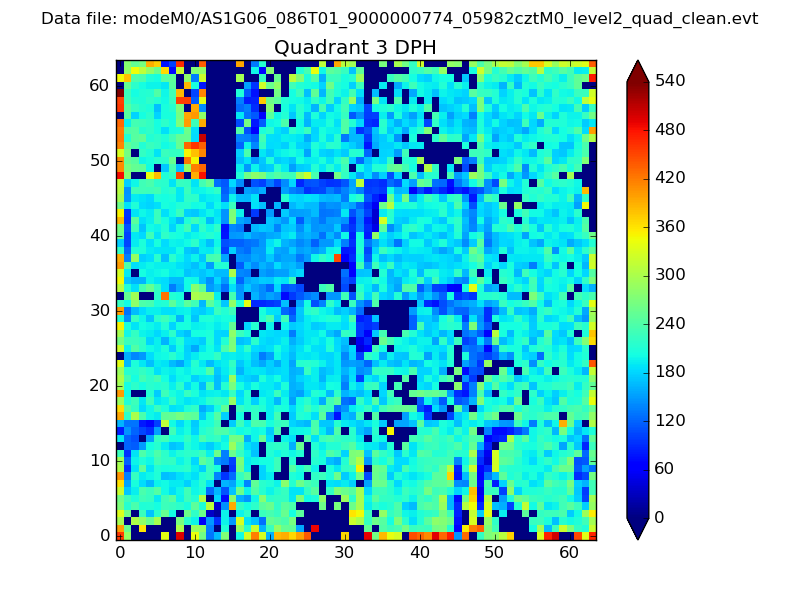 |
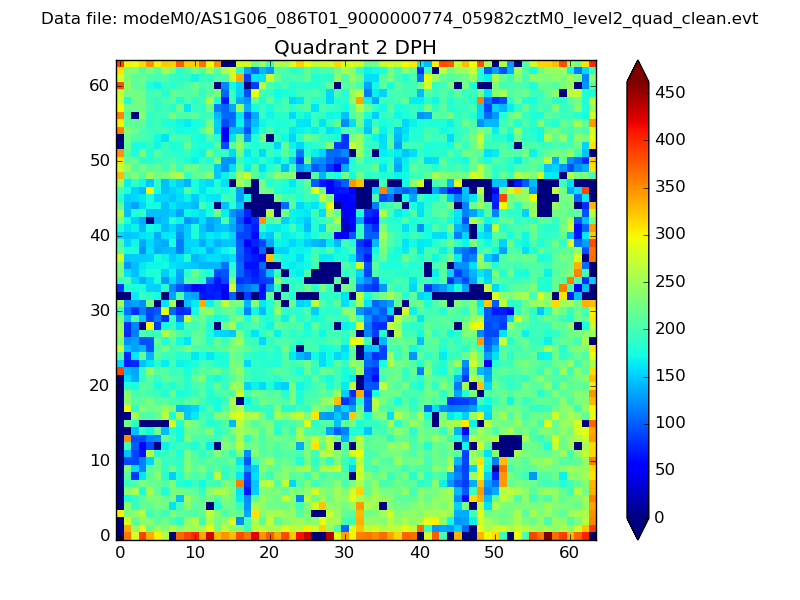 |
Quadrant C |
| Plot type | Count rate plots | Images |
|---|---|---|
| Comparison with Poisson distribution Blue bars denote a histogram of data divided into 1 sec bins. Red curve is a Poisson curve with rate = median count rate of data. |
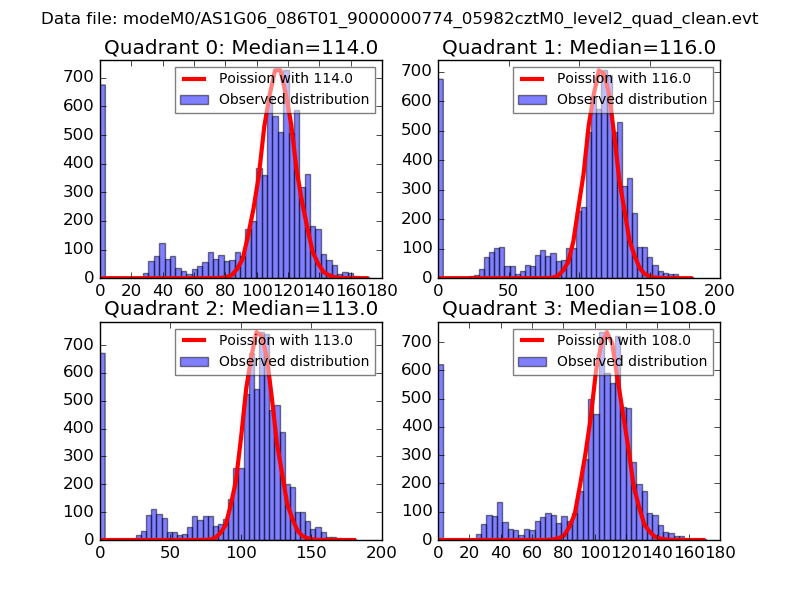 |
 |
| Quadrant-wise count rates Data is divided into 100 sec bins |
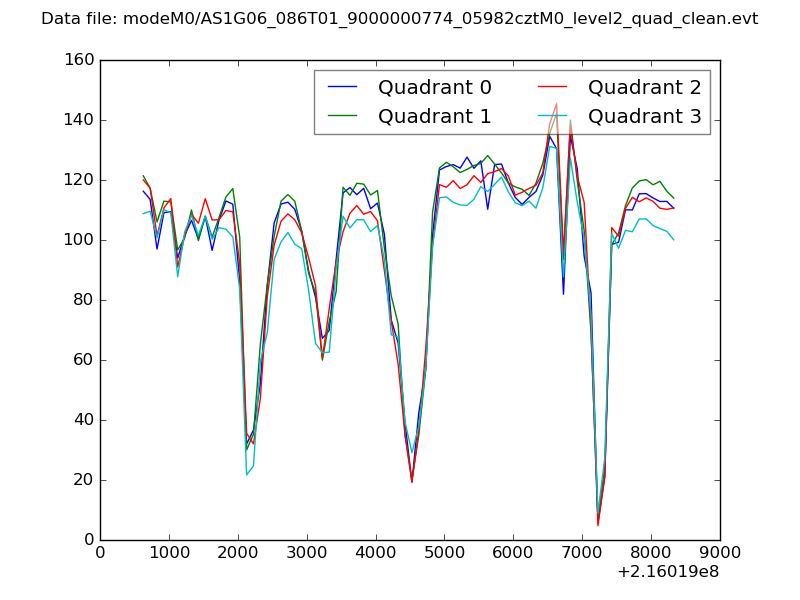 |
|
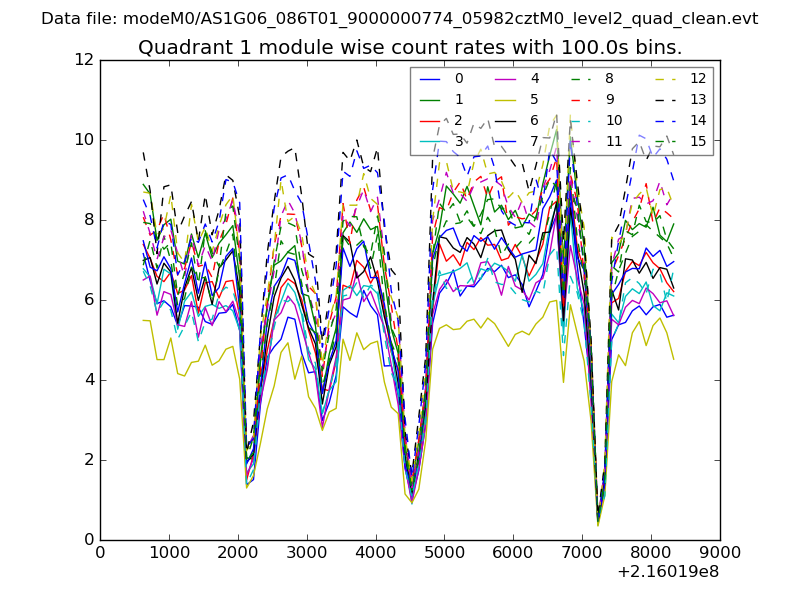
| Module-wise count rates for Quadrant A Data is divided into 100 sec bins |
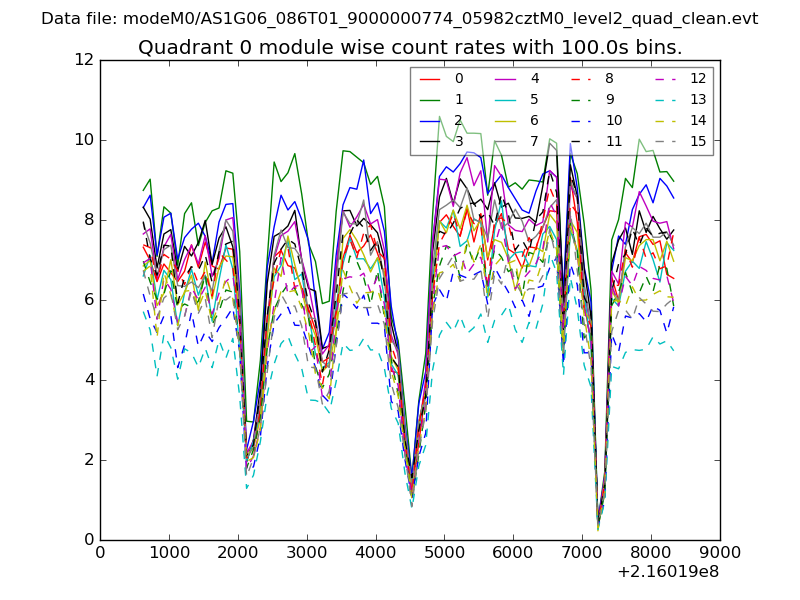 |
 |
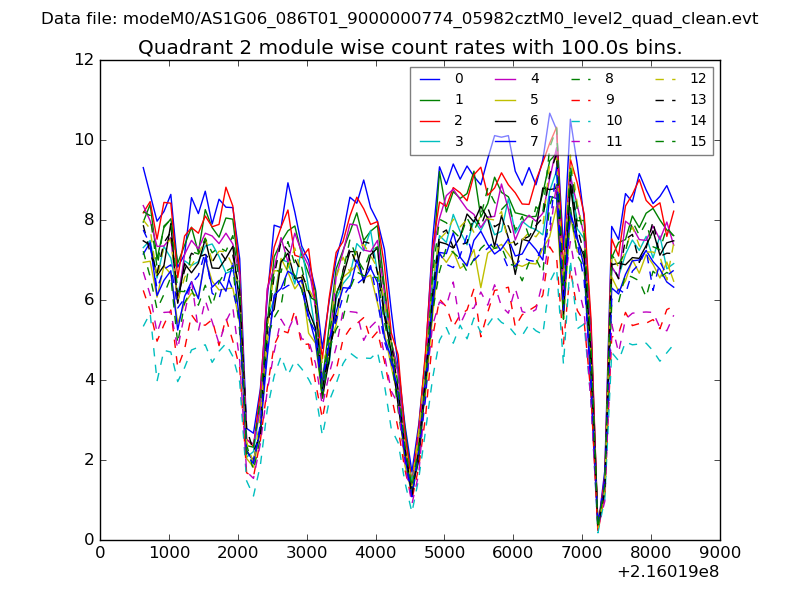
| Module-wise count rates for Quadrant B Data is divided into 100 sec bins |
 |
 |
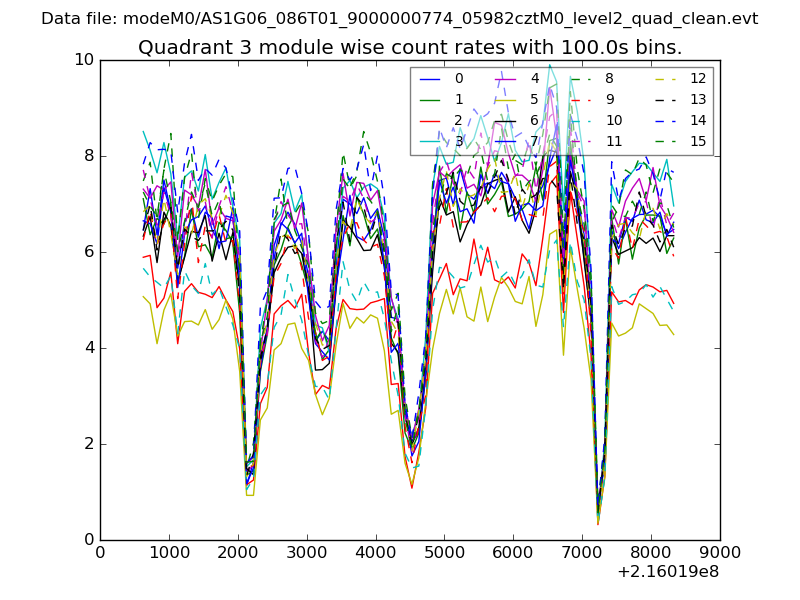
| Module-wise count rates for Quadrant C Data is divided into 100 sec bins |
 |
 |
| Module-wise count rates for Quadrant D Data is divided into 100 sec bins |
 |
 |
| Parameter | Plot |
|---|---|
| CZT HV Monitor | 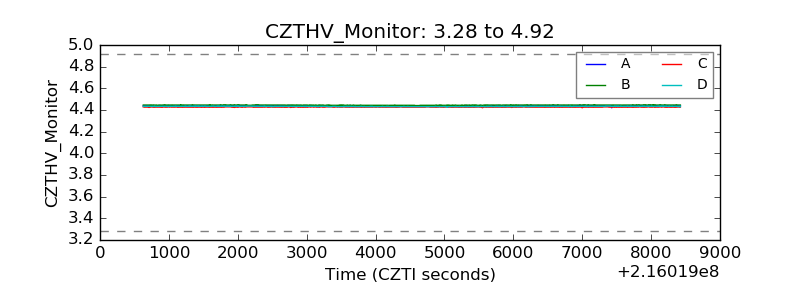 |
| D_VDD | 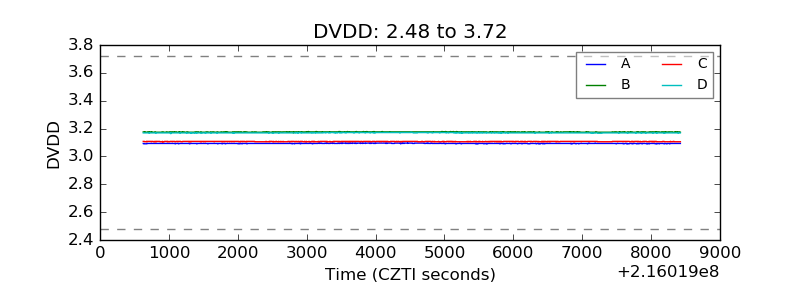 |
| Temperature 1 | 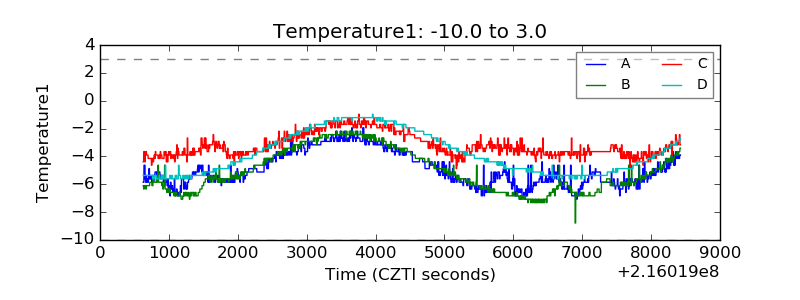 |
| Veto HV Monitor |  |
| Veto LLD | 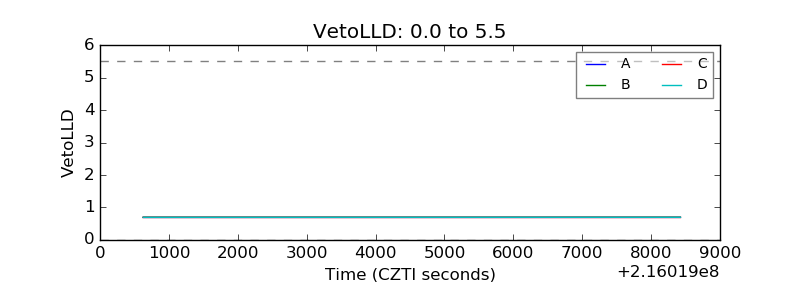 |
| Alpha Counter | 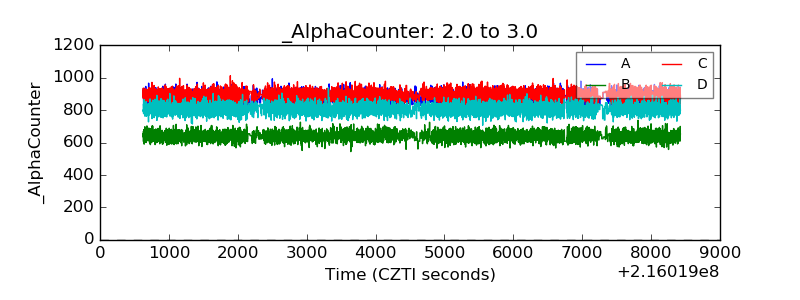 |
| _CPM_Rate | 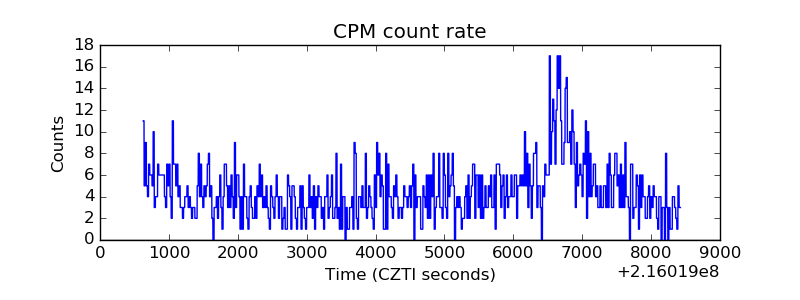 |
| CZT Counter | 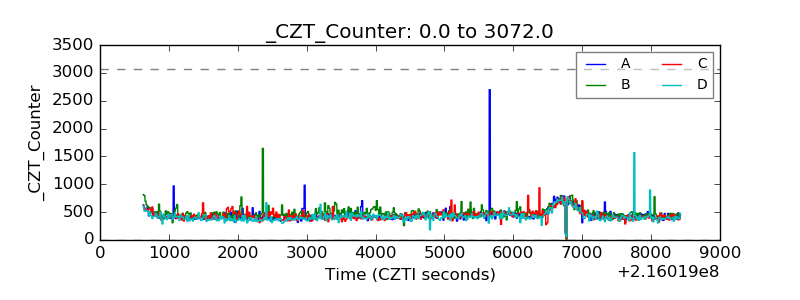 |
| +2.5 Volts monitor |  |
| +5 Volts monitor |  |
| _ROLL_ROT | 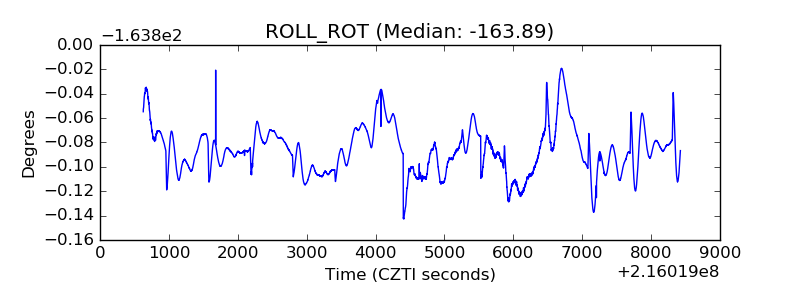 |
| _Roll_DEC | 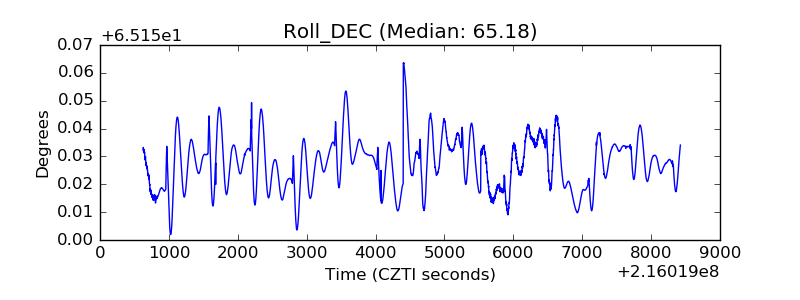 |
| _Roll_RA | 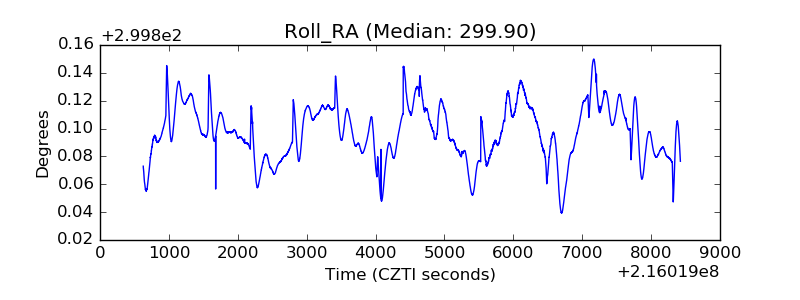 |
| Veto Counter | 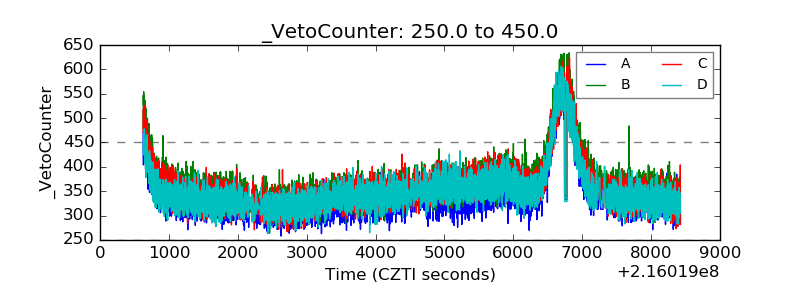 |