| Param | Original file | Final file |
|---|---|---|
| Filename | modeM0/AS1G06_086T01_9000000774_05987cztM0_level2.evt | modeM0/AS1G06_086T01_9000000774_05987cztM0_level2_quad_clean.evt |
| Size (bytes) | 1,345,705,920 | 243,282,240 |
| Size | 1.3 GB | 232.0 MB |
| Events in quadrant A | 17,287,339 | 1,363,134 |
| Events in quadrant B | 7,024,245 | 1,741,145 |
| Events in quadrant C | 8,796,415 | 1,646,545 |
| Events in quadrant D | 6,671,297 | 1,618,845 |
| Mode SS | |||
|---|---|---|---|
| Quadrant | BADHDUFLAG | Total packets | Discarded packets |
| A | 0 | 326 | 20 |
| B | 0 | 324 | 24 |
| C | 0 | 325 | 29 |
| D | 0 | 324 | 32 |
| Mode M9 | |||
|---|---|---|---|
| Quadrant | BADHDUFLAG | Total packets | Discarded packets |
| A | 0 | 26 | 2 |
| B | 0 | 25 | 2 |
| C | 0 | 25 | 0 |
| D | 0 | 25 | 1 |
| Mode M0 | |||
|---|---|---|---|
| Quadrant | BADHDUFLAG | Total packets | Discarded packets |
| A | 0 | 73410 | 12377 |
| B | 0 | 33807 | 3022 |
| C | 0 | 41305 | 4671 |
| D | 0 | 33580 | 2877 |
| Quadrant | Total seconds | Saturated seconds | Saturation percentage |
|---|---|---|---|
| A | 13915 | 4854 | 34.883220% |
| B | 14603 | 88 | 0.602616% |
| C | 14481 | 284 | 1.961191% |
| D | 14634 | 100 | 0.683340% |
Noise dominated data is calculated using 1-second bins in cleaned event files. If a bin has >2000 counts, and if more than 50% of those come from <1% of pixels, then it is considered to be noise-dominated and hence unusable.
| Quadrant | # 1 sec bins | Bins with >0 counts | Bins with >2000 counts | High rate bins dominated by noise | Noise dominated (total time) | Noise dominated (detector-on time) | Marked lightcurve |
|---|---|---|---|---|---|---|---|
| A | 18494 | 14422 | 4209 | 4209 | 22.76% | 29.18% | 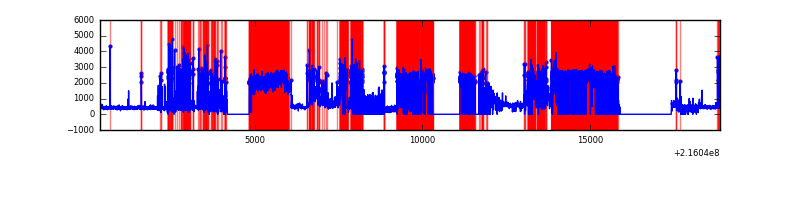 |
| B | 18494 | 15204 | 6 | 6 | 0.03% | 0.04% | 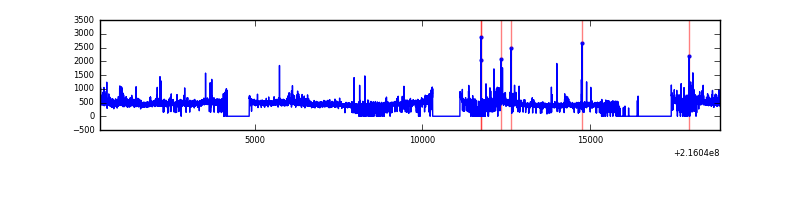 |
| C | 18494 | 15084 | 151 | 151 | 0.82% | 1.00% | 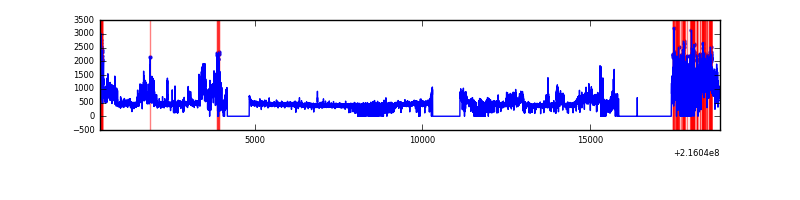 |
| D | 18494 | 15175 | 10 | 10 | 0.05% | 0.07% | 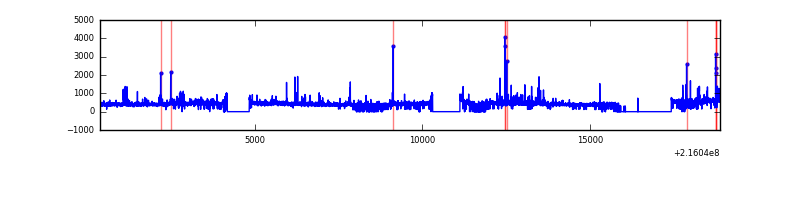 |
Top three noisy pixels from each quadrant. If the there are fewer than three noisy pixels in the level2.evt file, extra rows are filled as -1
| Pixel properties | Quadrant properties | ||||||
|---|---|---|---|---|---|---|---|
| Quadrant | DetID | PixID | Counts | Sigma | Mean | Median | Sigma |
| A | 15 | 234 | 12010032 | 44343.84 | 1331 | 1304 | 270.8 |
| A | 15 | 236 | 58349 | 210.65 | 1331 | 1304 | 270.8 |
| A | 13 | 251 | 47199 | 169.47 | 1331 | 1304 | 270.8 |
| B | 15 | 204 | 225556 | 722.67 | 1646 | 1607 | 309.9 |
| B | 0 | 219 | 145325 | 463.77 | 1646 | 1607 | 309.9 |
| B | 0 | 214 | 112892 | 359.11 | 1646 | 1607 | 309.9 |
| C | 1 | 241 | 2613006 | 7181.99 | 1568 | 1578 | 363.6 |
| C | 9 | 54 | 43106 | 114.21 | 1568 | 1578 | 363.6 |
| C | 1 | 16 | 16933 | 42.23 | 1568 | 1578 | 363.6 |
| D | 1 | 239 | 191985 | 487.68 | 1589 | 1536 | 390.5 |
| D | 2 | 63 | 163479 | 414.69 | 1589 | 1536 | 390.5 |
| D | 12 | 110 | 97101 | 244.71 | 1589 | 1536 | 390.5 |
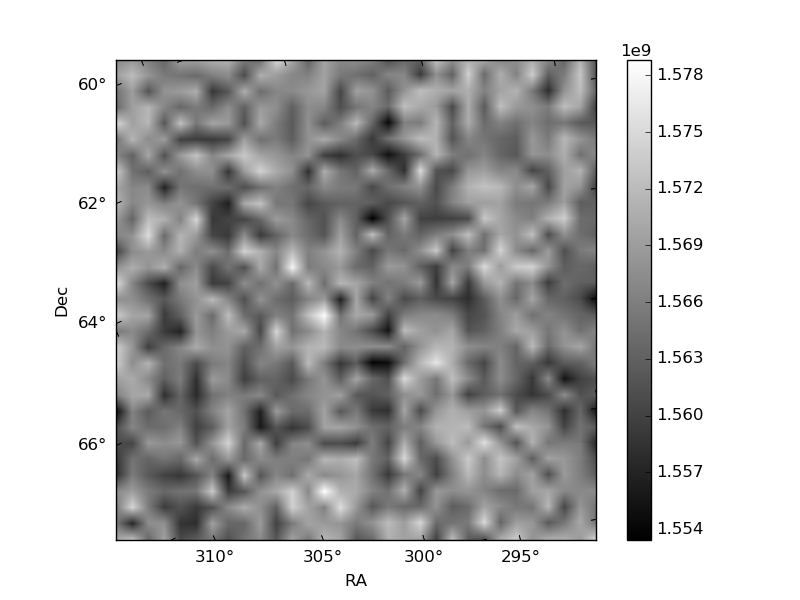
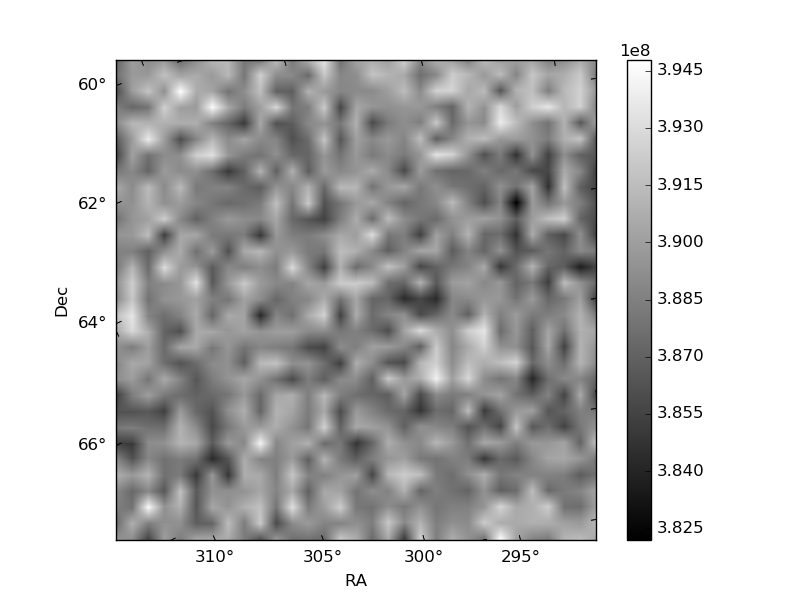
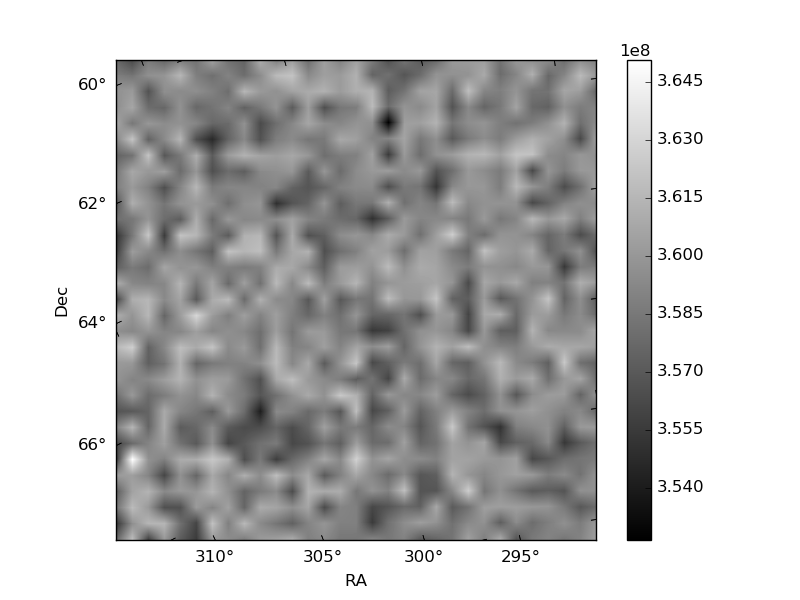
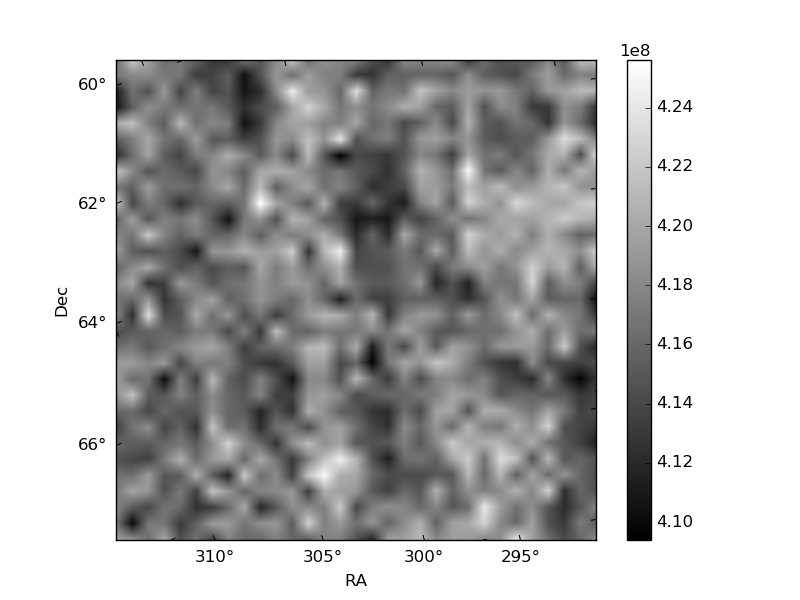
Histogram calculated using DETX and DETY for each event in the final _common_clean file
| Quadrant A | 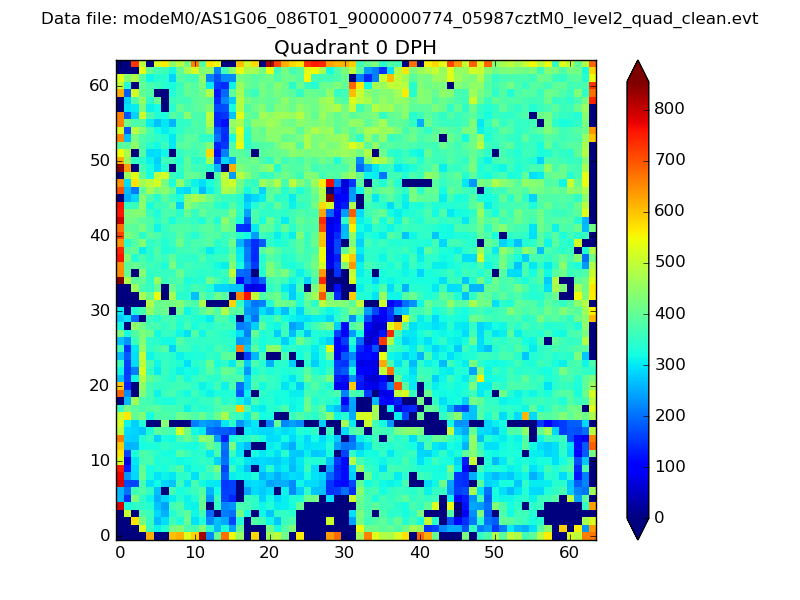 |
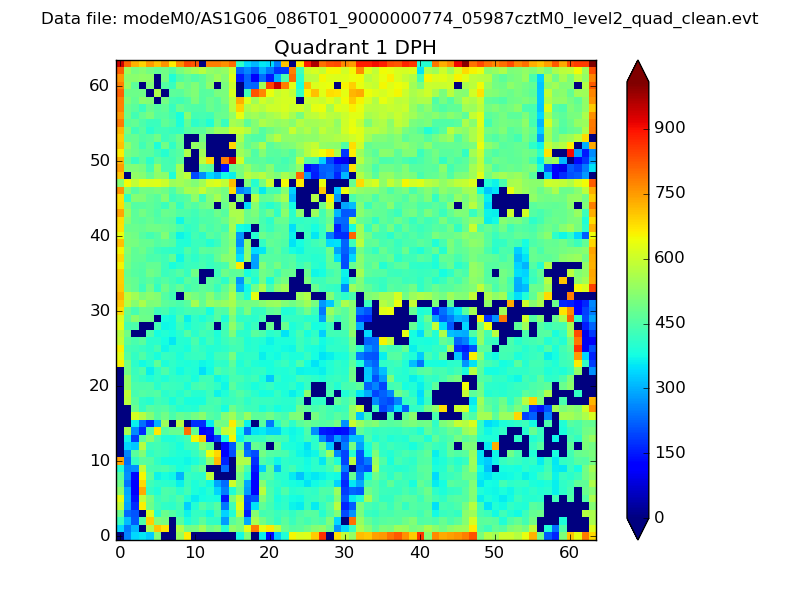 |
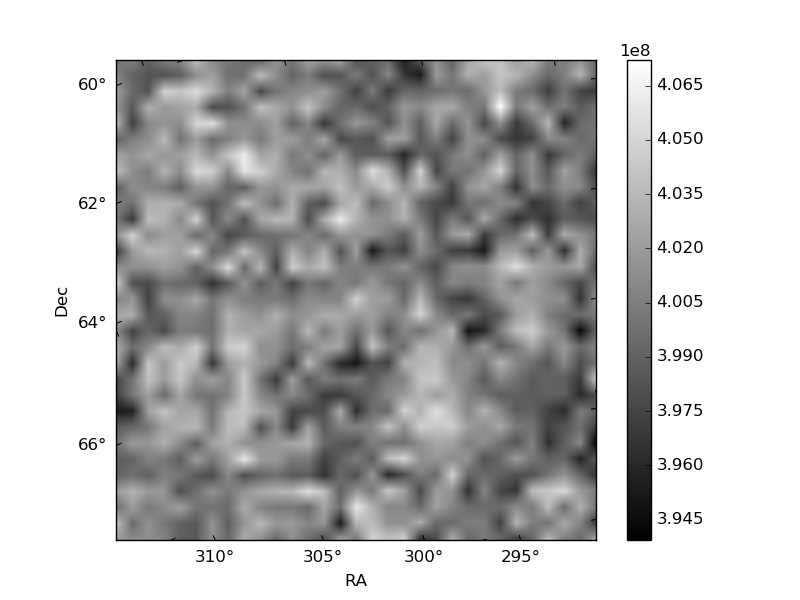
Quadrant B |
|---|---|---|---|
| Quadrant D | 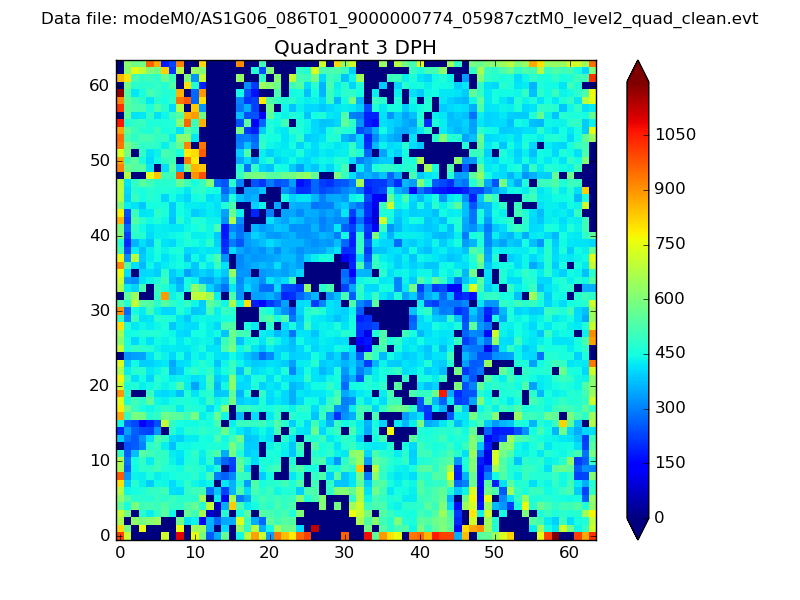 |
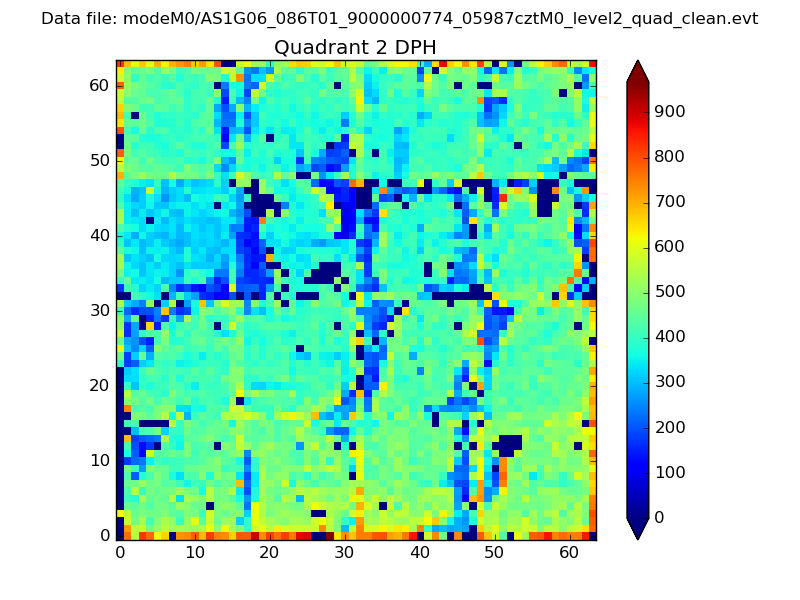 |
Quadrant C |
| Plot type | Count rate plots | Images |
|---|---|---|
| Comparison with Poisson distribution Blue bars denote a histogram of data divided into 1 sec bins. Red curve is a Poisson curve with rate = median count rate of data. |
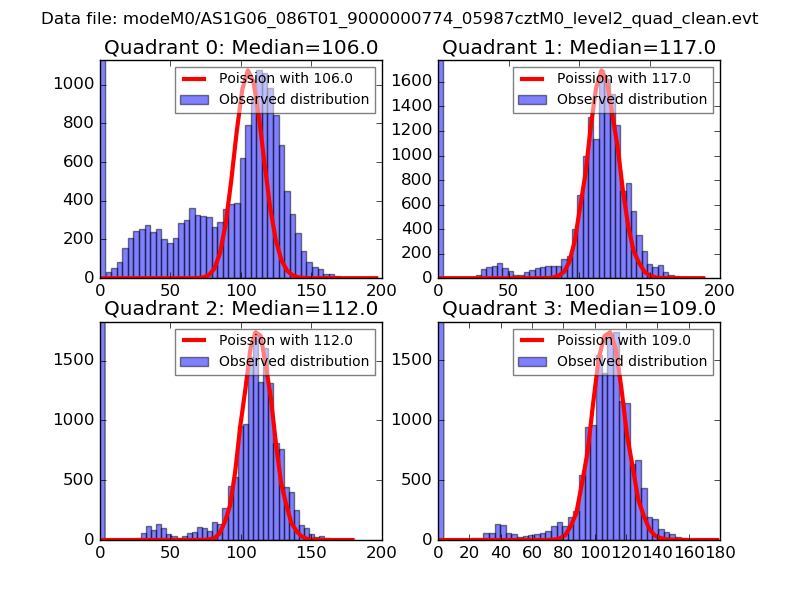 |
 |
| Quadrant-wise count rates Data is divided into 100 sec bins |
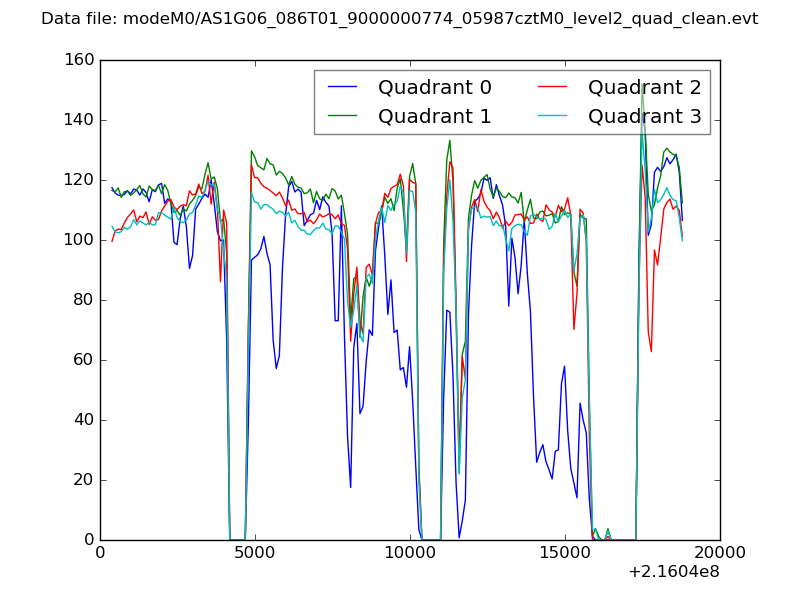 |
|
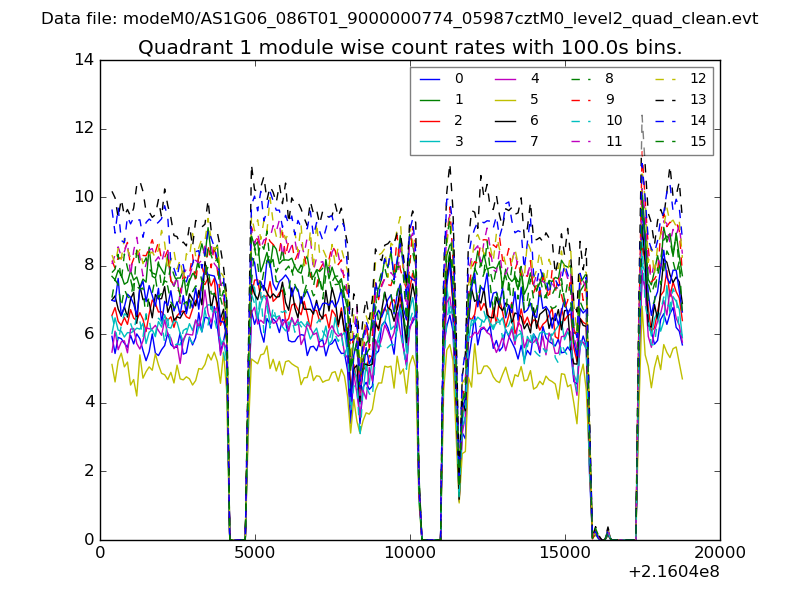
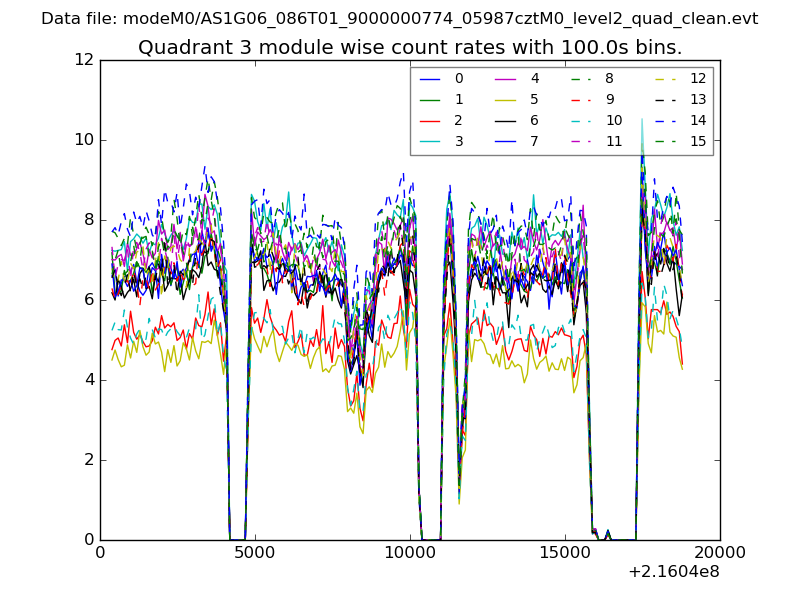
| Module-wise count rates for Quadrant A Data is divided into 100 sec bins |
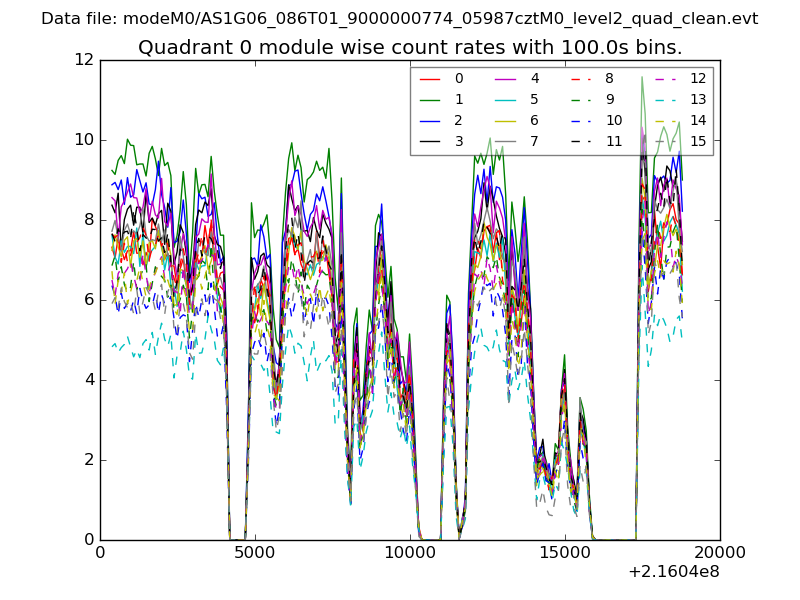 |
 |
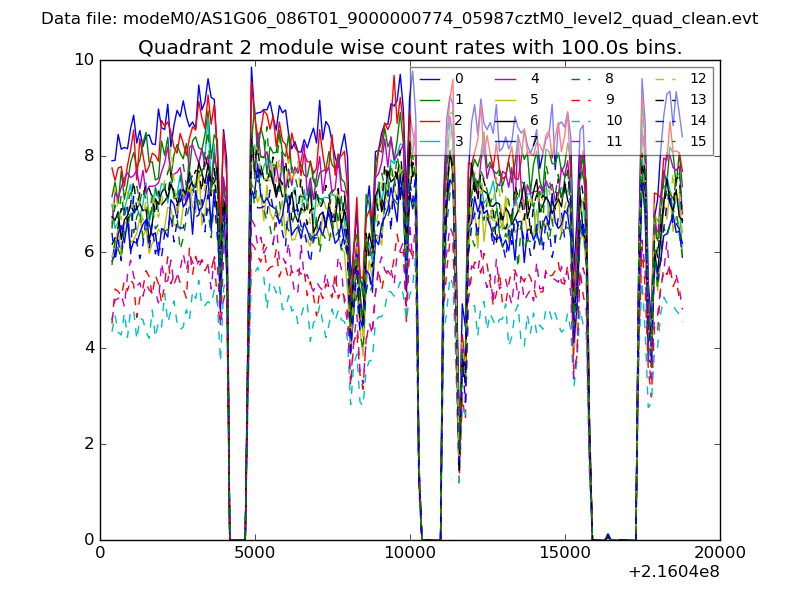
| Module-wise count rates for Quadrant B Data is divided into 100 sec bins |
 |
 |
| Module-wise count rates for Quadrant C Data is divided into 100 sec bins |
 |
 |
| Module-wise count rates for Quadrant D Data is divided into 100 sec bins |
 |
 |
| Parameter | Plot |
|---|---|
| CZT HV Monitor | 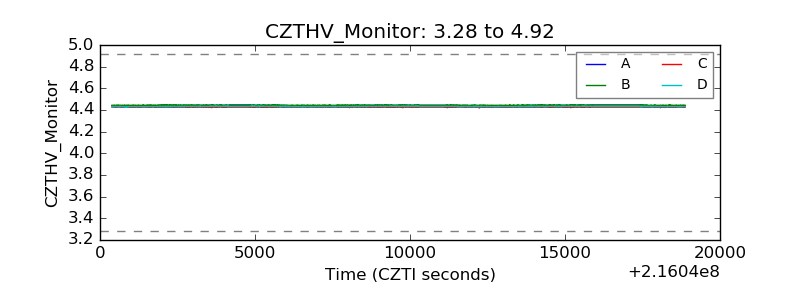 |
| D_VDD | 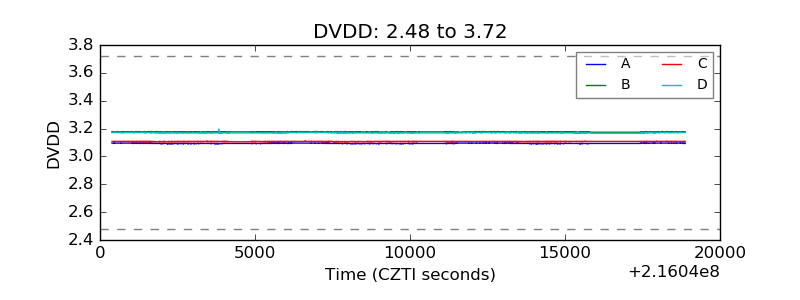 |
| Temperature 1 | 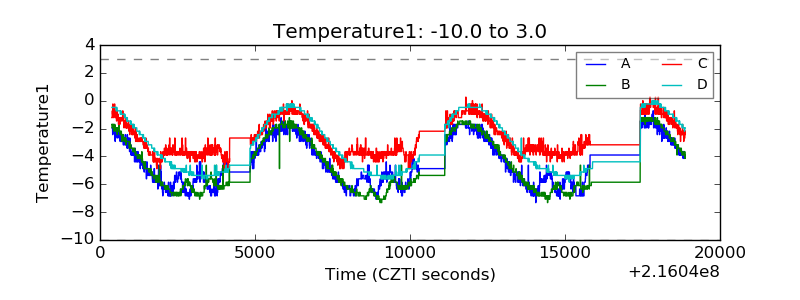 |
| Veto HV Monitor | 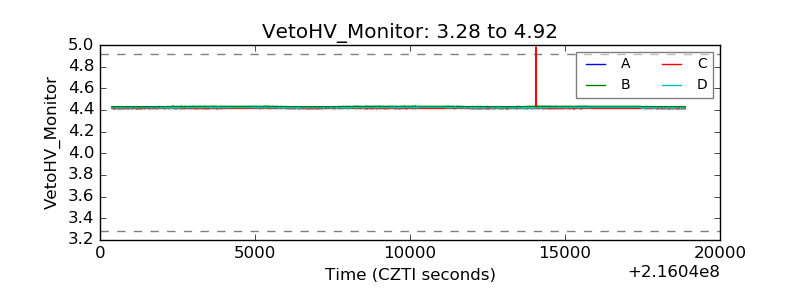 |
| Veto LLD | 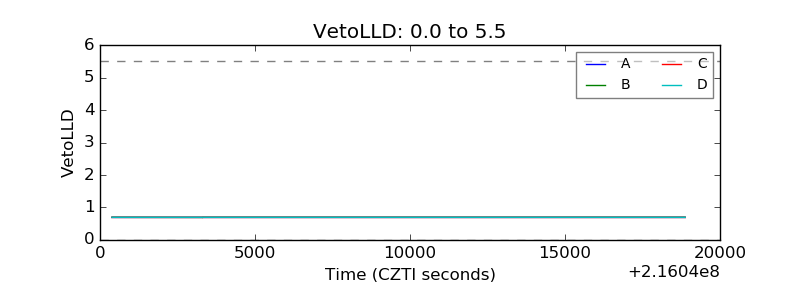 |
| Alpha Counter | 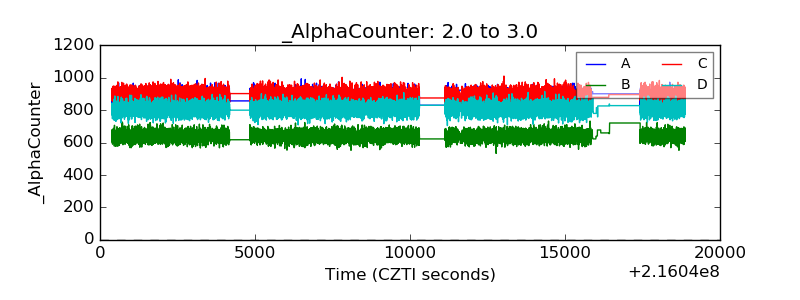 |
| _CPM_Rate | 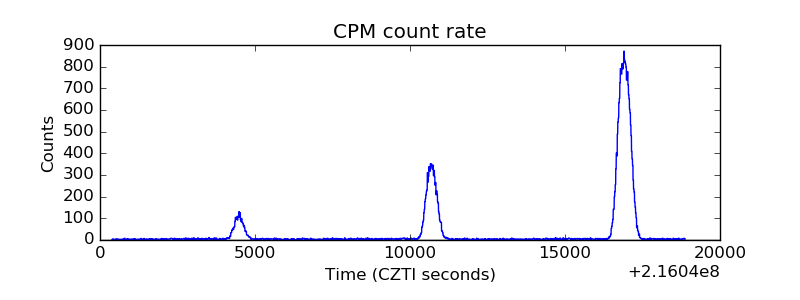 |
| CZT Counter | 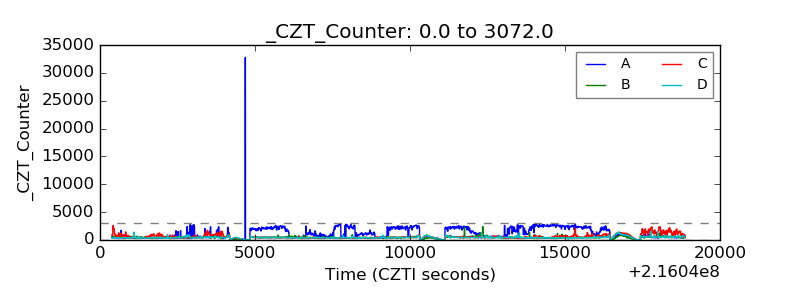 |
| +2.5 Volts monitor |  |
| +5 Volts monitor | 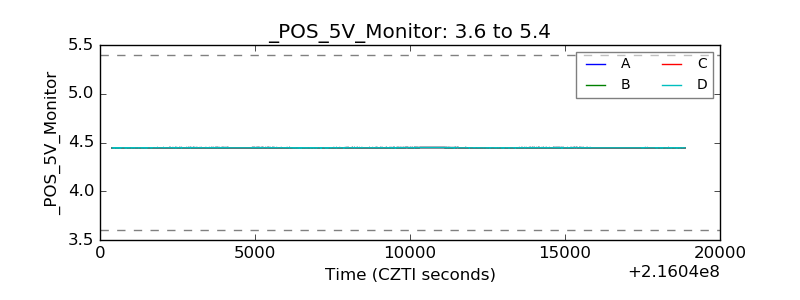 |
| _ROLL_ROT | 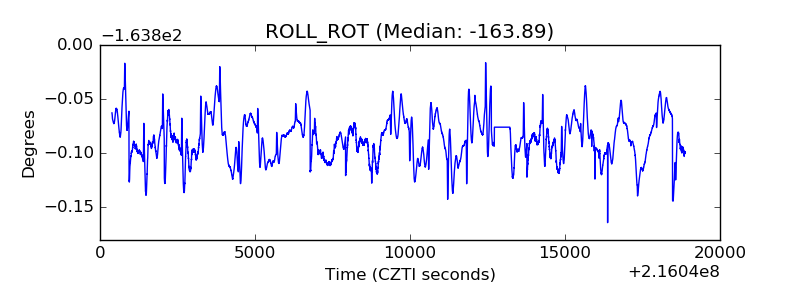 |
| _Roll_DEC | 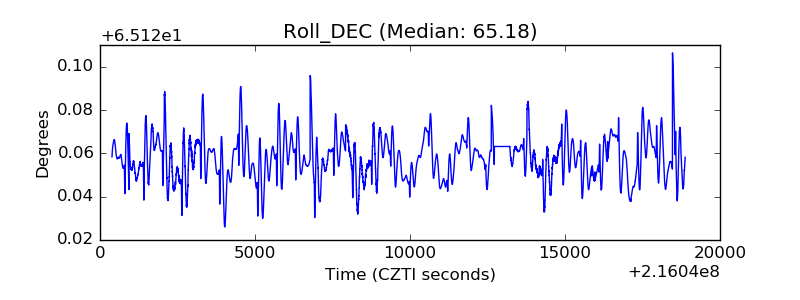 |
| _Roll_RA | 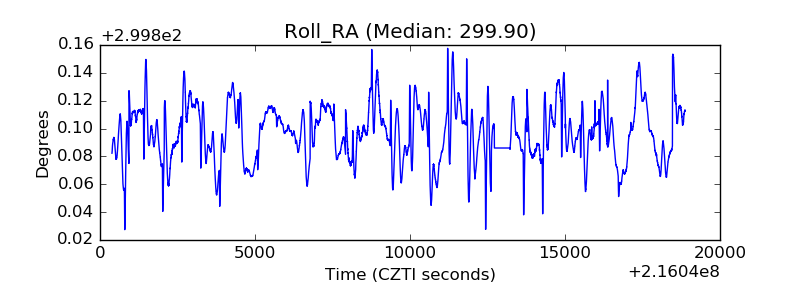 |
| Veto Counter | 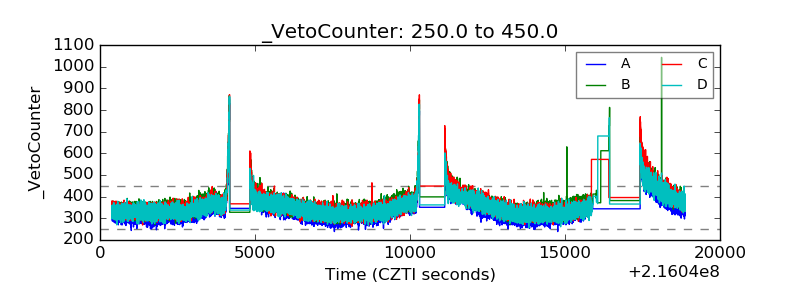 |