| Param | Original file | Final file |
|---|---|---|
| Filename | modeM0/AS1G06_086T01_9000000774_05989cztM0_level2.evt | modeM0/AS1G06_086T01_9000000774_05989cztM0_level2_quad_clean.evt |
| Size (bytes) | 548,375,040 | 112,795,200 |
| Size | 523.0 MB | 107.6 MB |
| Events in quadrant A | 4,043,076 | 736,208 |
| Events in quadrant B | 3,100,599 | 789,434 |
| Events in quadrant C | 5,764,172 | 724,178 |
| Events in quadrant D | 3,278,532 | 732,140 |
| Mode SS | |||
|---|---|---|---|
| Quadrant | BADHDUFLAG | Total packets | Discarded packets |
| A | 0 | 130 | 4 |
| B | 0 | 130 | 6 |
| C | 0 | 130 | 2 |
| D | 0 | 130 | 4 |
| Mode M9 | |||
|---|---|---|---|
| Quadrant | BADHDUFLAG | Total packets | Discarded packets |
| A | 0 | 13 | 0 |
| B | 0 | 13 | 0 |
| C | 0 | 13 | 0 |
| D | 0 | 14 | 0 |
| Mode M0 | |||
|---|---|---|---|
| Quadrant | BADHDUFLAG | Total packets | Discarded packets |
| A | 0 | 17149 | 746 |
| B | 0 | 14064 | 587 |
| C | 0 | 23054 | 1656 |
| D | 0 | 14735 | 737 |
| Quadrant | Total seconds | Saturated seconds | Saturation percentage |
|---|---|---|---|
| A | 6242 | 416 | 6.664531% |
| B | 6252 | 23 | 0.367882% |
| C | 6124 | 328 | 5.355976% |
| D | 6237 | 29 | 0.464967% |
Noise dominated data is calculated using 1-second bins in cleaned event files. If a bin has >2000 counts, and if more than 50% of those come from <1% of pixels, then it is considered to be noise-dominated and hence unusable.
| Quadrant | # 1 sec bins | Bins with >0 counts | Bins with >2000 counts | High rate bins dominated by noise | Noise dominated (total time) | Noise dominated (detector-on time) | Marked lightcurve |
|---|---|---|---|---|---|---|---|
| A | 7641 | 6434 | 381 | 381 | 4.99% | 5.92% |  |
| B | 7641 | 6451 | 1 | 1 | 0.01% | 0.02% |  |
| C | 7641 | 6368 | 221 | 221 | 2.89% | 3.47% | 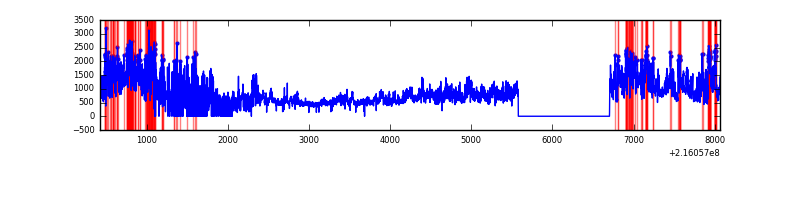 |
| D | 7641 | 6435 | 4 | 4 | 0.05% | 0.06% | 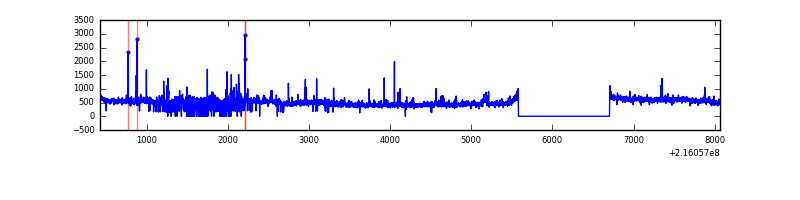 |
Top three noisy pixels from each quadrant. If the there are fewer than three noisy pixels in the level2.evt file, extra rows are filled as -1
| Pixel properties | Quadrant properties | ||||||
|---|---|---|---|---|---|---|---|
| Quadrant | DetID | PixID | Counts | Sigma | Mean | Median | Sigma |
| A | 15 | 236 | 984378 | 7022.9 | 692 | 677 | 140.1 |
| A | 4 | 2 | 335173 | 2388.06 | 692 | 677 | 140.1 |
| A | 15 | 234 | 37398 | 262.16 | 692 | 677 | 140.1 |
| B | 15 | 204 | 115087 | 830.28 | 731 | 715 | 137.8 |
| B | 4 | 48 | 38906 | 277.24 | 731 | 715 | 137.8 |
| B | 0 | 214 | 35485 | 252.41 | 731 | 715 | 137.8 |
| C | 1 | 241 | 3078479 | 19409.32 | 684 | 689 | 158.6 |
| C | 1 | 16 | 6183 | 34.65 | 684 | 689 | 158.6 |
| C | 13 | 61 | 5367 | 29.5 | 684 | 689 | 158.6 |
| D | 1 | 239 | 401937 | 2356.66 | 701 | 677 | 170.3 |
| D | 2 | 63 | 135877 | 794.05 | 701 | 677 | 170.3 |
| D | 8 | 195 | 37420 | 215.8 | 701 | 677 | 170.3 |
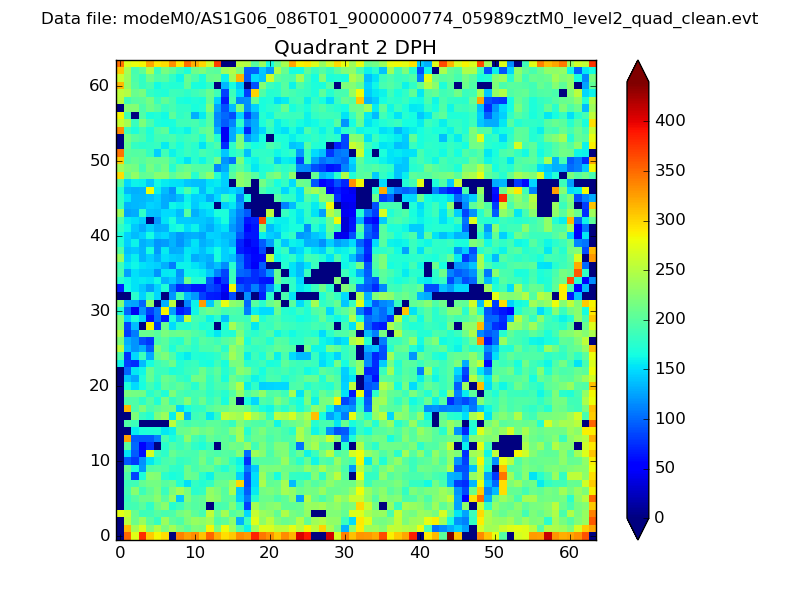
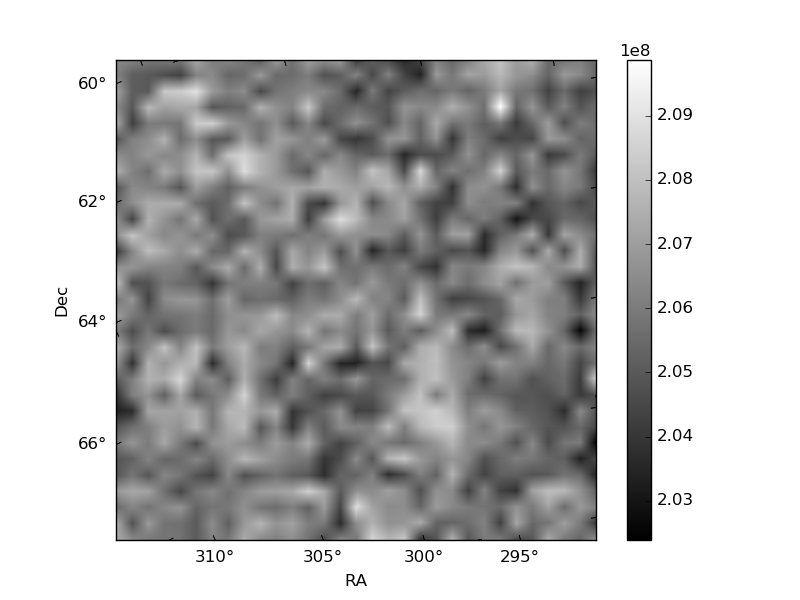
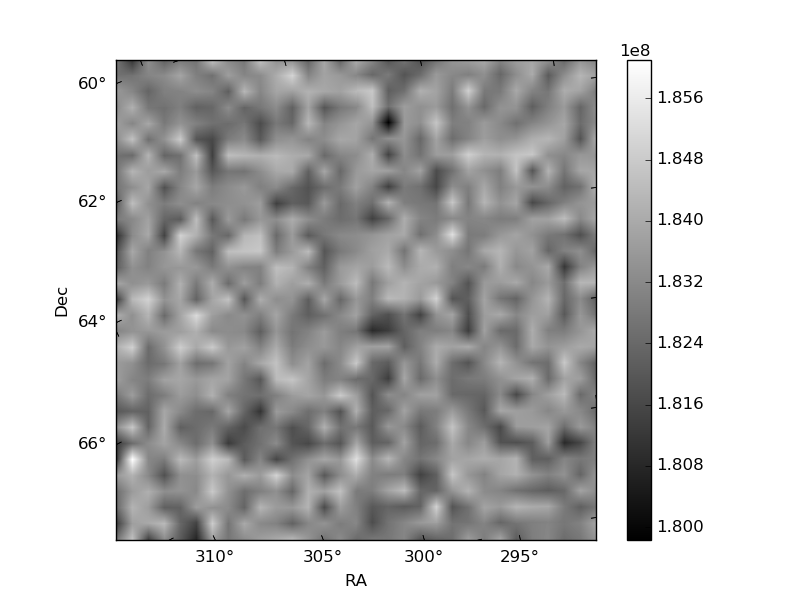
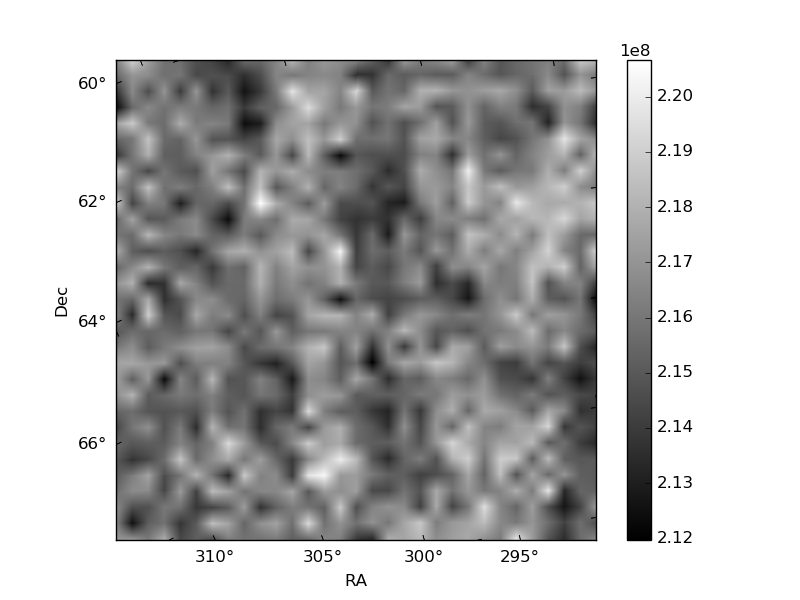
Histogram calculated using DETX and DETY for each event in the final _common_clean file
| Quadrant A | 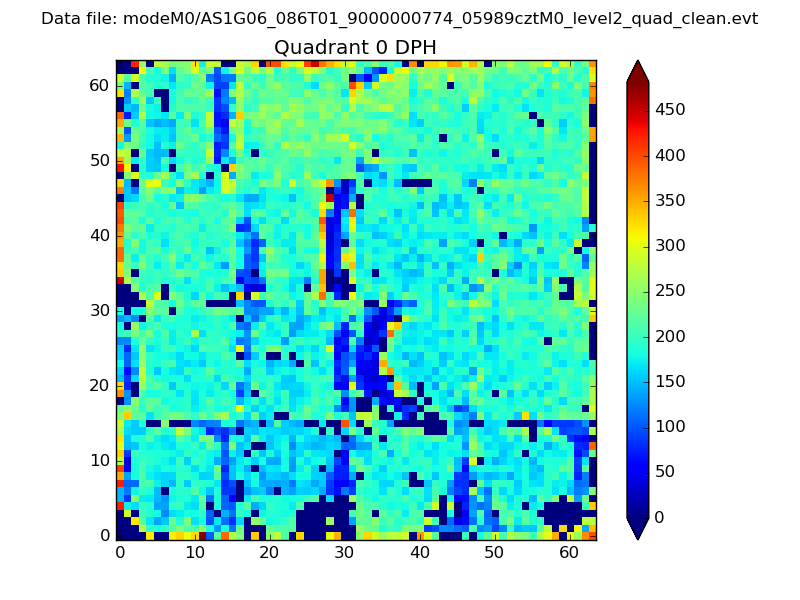 |
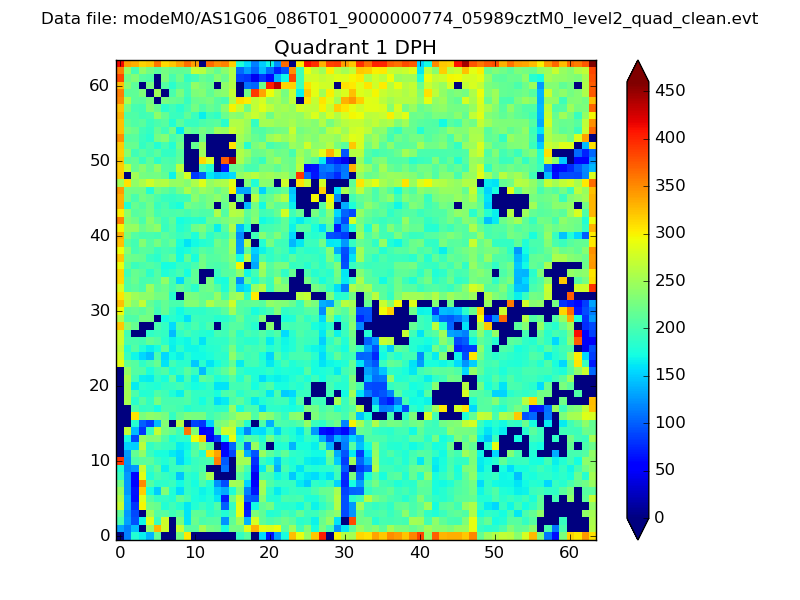 |
Quadrant B |
|---|---|---|---|
| Quadrant D | 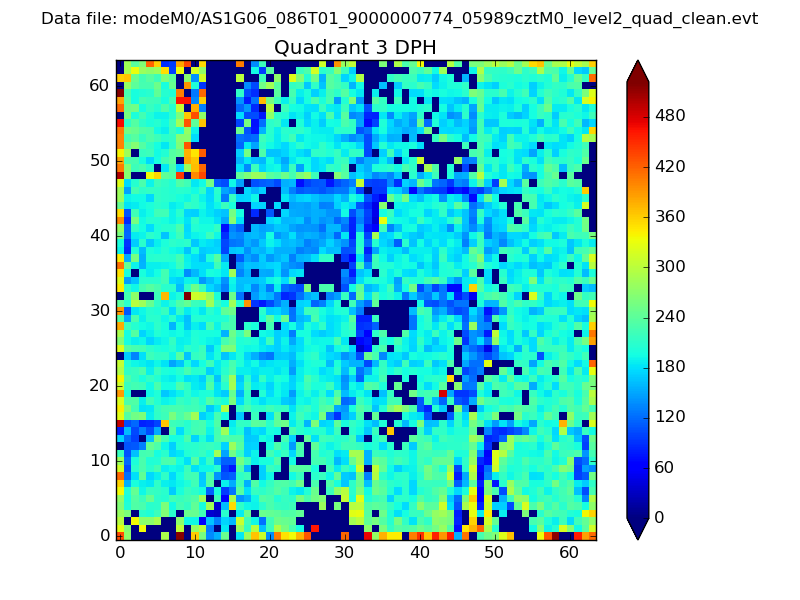 |
 |
Quadrant C |
| Plot type | Count rate plots | Images |
|---|---|---|
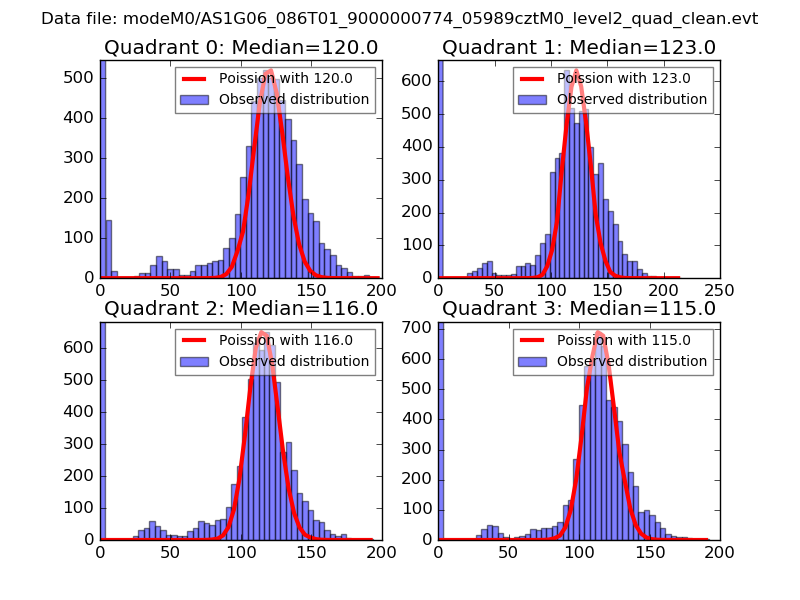
| Comparison with Poisson distribution Blue bars denote a histogram of data divided into 1 sec bins. Red curve is a Poisson curve with rate = median count rate of data. |
 |
 |
| Quadrant-wise count rates Data is divided into 100 sec bins |
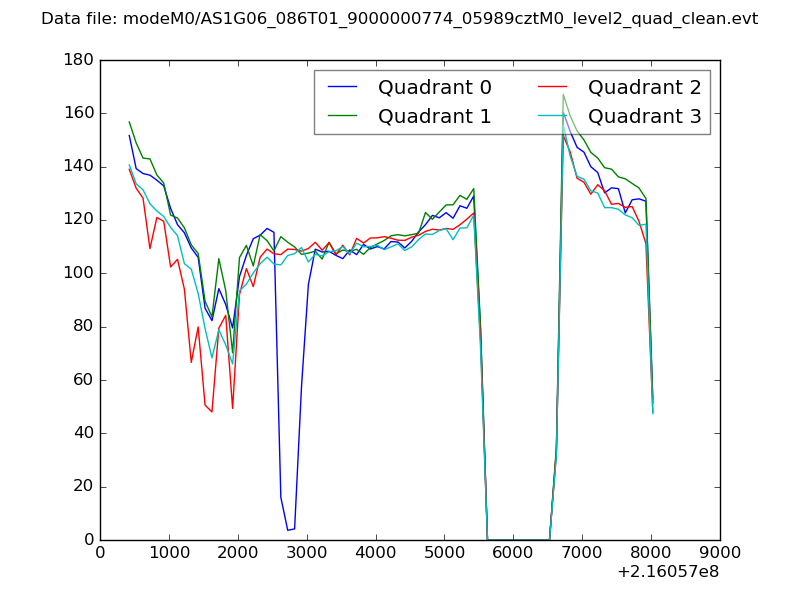 |
|
| Module-wise count rates for Quadrant A Data is divided into 100 sec bins |
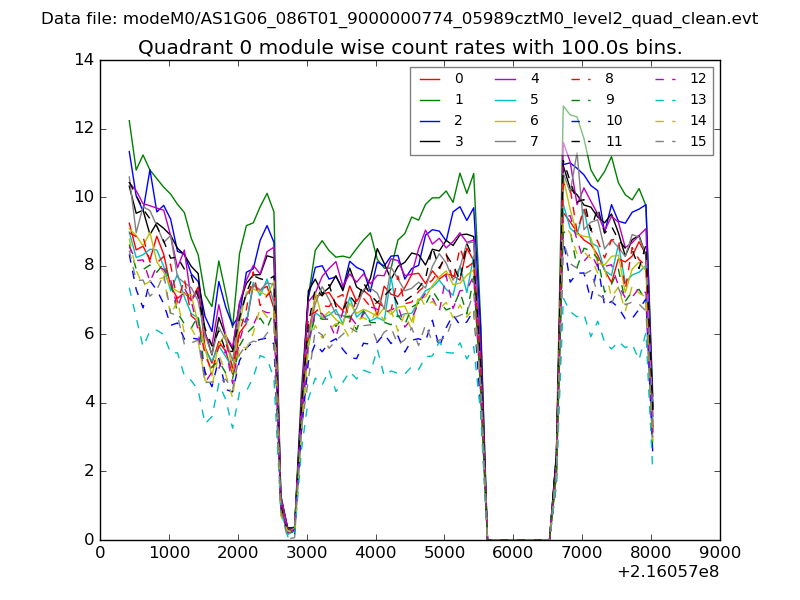 |
 |
| Module-wise count rates for Quadrant B Data is divided into 100 sec bins |
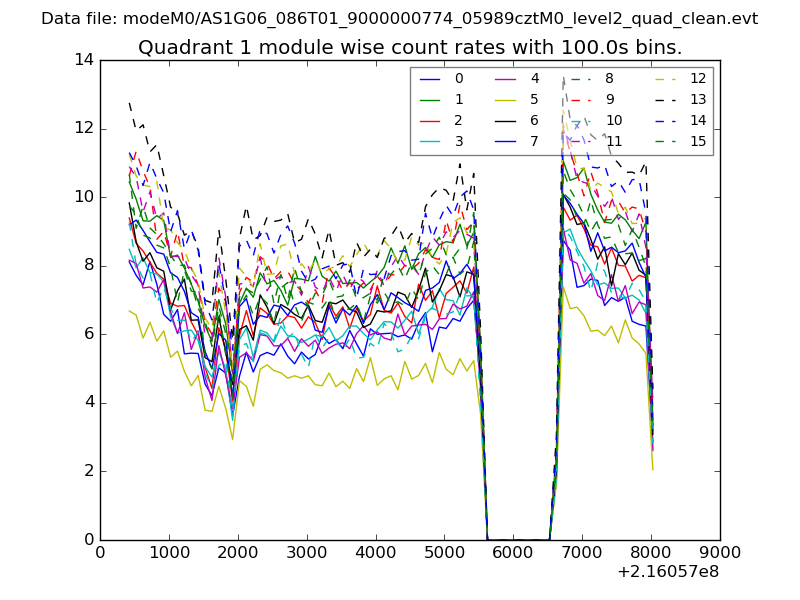 |
 |
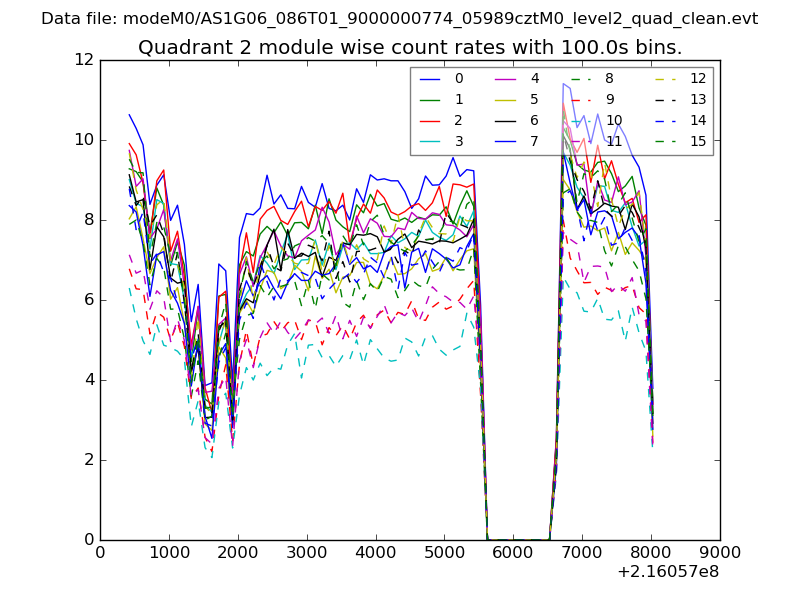
| Module-wise count rates for Quadrant C Data is divided into 100 sec bins |
 |
 |
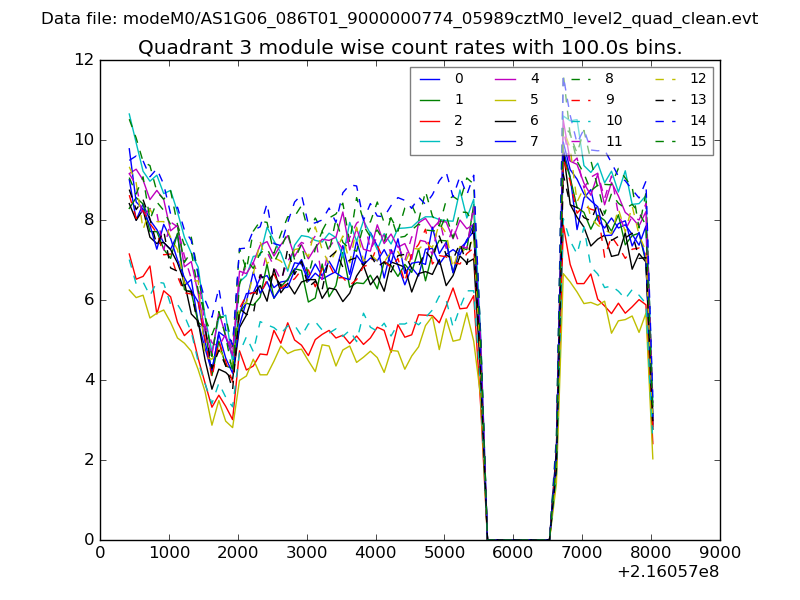
| Module-wise count rates for Quadrant D Data is divided into 100 sec bins |
 |
 |
| Parameter | Plot |
|---|---|
| CZT HV Monitor | 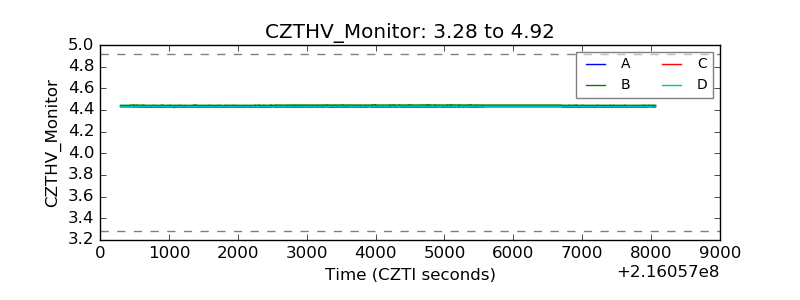 |
| D_VDD | 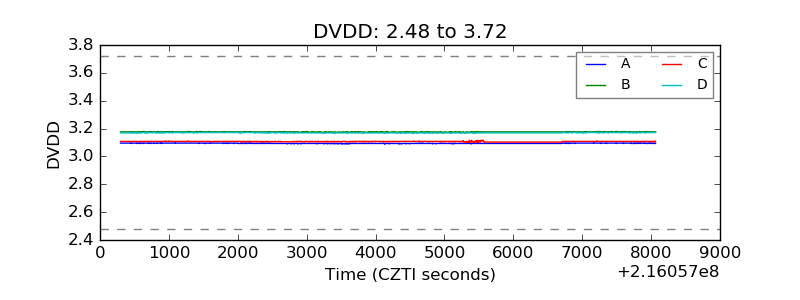 |
| Temperature 1 | 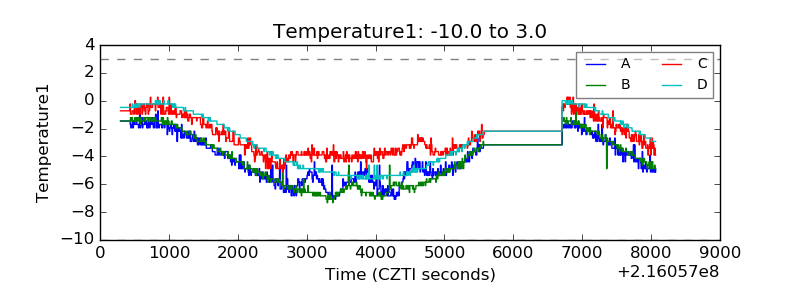 |
| Veto HV Monitor |  |
| Veto LLD | 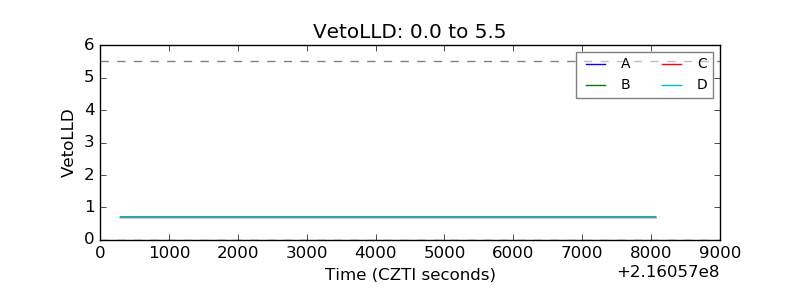 |
| Alpha Counter | 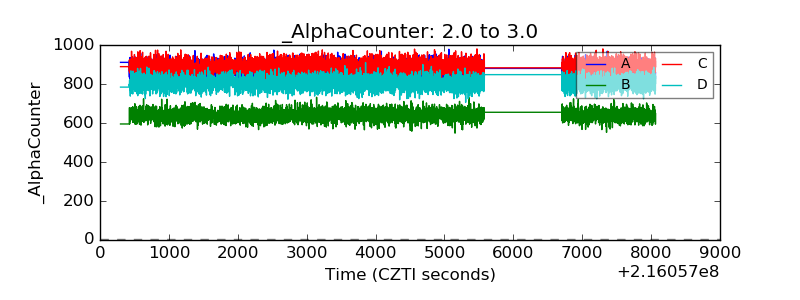 |
| _CPM_Rate | 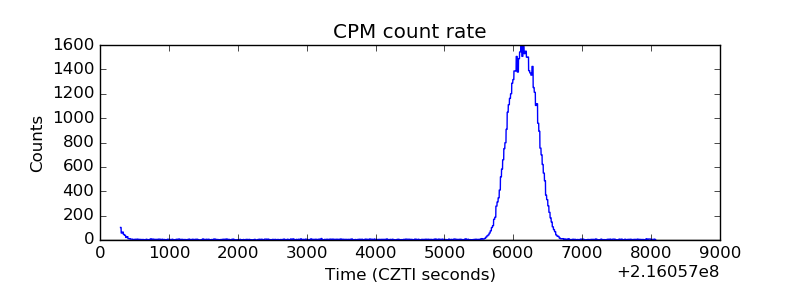 |
| CZT Counter | 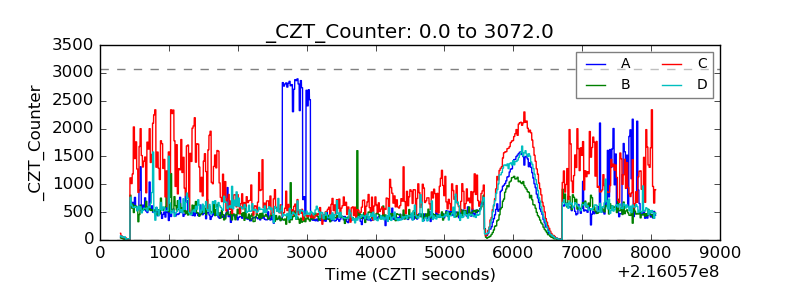 |
| +2.5 Volts monitor |  |
| +5 Volts monitor |  |
| _ROLL_ROT | 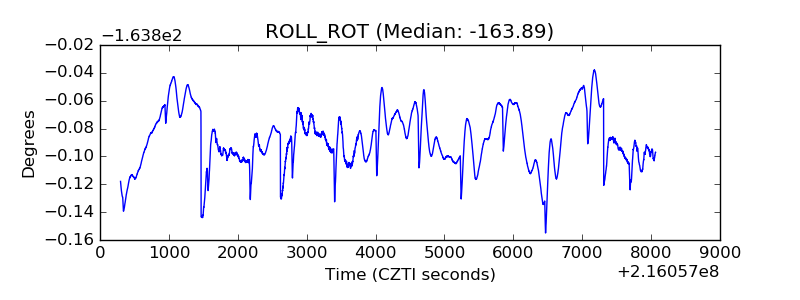 |
| _Roll_DEC | 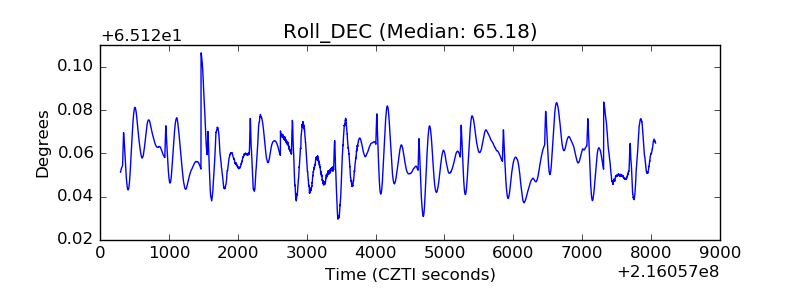 |
| _Roll_RA | 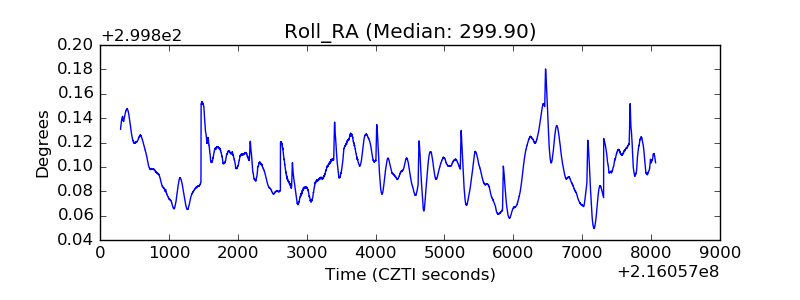 |
| Veto Counter | 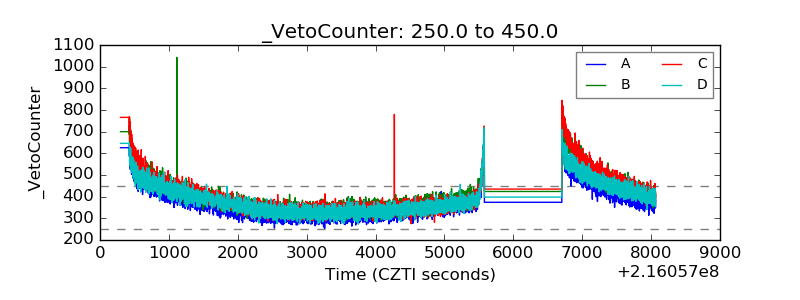 |