| Param | Original file | Final file |
|---|---|---|
| Filename | modeM0/AS1G06_086T01_9000000774_05991cztM0_level2.evt | modeM0/AS1G06_086T01_9000000774_05991cztM0_level2_quad_clean.evt |
| Size (bytes) | 503,576,640 | 122,356,800 |
| Size | 480.2 MB | 116.7 MB |
| Events in quadrant A | 3,153,419 | 818,630 |
| Events in quadrant B | 3,241,757 | 855,364 |
| Events in quadrant C | 5,323,040 | 804,404 |
| Events in quadrant D | 3,101,404 | 783,739 |
| Mode SS | |||
|---|---|---|---|
| Quadrant | BADHDUFLAG | Total packets | Discarded packets |
| A | 0 | 128 | 0 |
| B | 0 | 128 | 0 |
| C | 0 | 128 | 0 |
| D | 0 | 128 | 0 |
| Mode M9 | |||
|---|---|---|---|
| Quadrant | BADHDUFLAG | Total packets | Discarded packets |
| A | 0 | 18 | 0 |
| B | 0 | 18 | 0 |
| C | 0 | 18 | 0 |
| D | 0 | 19 | 0 |
| Mode M0 | |||
|---|---|---|---|
| Quadrant | BADHDUFLAG | Total packets | Discarded packets |
| A | 0 | 13677 | 3 |
| B | 0 | 14024 | 4 |
| C | 0 | 20331 | 2 |
| D | 0 | 13898 | 2 |
| Quadrant | Total seconds | Saturated seconds | Saturation percentage |
|---|---|---|---|
| A | 6361 | 58 | 0.911806% |
| B | 6360 | 43 | 0.676101% |
| C | 6361 | 301 | 4.731960% |
| D | 6361 | 33 | 0.518786% |
Noise dominated data is calculated using 1-second bins in cleaned event files. If a bin has >2000 counts, and if more than 50% of those come from <1% of pixels, then it is considered to be noise-dominated and hence unusable.
| Quadrant | # 1 sec bins | Bins with >0 counts | Bins with >2000 counts | High rate bins dominated by noise | Noise dominated (total time) | Noise dominated (detector-on time) | Marked lightcurve |
|---|---|---|---|---|---|---|---|
| A | 7636 | 6362 | 31 | 31 | 0.41% | 0.49% | 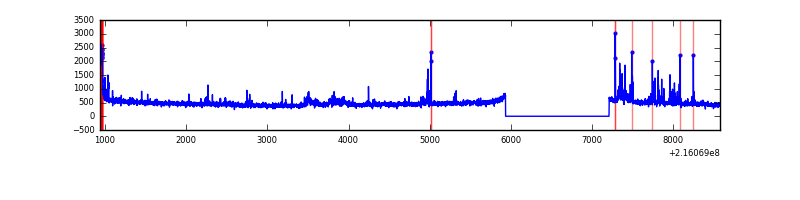 |
| B | 7636 | 6362 | 4 | 4 | 0.05% | 0.06% | 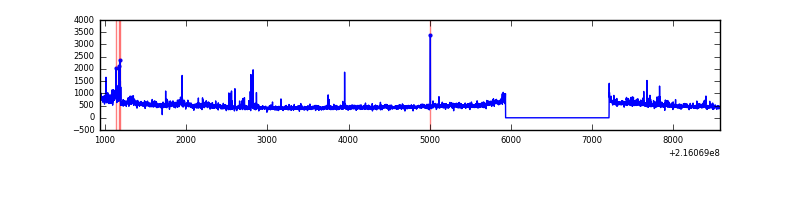 |
| C | 7636 | 6362 | 181 | 181 | 2.37% | 2.85% | 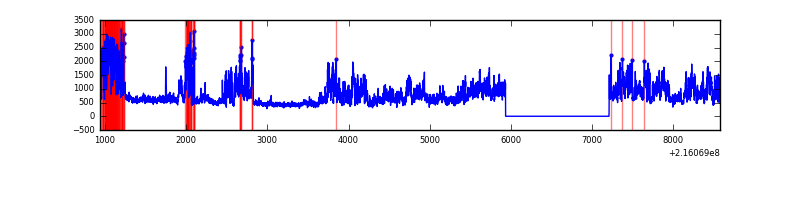 |
| D | 7636 | 6362 | 7 | 7 | 0.09% | 0.11% |  |
Top three noisy pixels from each quadrant. If the there are fewer than three noisy pixels in the level2.evt file, extra rows are filled as -1
| Pixel properties | Quadrant properties | ||||||
|---|---|---|---|---|---|---|---|
| Quadrant | DetID | PixID | Counts | Sigma | Mean | Median | Sigma |
| A | 14 | 238 | 118887 | 794.66 | 737 | 723 | 148.7 |
| A | 15 | 234 | 99841 | 666.57 | 737 | 723 | 148.7 |
| A | 13 | 251 | 36201 | 238.59 | 737 | 723 | 148.7 |
| B | 15 | 204 | 105106 | 727.22 | 763 | 746 | 143.5 |
| B | 0 | 219 | 54405 | 373.92 | 763 | 746 | 143.5 |
| B | 4 | 81 | 38928 | 266.07 | 763 | 746 | 143.5 |
| C | 1 | 241 | 2474044 | 14863.17 | 727 | 731 | 166.4 |
| C | 14 | 206 | 8553 | 47.01 | 727 | 731 | 166.4 |
| C | 13 | 61 | 5774 | 30.31 | 727 | 731 | 166.4 |
| D | 1 | 239 | 269397 | 1523.82 | 726 | 703 | 176.3 |
| D | 2 | 14 | 39576 | 220.46 | 726 | 703 | 176.3 |
| D | 13 | 172 | 20584 | 112.75 | 726 | 703 | 176.3 |
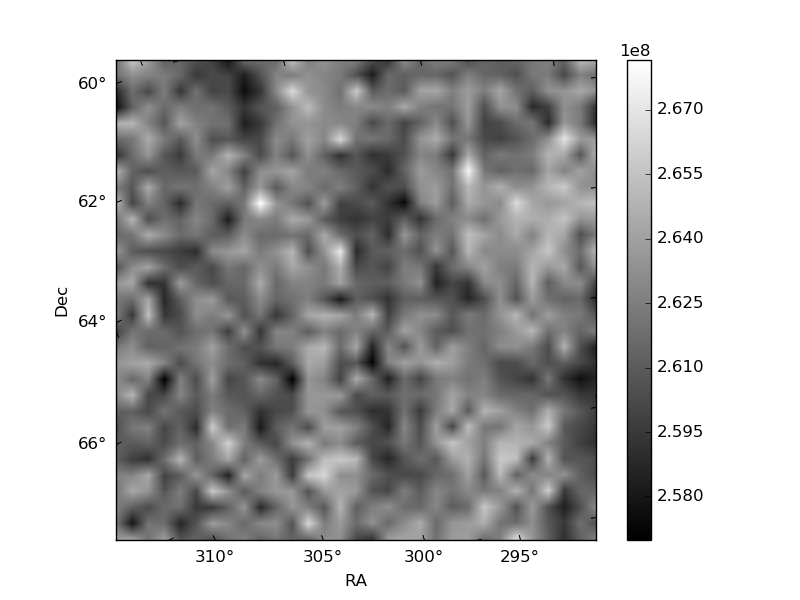
Histogram calculated using DETX and DETY for each event in the final _common_clean file
| Quadrant A | 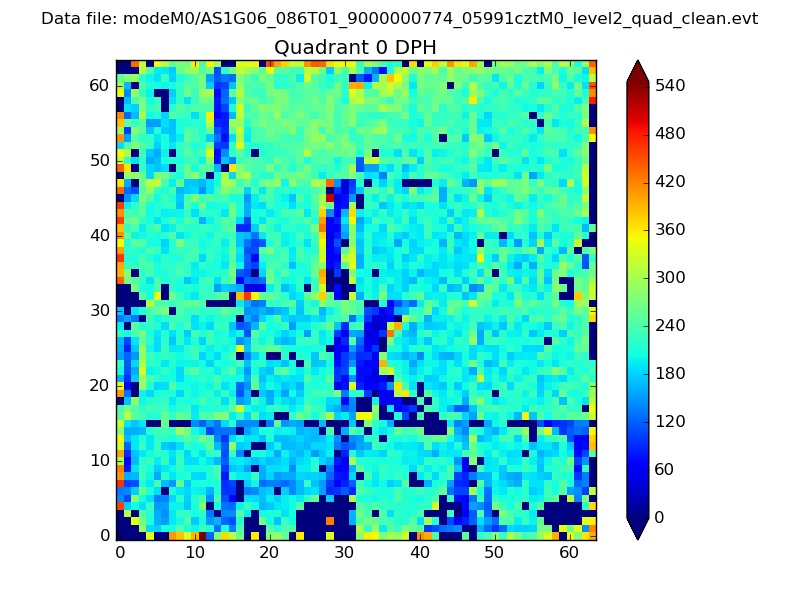 |
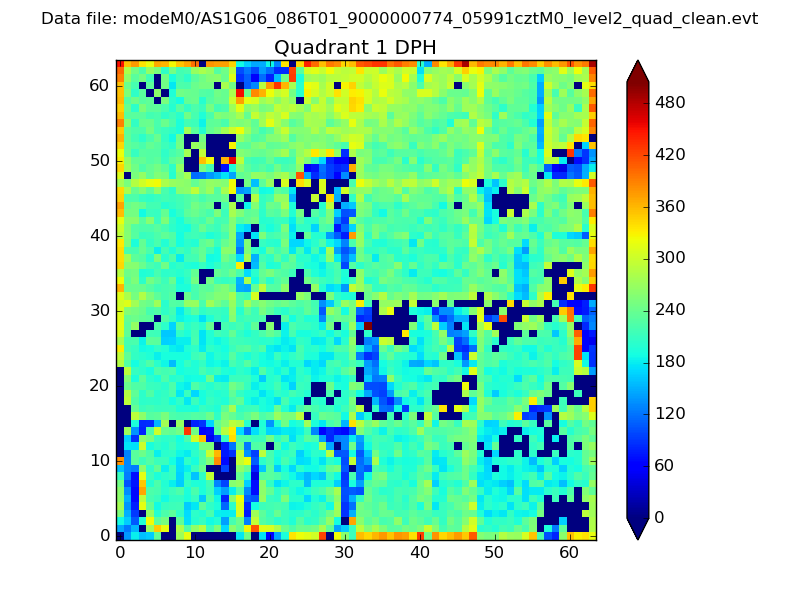 |
Quadrant B |
|---|---|---|---|
| Quadrant D | 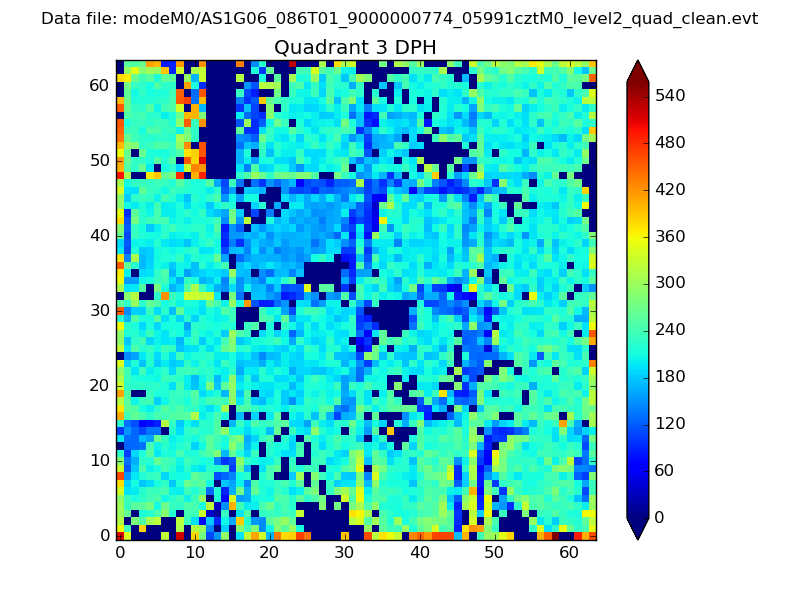 |
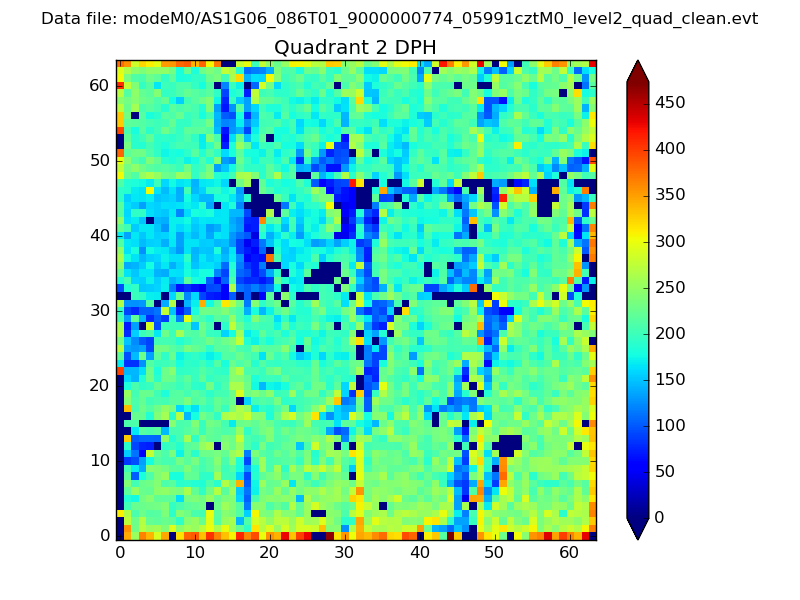 |
Quadrant C |
| Plot type | Count rate plots | Images |
|---|---|---|
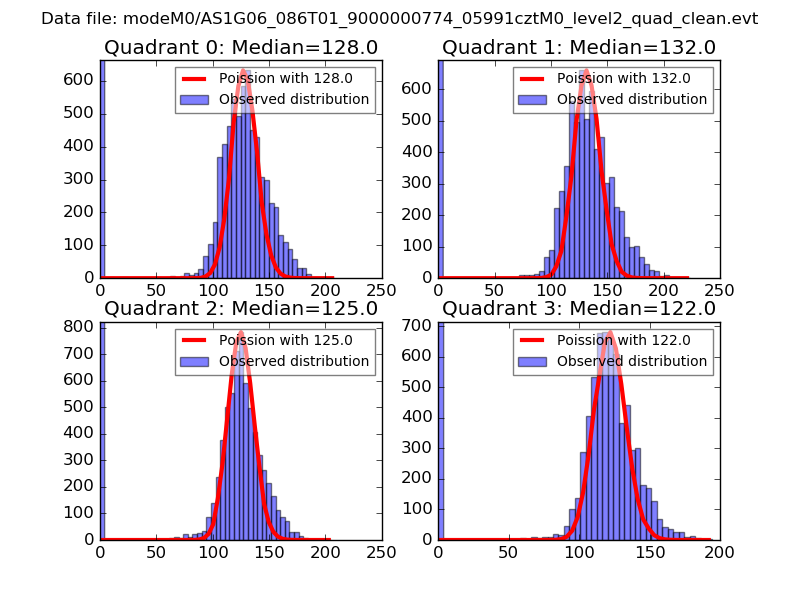
| Comparison with Poisson distribution Blue bars denote a histogram of data divided into 1 sec bins. Red curve is a Poisson curve with rate = median count rate of data. |
 |
 |
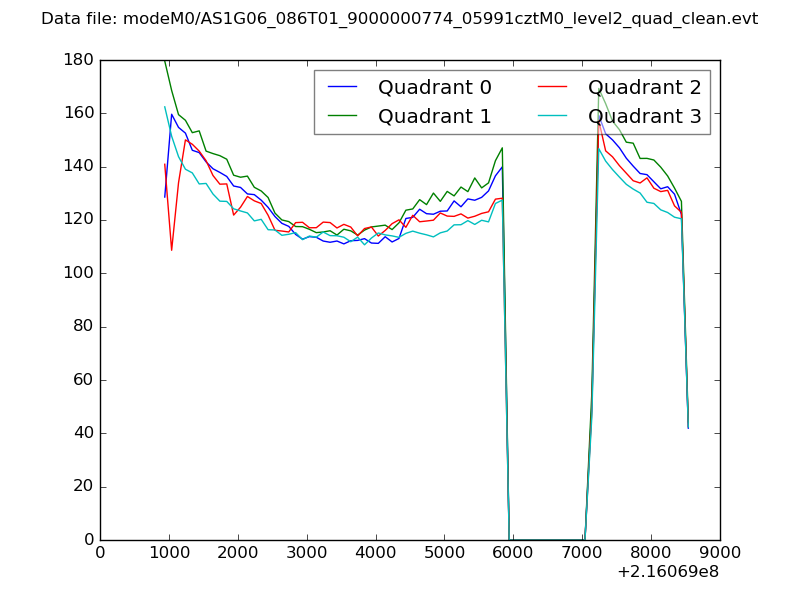
| Quadrant-wise count rates Data is divided into 100 sec bins |
 |
|
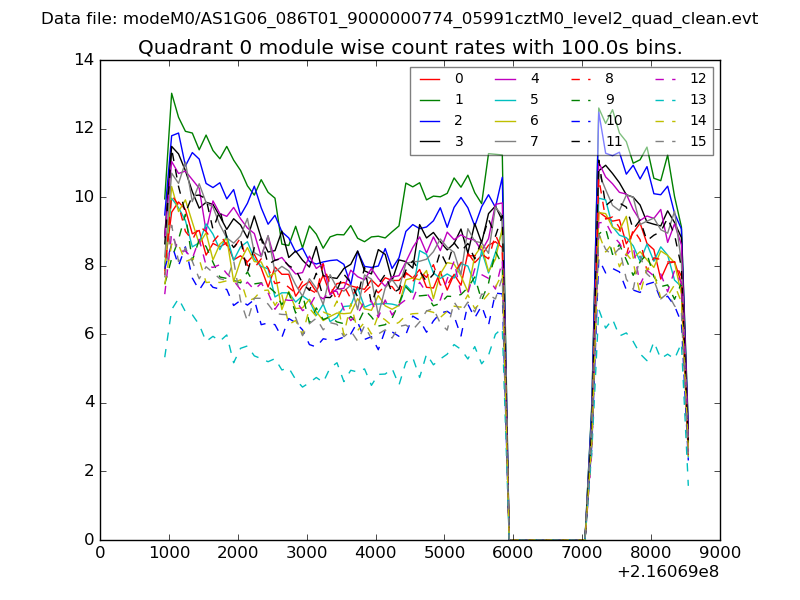
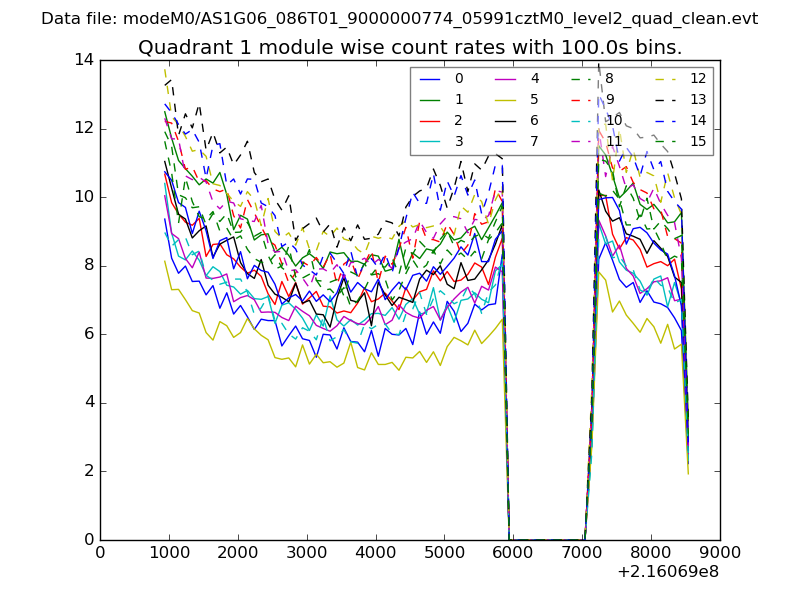
| Module-wise count rates for Quadrant A Data is divided into 100 sec bins |
 |
 |
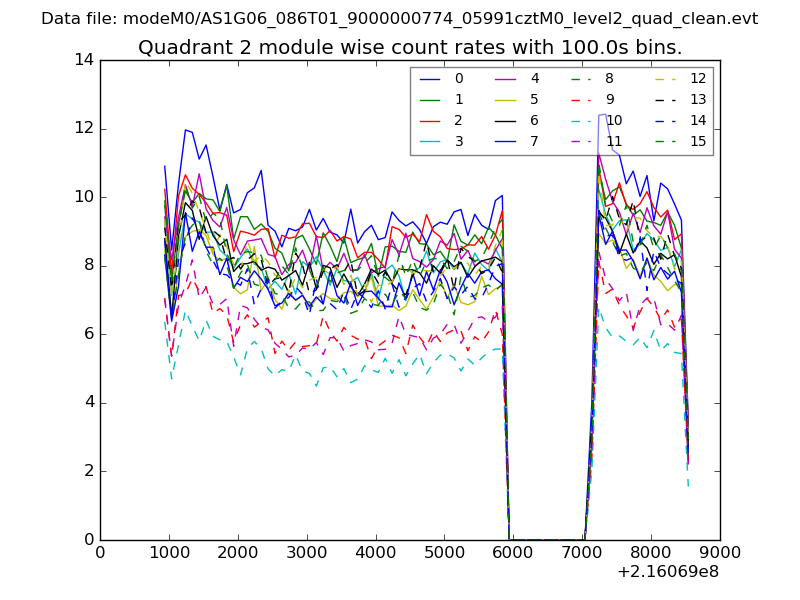
| Module-wise count rates for Quadrant B Data is divided into 100 sec bins |
 |
 |
| Module-wise count rates for Quadrant C Data is divided into 100 sec bins |
 |
 |
| Module-wise count rates for Quadrant D Data is divided into 100 sec bins |
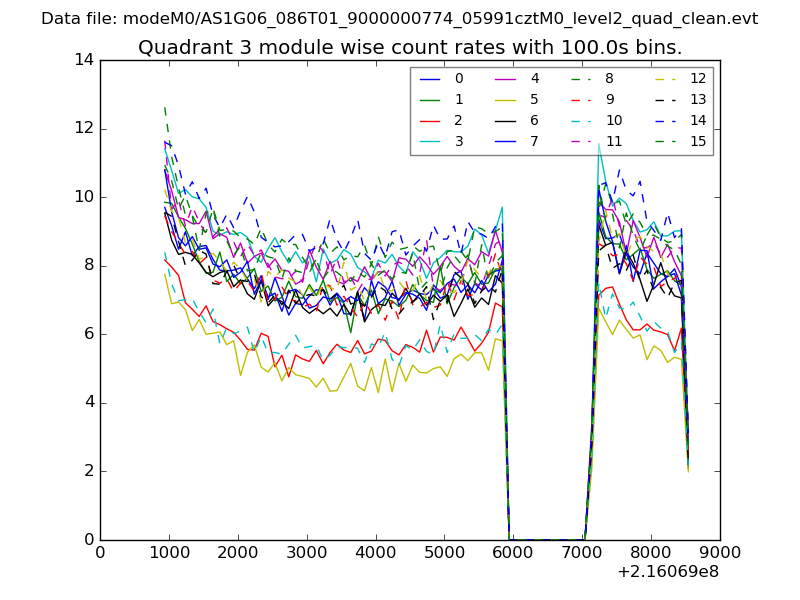 |
 |
| Parameter | Plot |
|---|---|
| CZT HV Monitor | 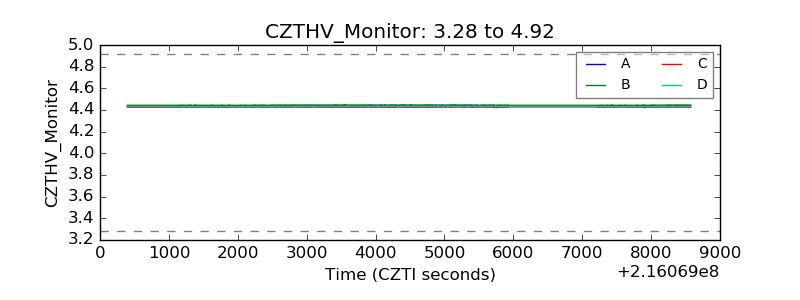 |
| D_VDD | 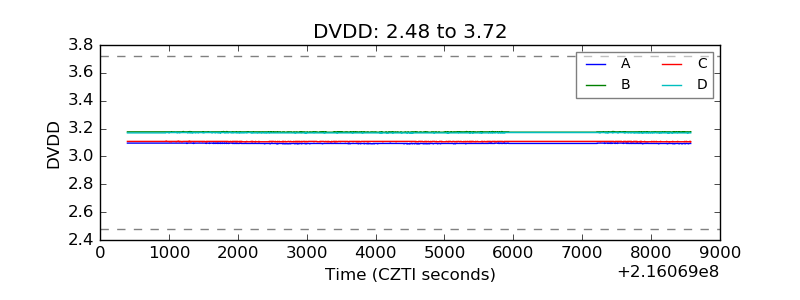 |
| Temperature 1 | 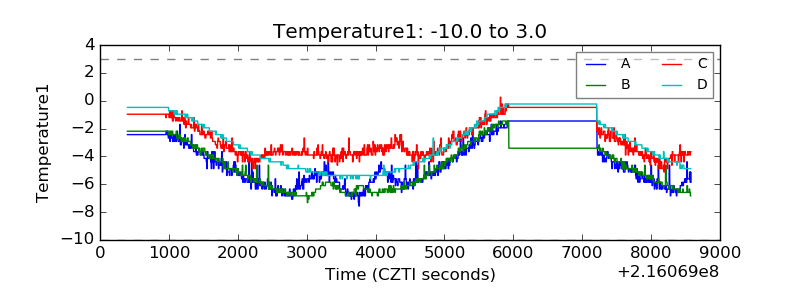 |
| Veto HV Monitor | 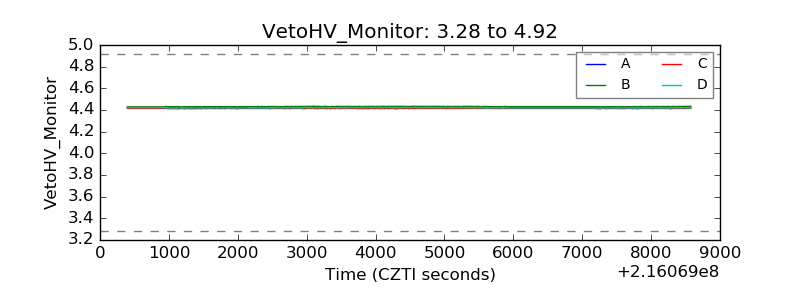 |
| Veto LLD | 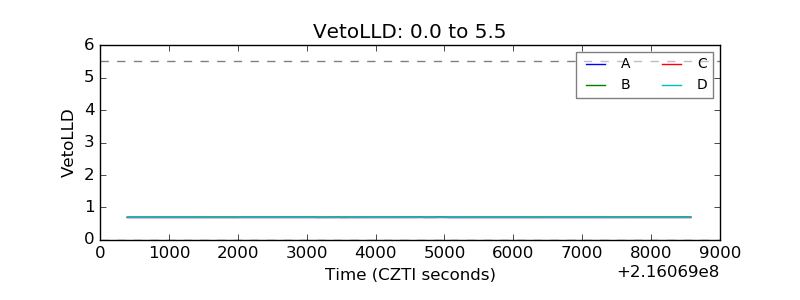 |
| Alpha Counter | 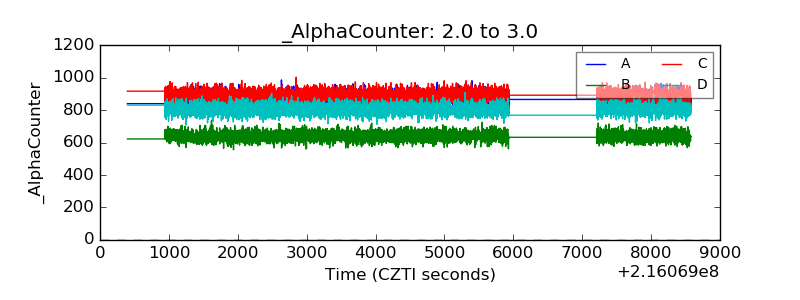 |
| _CPM_Rate | 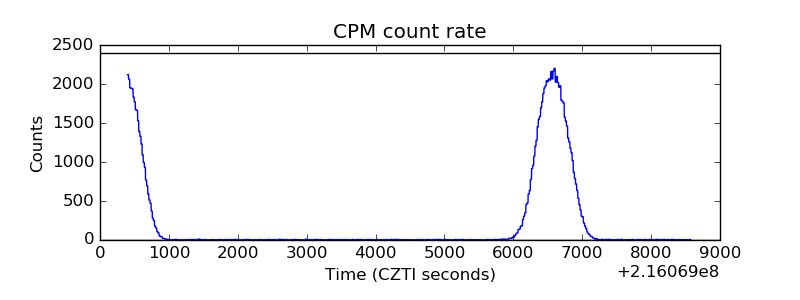 |
| CZT Counter | 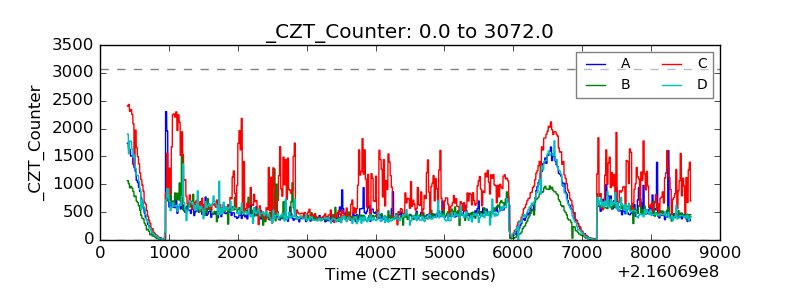 |
| +2.5 Volts monitor | 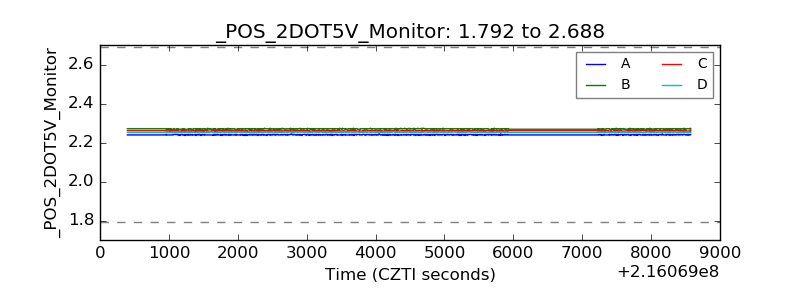 |
| +5 Volts monitor |  |
| _ROLL_ROT | 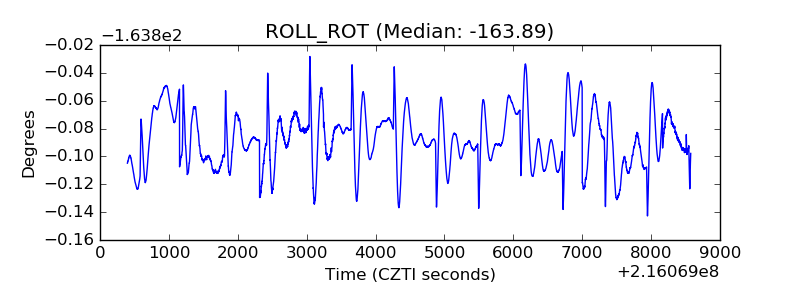 |
| _Roll_DEC | 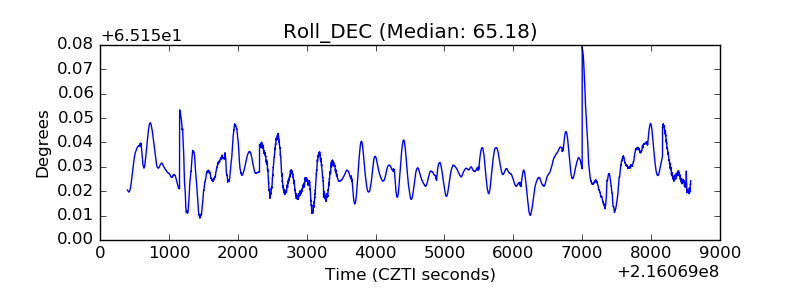 |
| _Roll_RA | 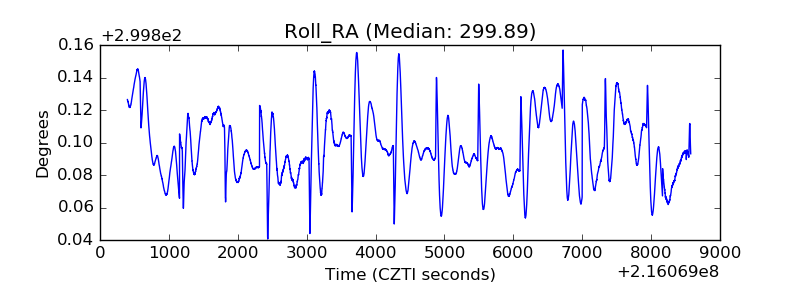 |
| Veto Counter | 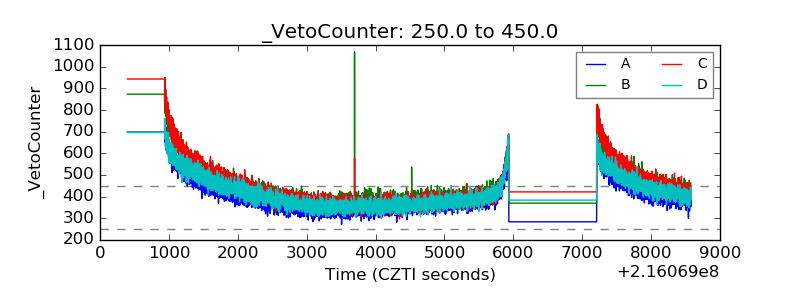 |