| Param | Original file | Final file |
|---|---|---|
| Filename | modeM0/AS1G06_086T01_9000000774_05992cztM0_level2.evt | modeM0/AS1G06_086T01_9000000774_05992cztM0_level2_quad_clean.evt |
| Size (bytes) | 478,699,200 | 119,473,920 |
| Size | 456.5 MB | 113.9 MB |
| Events in quadrant A | 3,305,443 | 797,418 |
| Events in quadrant B | 3,066,753 | 830,376 |
| Events in quadrant C | 4,867,737 | 791,666 |
| Events in quadrant D | 2,832,209 | 761,667 |
| Mode SS | |||
|---|---|---|---|
| Quadrant | BADHDUFLAG | Total packets | Discarded packets |
| A | 0 | 126 | 0 |
| B | 0 | 126 | 0 |
| C | 0 | 126 | 0 |
| D | 0 | 126 | 0 |
| Mode M9 | |||
|---|---|---|---|
| Quadrant | BADHDUFLAG | Total packets | Discarded packets |
| A | 0 | 19 | 0 |
| B | 0 | 19 | 0 |
| C | 0 | 19 | 0 |
| D | 0 | 20 | 0 |
| Mode M0 | |||
|---|---|---|---|
| Quadrant | BADHDUFLAG | Total packets | Discarded packets |
| A | 0 | 14331 | 3 |
| B | 0 | 13450 | 2 |
| C | 0 | 18837 | 2 |
| D | 0 | 13138 | 2 |
| Quadrant | Total seconds | Saturated seconds | Saturation percentage |
|---|---|---|---|
| A | 6273 | 68 | 1.084011% |
| B | 6273 | 62 | 0.988363% |
| C | 6273 | 170 | 2.710027% |
| D | 6273 | 38 | 0.605771% |
Noise dominated data is calculated using 1-second bins in cleaned event files. If a bin has >2000 counts, and if more than 50% of those come from <1% of pixels, then it is considered to be noise-dominated and hence unusable.
| Quadrant | # 1 sec bins | Bins with >0 counts | Bins with >2000 counts | High rate bins dominated by noise | Noise dominated (total time) | Noise dominated (detector-on time) | Marked lightcurve |
|---|---|---|---|---|---|---|---|
| A | 7538 | 6274 | 16 | 16 | 0.21% | 0.26% | 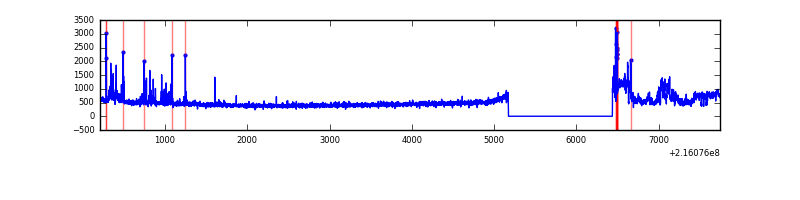 |
| B | 7538 | 6273 | 3 | 3 | 0.04% | 0.05% | 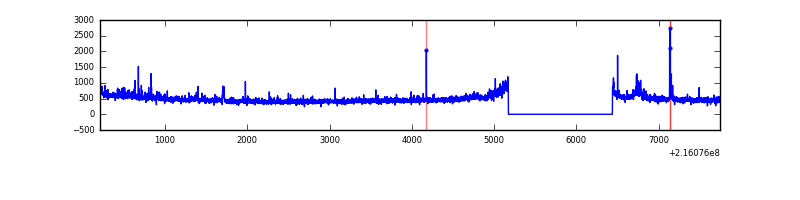 |
| C | 7538 | 6274 | 81 | 81 | 1.07% | 1.29% | 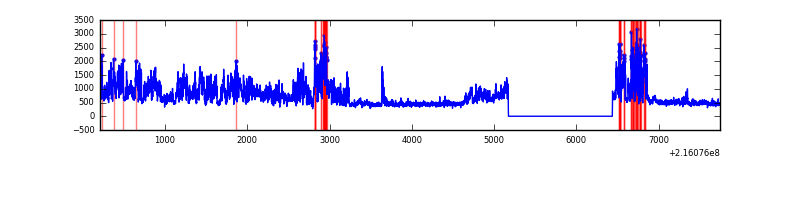 |
| D | 7538 | 6274 | 5 | 5 | 0.07% | 0.08% | 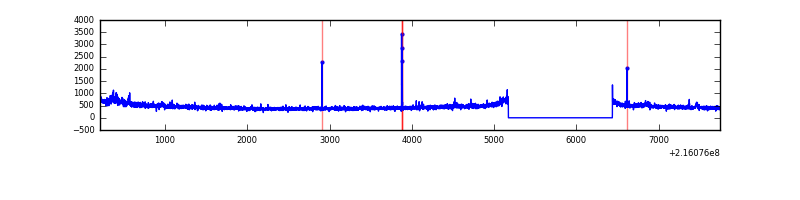 |
Top three noisy pixels from each quadrant. If the there are fewer than three noisy pixels in the level2.evt file, extra rows are filled as -1
| Pixel properties | Quadrant properties | ||||||
|---|---|---|---|---|---|---|---|
| Quadrant | DetID | PixID | Counts | Sigma | Mean | Median | Sigma |
| A | 15 | 234 | 421915 | 2869.95 | 725 | 709 | 146.8 |
| A | 14 | 238 | 66039 | 445.14 | 725 | 709 | 146.8 |
| A | 10 | 253 | 23319 | 154.06 | 725 | 709 | 146.8 |
| B | 0 | 219 | 73499 | 515.88 | 745 | 729 | 141.1 |
| B | 0 | 214 | 39311 | 273.51 | 745 | 729 | 141.1 |
| B | 4 | 172 | 20751 | 141.94 | 745 | 729 | 141.1 |
| C | 1 | 241 | 2054643 | 12511.85 | 714 | 716 | 164.2 |
| C | 9 | 54 | 12356 | 70.9 | 714 | 716 | 164.2 |
| C | 1 | 16 | 8604 | 48.05 | 714 | 716 | 164.2 |
| D | 1 | 239 | 91161 | 524.74 | 709 | 689 | 172.4 |
| D | 2 | 206 | 17489 | 97.44 | 709 | 689 | 172.4 |
| D | 2 | 14 | 15205 | 84.19 | 709 | 689 | 172.4 |
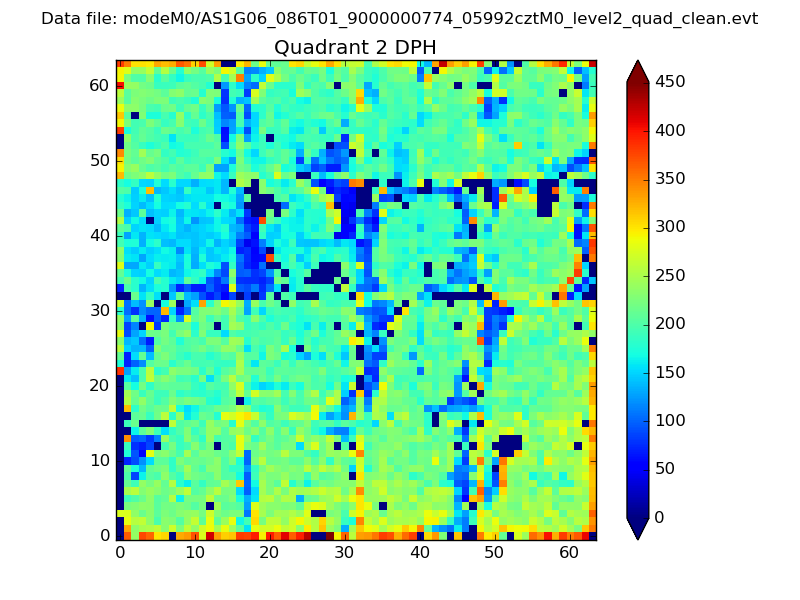
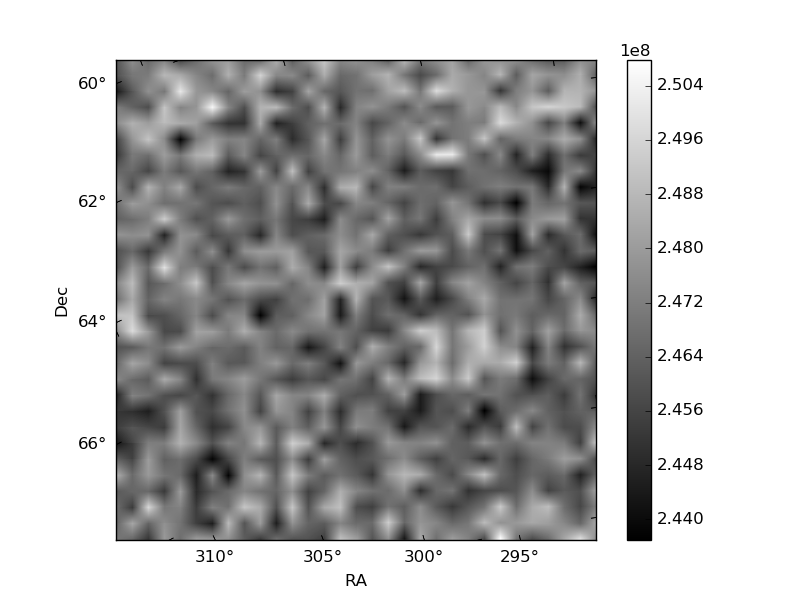
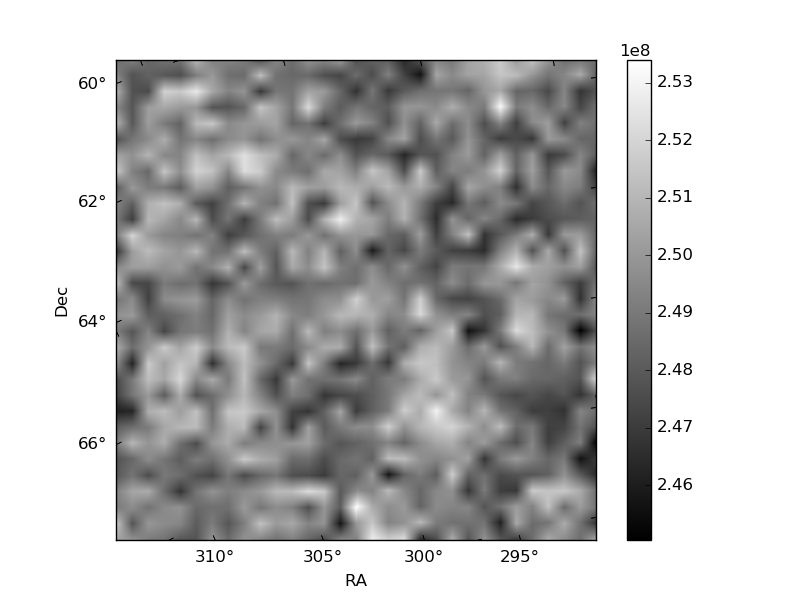
Histogram calculated using DETX and DETY for each event in the final _common_clean file
| Quadrant A | 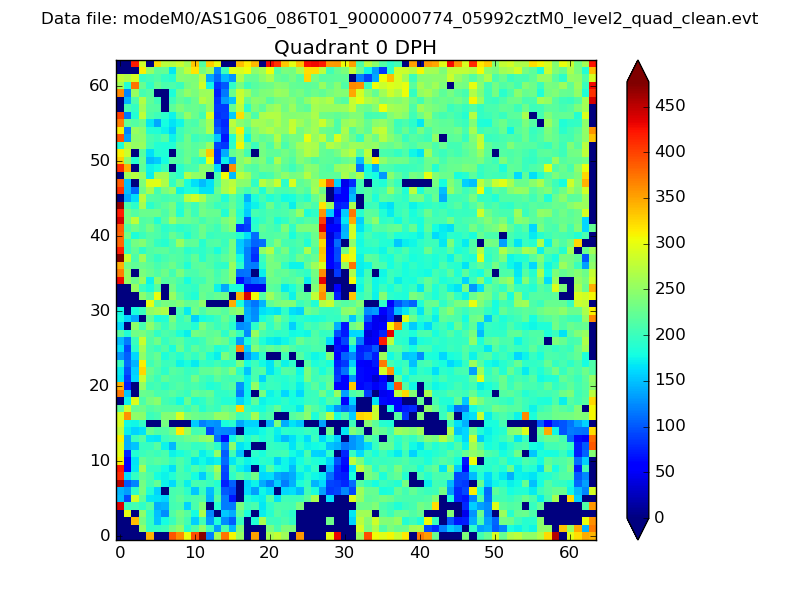 |
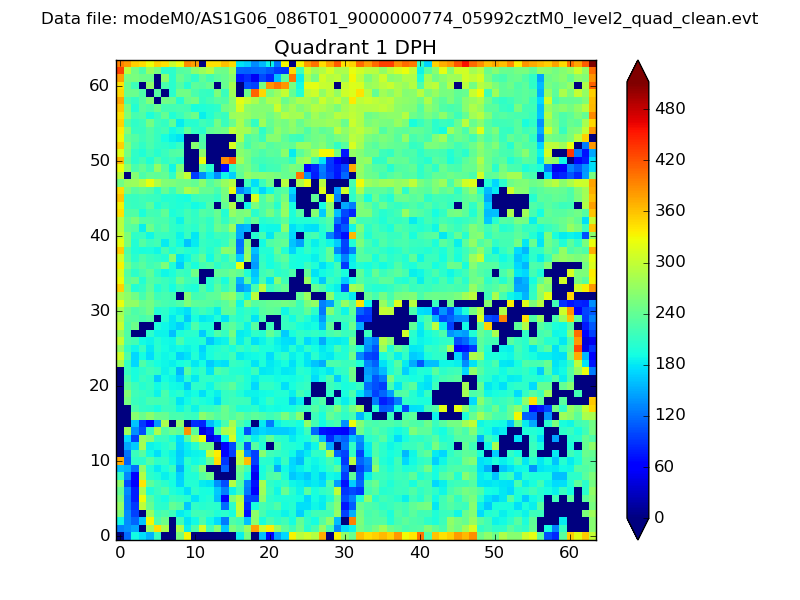 |
Quadrant B |
|---|---|---|---|
| Quadrant D | 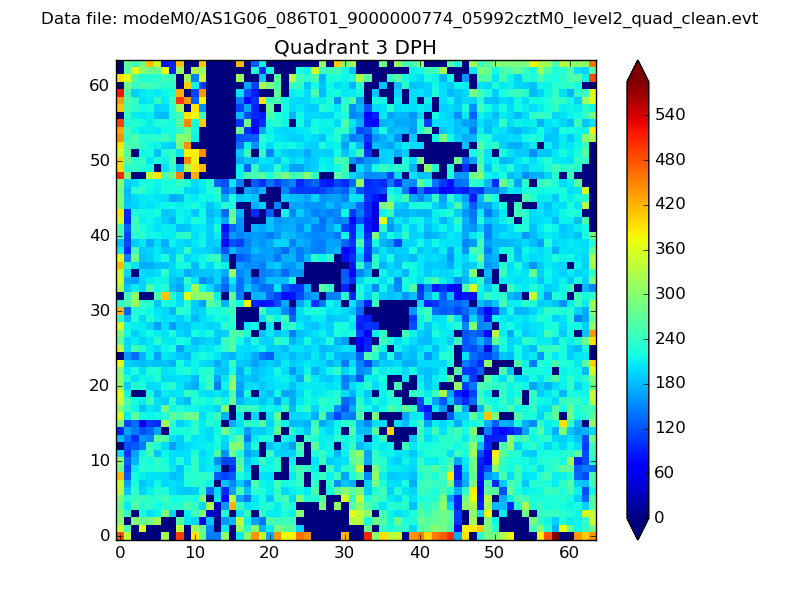 |
 |
Quadrant C |
| Plot type | Count rate plots | Images |
|---|---|---|
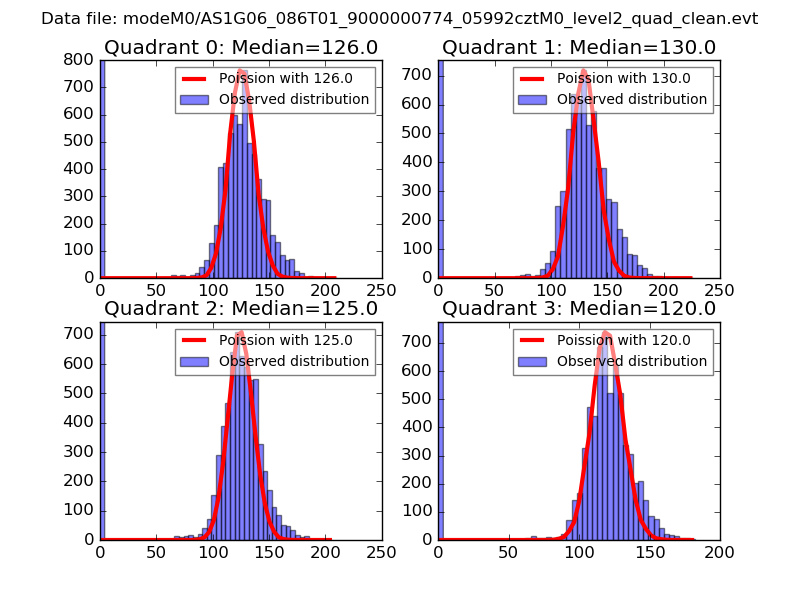
| Comparison with Poisson distribution Blue bars denote a histogram of data divided into 1 sec bins. Red curve is a Poisson curve with rate = median count rate of data. |
 |
 |
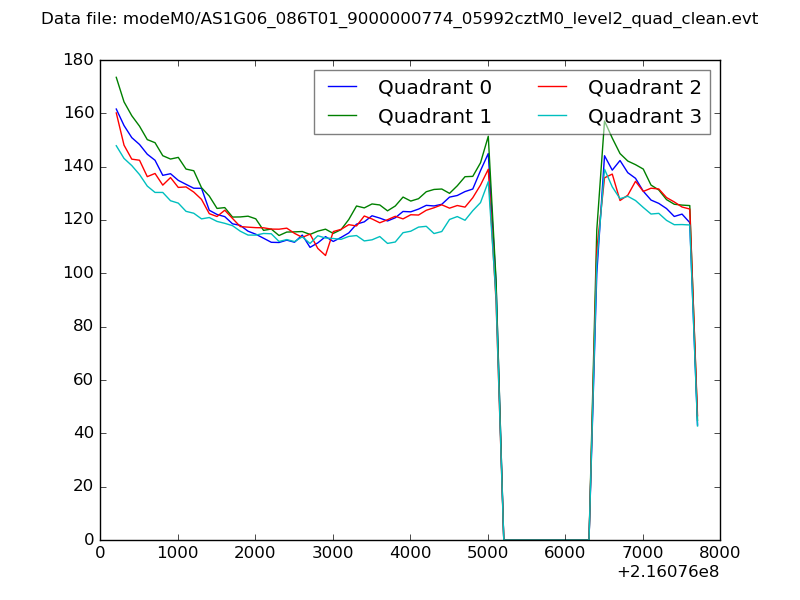
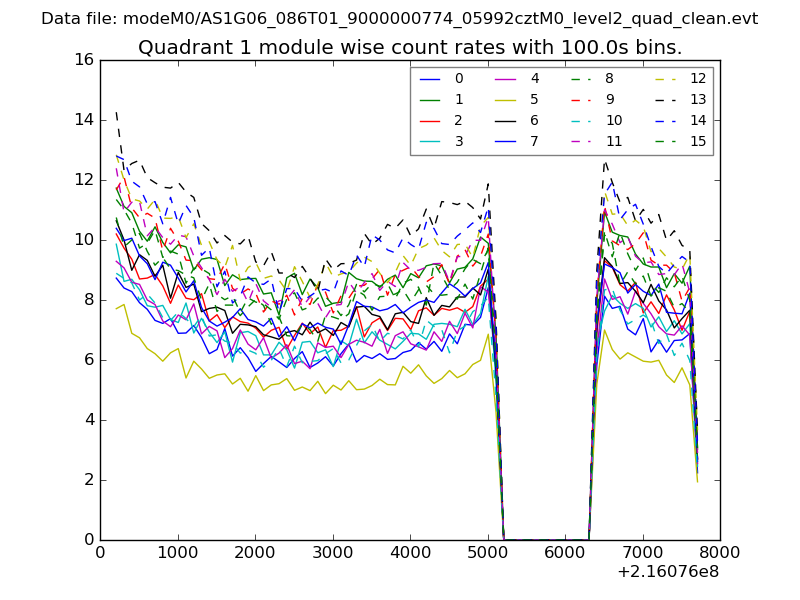
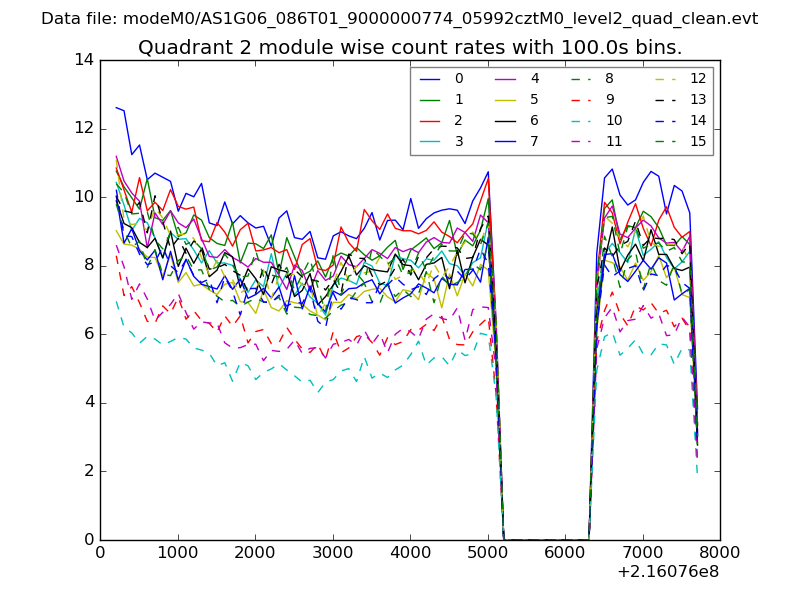
| Quadrant-wise count rates Data is divided into 100 sec bins |
 |
|
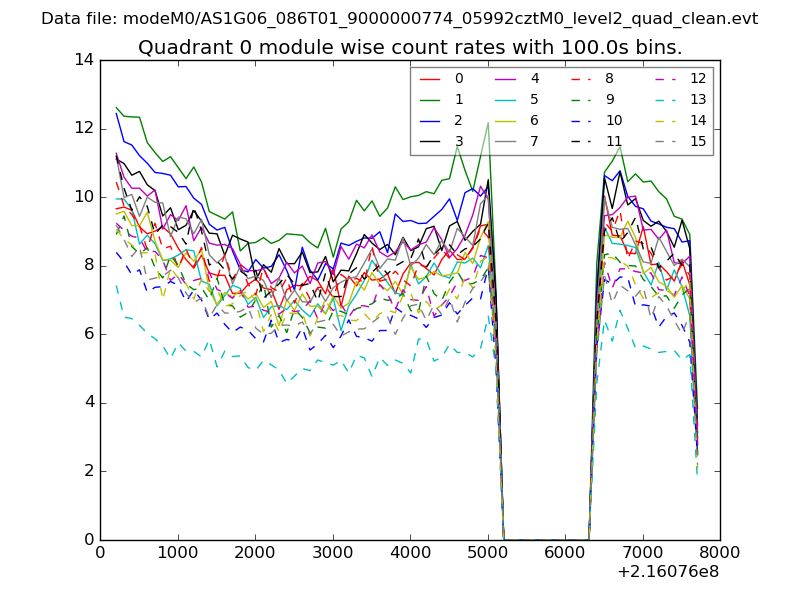
| Module-wise count rates for Quadrant A Data is divided into 100 sec bins |
 |
 |
| Module-wise count rates for Quadrant B Data is divided into 100 sec bins |
 |
 |
| Module-wise count rates for Quadrant C Data is divided into 100 sec bins |
 |
 |
| Module-wise count rates for Quadrant D Data is divided into 100 sec bins |
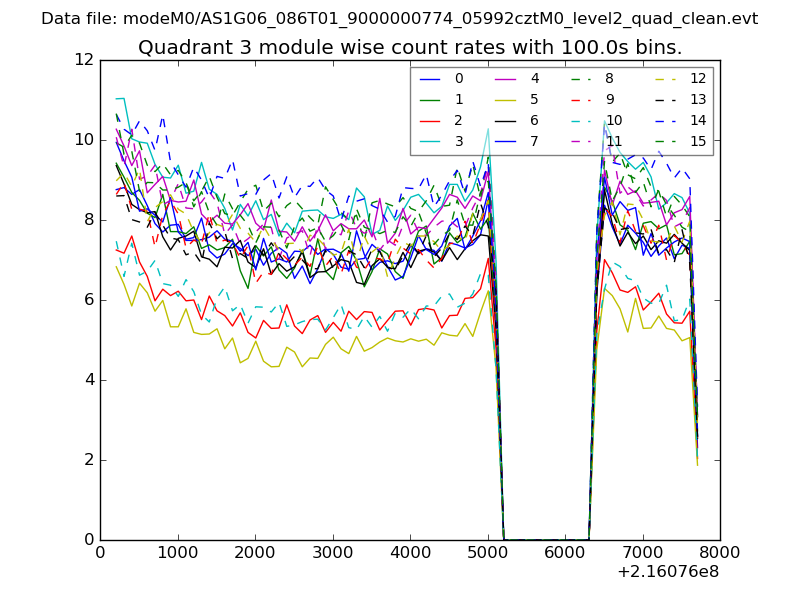 |
 |
| Parameter | Plot |
|---|---|
| CZT HV Monitor | 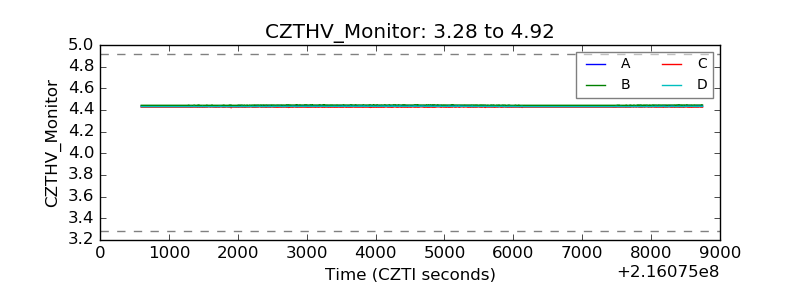 |
| D_VDD | 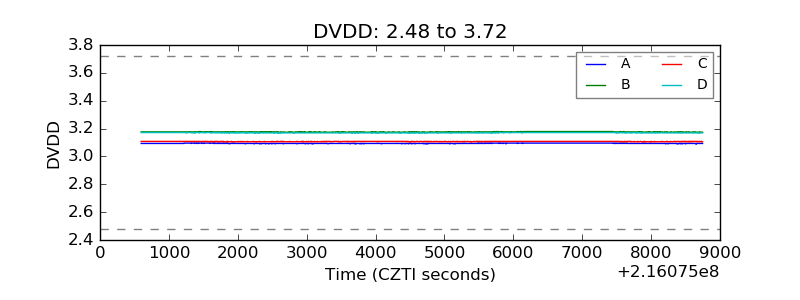 |
| Temperature 1 | 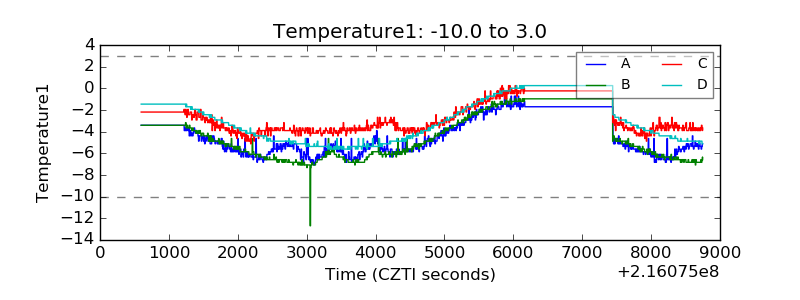 |
| Veto HV Monitor | 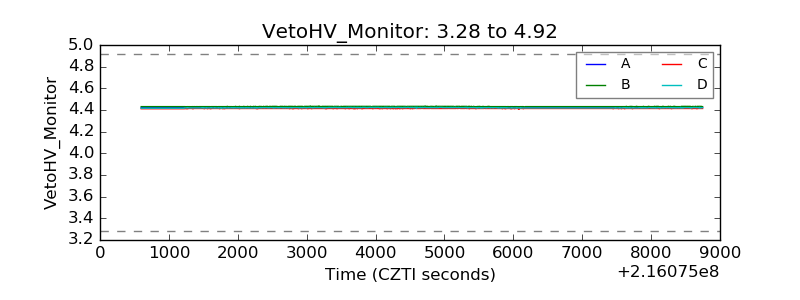 |
| Veto LLD | 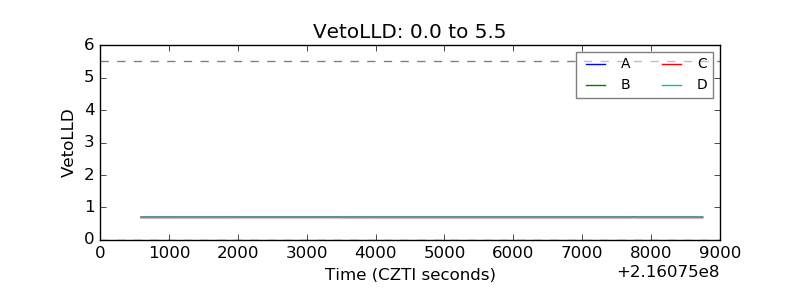 |
| Alpha Counter | 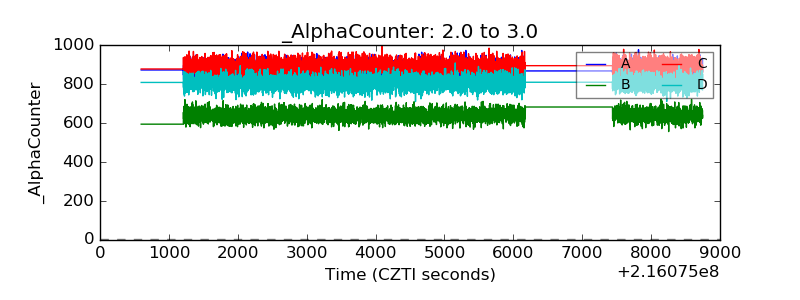 |
| _CPM_Rate | 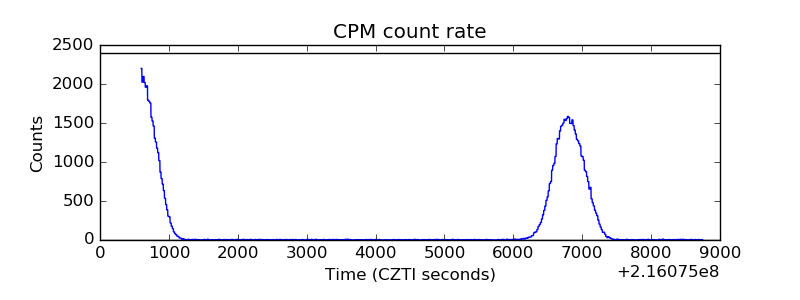 |
| CZT Counter | 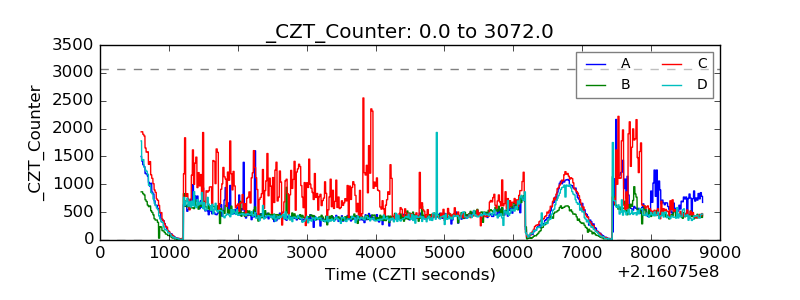 |
| +2.5 Volts monitor |  |
| +5 Volts monitor |  |
| _ROLL_ROT | 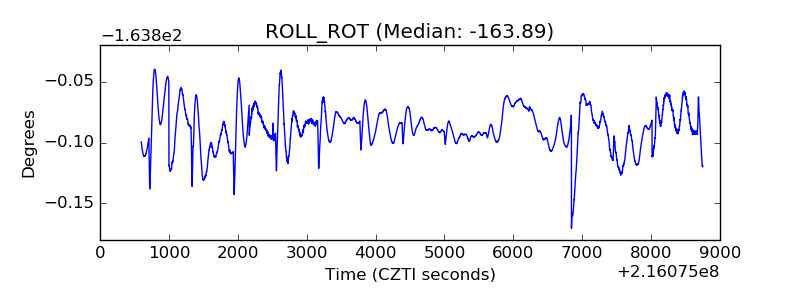 |
| _Roll_DEC | 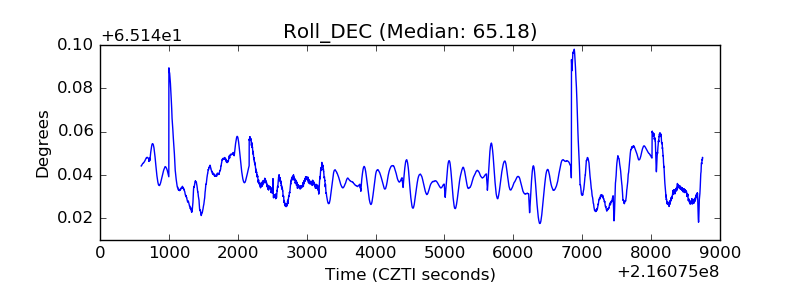 |
| _Roll_RA | 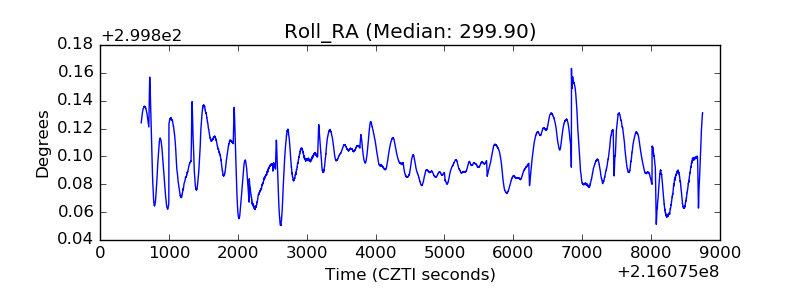 |
| Veto Counter | 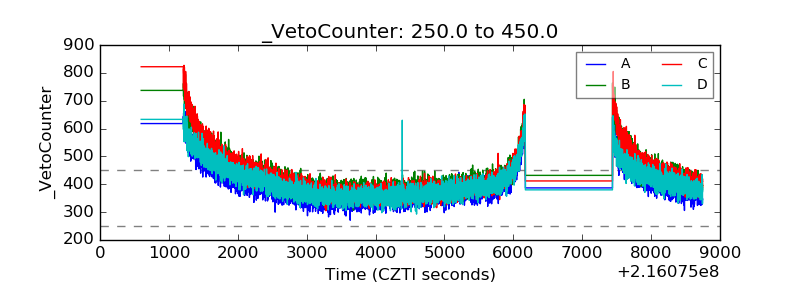 |