| Param | Original file | Final file |
|---|---|---|
| Filename | modeM0/AS1G06_086T01_9000000774_05993cztM0_level2.evt | modeM0/AS1G06_086T01_9000000774_05993cztM0_level2_quad_clean.evt |
| Size (bytes) | 478,742,400 | 122,644,800 |
| Size | 456.6 MB | 117.0 MB |
| Events in quadrant A | 3,453,582 | 813,361 |
| Events in quadrant B | 3,360,287 | 840,961 |
| Events in quadrant C | 4,336,878 | 814,408 |
| Events in quadrant D | 2,895,228 | 781,138 |
| Mode SS | |||
|---|---|---|---|
| Quadrant | BADHDUFLAG | Total packets | Discarded packets |
| A | 0 | 136 | 0 |
| B | 0 | 136 | 0 |
| C | 0 | 136 | 0 |
| D | 0 | 136 | 0 |
| Mode M9 | |||
|---|---|---|---|
| Quadrant | BADHDUFLAG | Total packets | Discarded packets |
| A | 0 | 17 | 0 |
| B | 0 | 17 | 0 |
| C | 0 | 17 | 0 |
| D | 0 | 18 | 0 |
| Mode M0 | |||
|---|---|---|---|
| Quadrant | BADHDUFLAG | Total packets | Discarded packets |
| A | 0 | 15144 | 3 |
| B | 0 | 14636 | 2 |
| C | 0 | 17414 | 2 |
| D | 0 | 13761 | 2 |
| Quadrant | Total seconds | Saturated seconds | Saturation percentage |
|---|---|---|---|
| A | 6665 | 41 | 0.615154% |
| B | 6665 | 61 | 0.915229% |
| C | 6665 | 165 | 2.475619% |
| D | 6665 | 9 | 0.135034% |
Noise dominated data is calculated using 1-second bins in cleaned event files. If a bin has >2000 counts, and if more than 50% of those come from <1% of pixels, then it is considered to be noise-dominated and hence unusable.
| Quadrant | # 1 sec bins | Bins with >0 counts | Bins with >2000 counts | High rate bins dominated by noise | Noise dominated (total time) | Noise dominated (detector-on time) | Marked lightcurve |
|---|---|---|---|---|---|---|---|
| A | 7920 | 6666 | 11 | 11 | 0.14% | 0.17% |  |
| B | 7920 | 6666 | 15 | 15 | 0.19% | 0.23% | 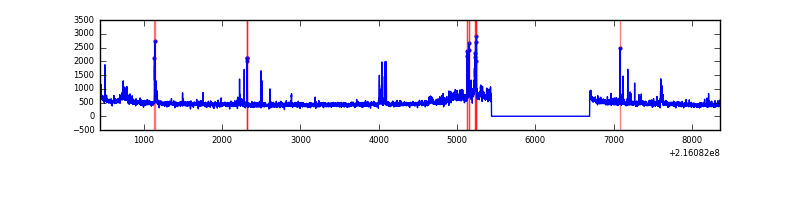 |
| C | 7920 | 6666 | 93 | 93 | 1.17% | 1.40% | 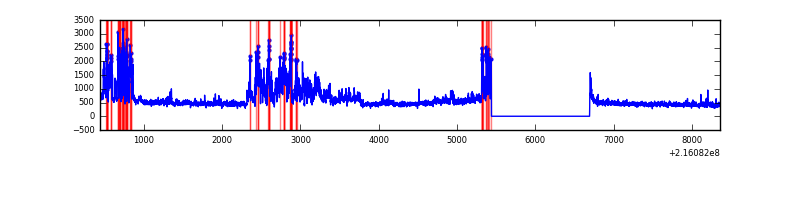 |
| D | 7920 | 6666 | 5 | 5 | 0.06% | 0.08% | 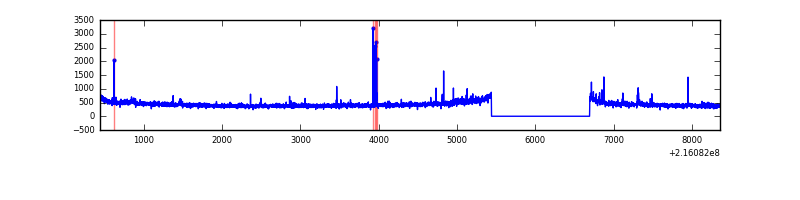 |
Top three noisy pixels from each quadrant. If the there are fewer than three noisy pixels in the level2.evt file, extra rows are filled as -1
| Pixel properties | Quadrant properties | ||||||
|---|---|---|---|---|---|---|---|
| Quadrant | DetID | PixID | Counts | Sigma | Mean | Median | Sigma |
| A | 15 | 234 | 502838 | 3316.49 | 748 | 729 | 151.4 |
| A | 14 | 238 | 28326 | 182.28 | 748 | 729 | 151.4 |
| A | 10 | 253 | 23375 | 149.58 | 748 | 729 | 151.4 |
| B | 15 | 204 | 101806 | 699.13 | 768 | 750 | 144.5 |
| B | 0 | 219 | 72641 | 497.36 | 768 | 750 | 144.5 |
| B | 0 | 214 | 59670 | 407.62 | 768 | 750 | 144.5 |
| C | 1 | 241 | 1432060 | 8469.27 | 736 | 739 | 169.0 |
| C | 1 | 16 | 23316 | 133.59 | 736 | 739 | 169.0 |
| C | 12 | 4 | 7809 | 41.83 | 736 | 739 | 169.0 |
| D | 12 | 221 | 34035 | 189.77 | 727 | 704 | 175.6 |
| D | 2 | 14 | 28011 | 155.47 | 727 | 704 | 175.6 |
| D | 5 | 97 | 24414 | 134.99 | 727 | 704 | 175.6 |
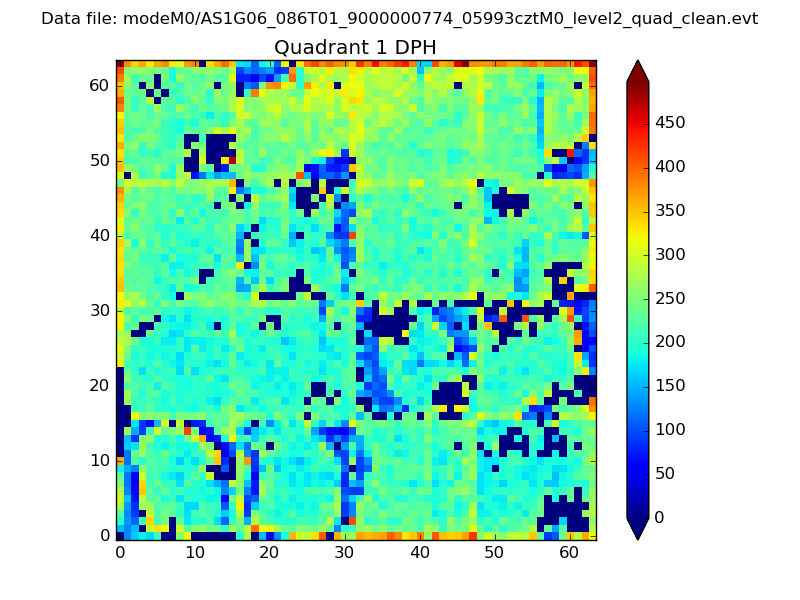
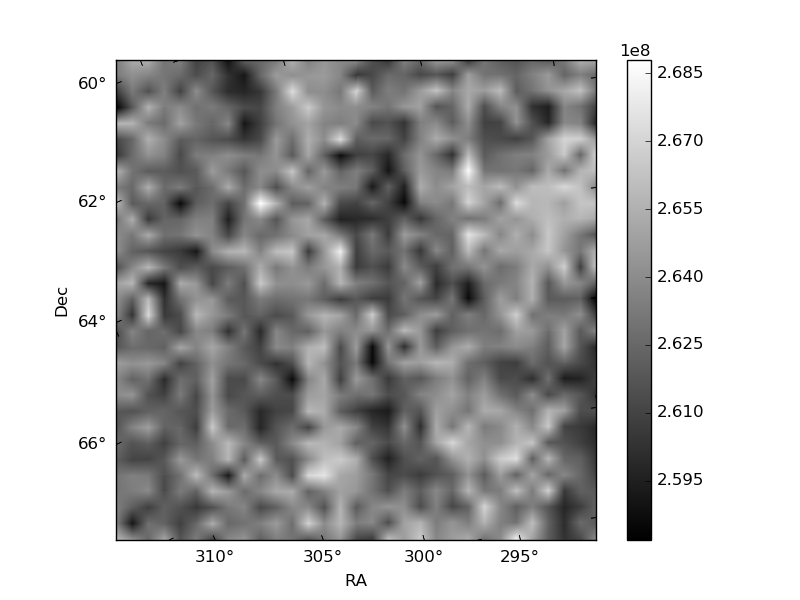
Histogram calculated using DETX and DETY for each event in the final _common_clean file
| Quadrant A | 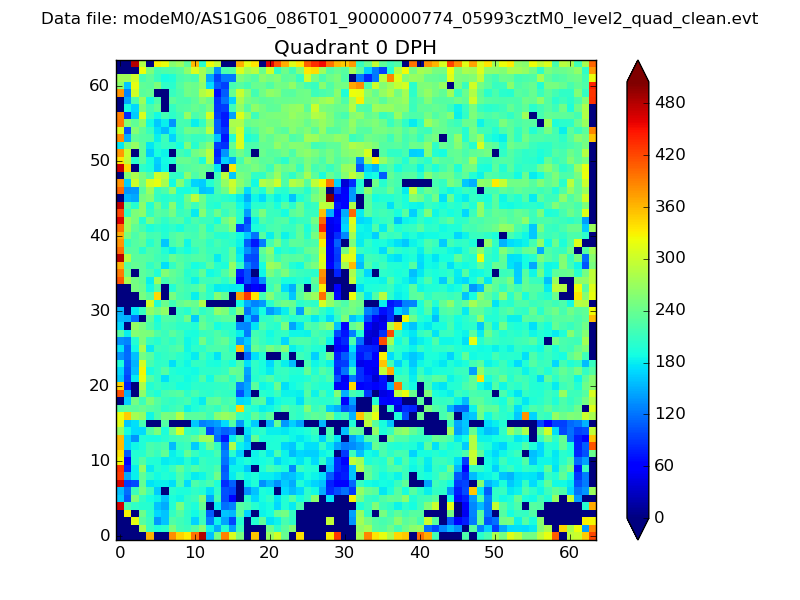 |
 |
Quadrant B |
|---|---|---|---|
| Quadrant D | 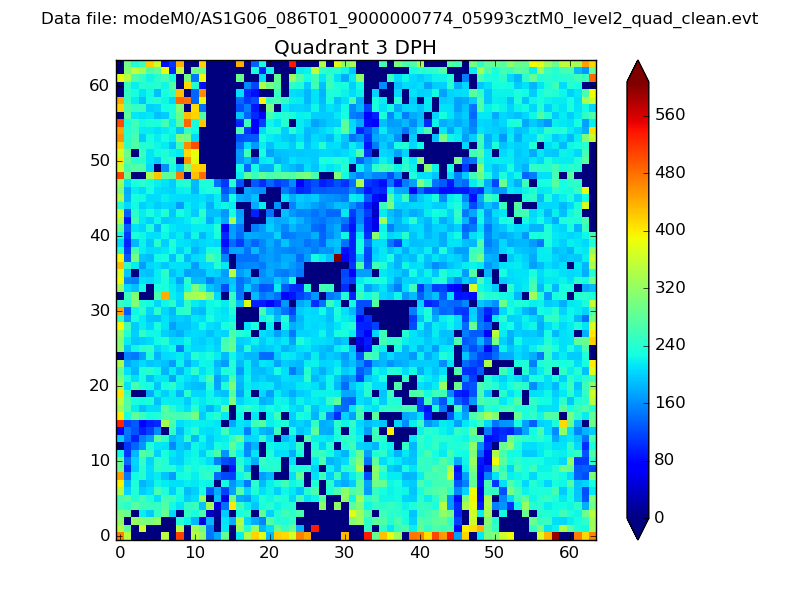 |
 |
Quadrant C |
| Plot type | Count rate plots | Images |
|---|---|---|
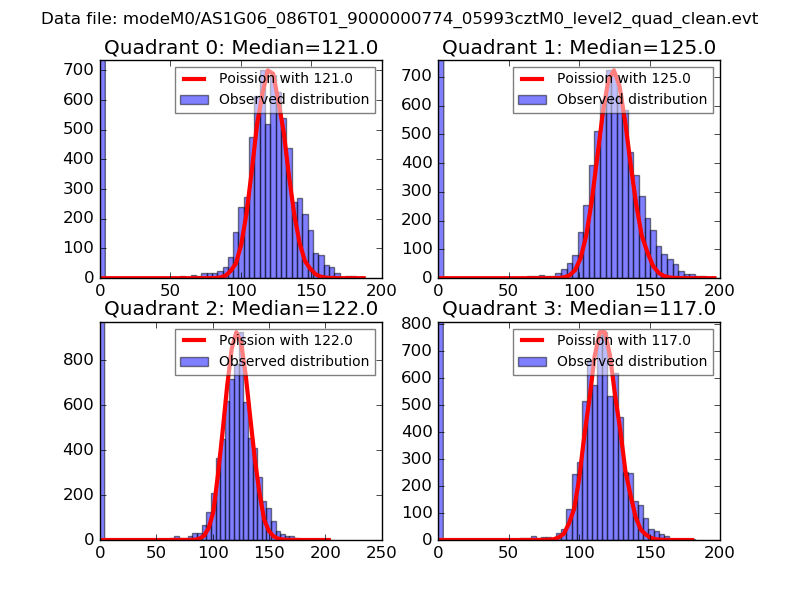
| Comparison with Poisson distribution Blue bars denote a histogram of data divided into 1 sec bins. Red curve is a Poisson curve with rate = median count rate of data. |
 |
 |
| Quadrant-wise count rates Data is divided into 100 sec bins |
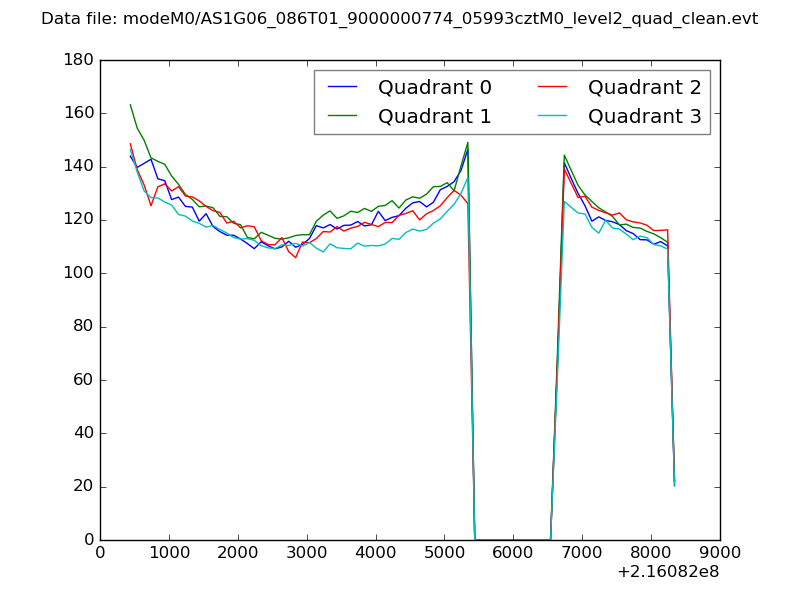 |
|
| Module-wise count rates for Quadrant A Data is divided into 100 sec bins |
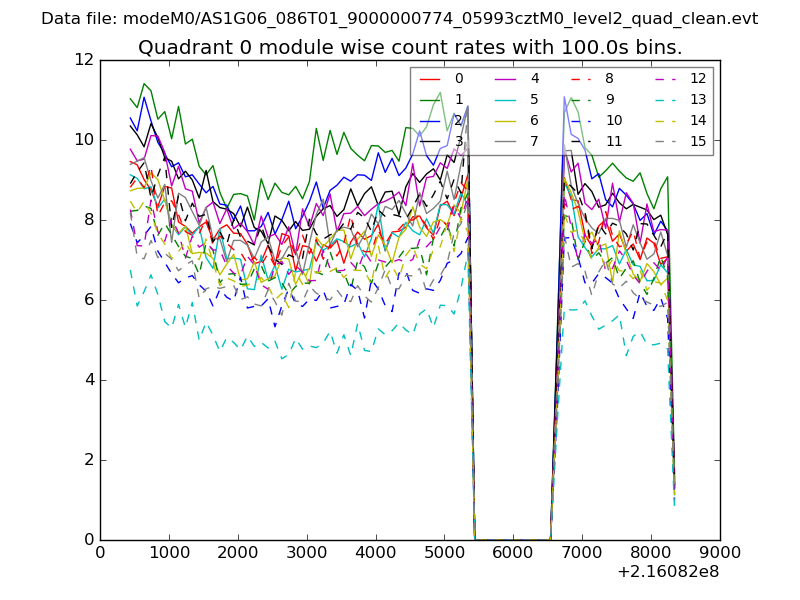 |
 |
| Module-wise count rates for Quadrant B Data is divided into 100 sec bins |
 |
 |
| Module-wise count rates for Quadrant C Data is divided into 100 sec bins |
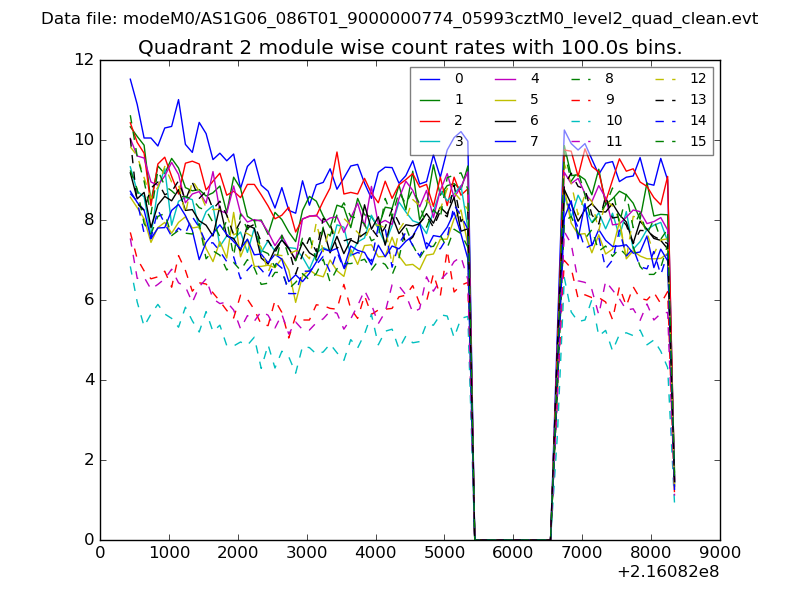 |
 |
| Module-wise count rates for Quadrant D Data is divided into 100 sec bins |
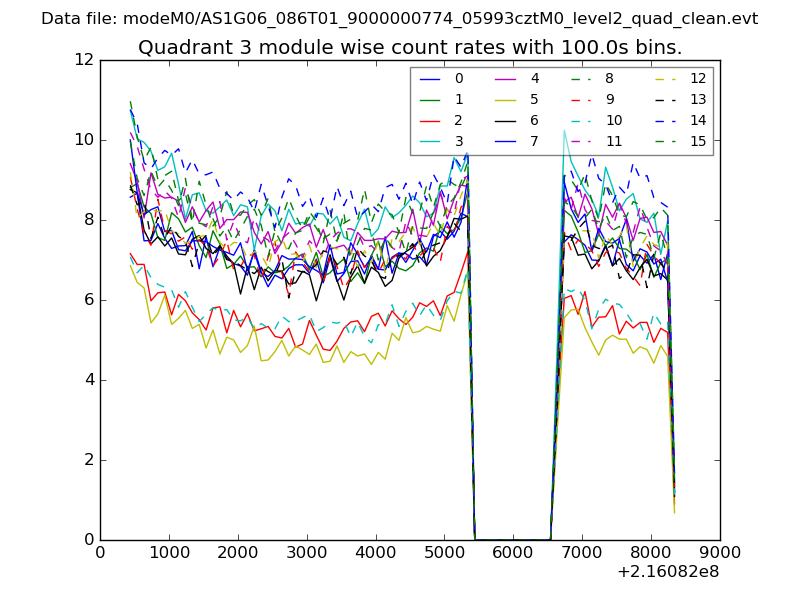 |
 |
| Parameter | Plot |
|---|---|
| CZT HV Monitor | 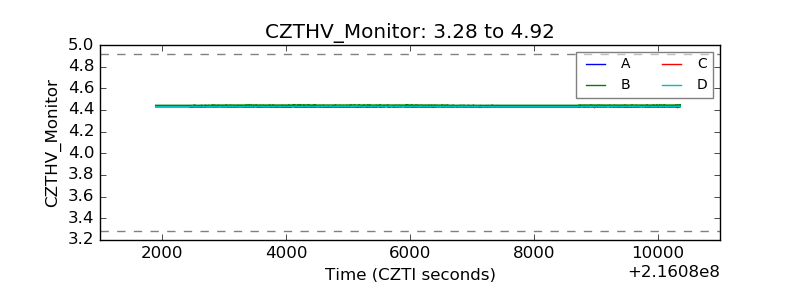 |
| D_VDD |  |
| Temperature 1 | 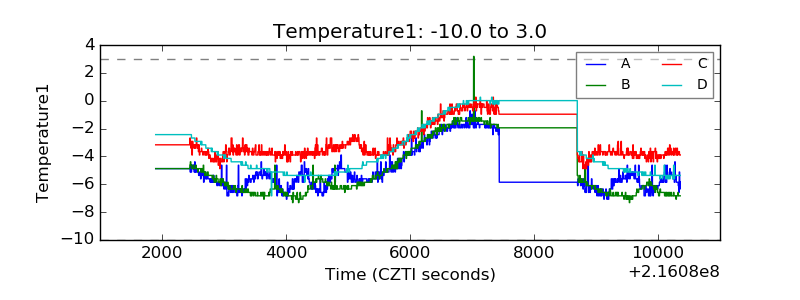 |
| Veto HV Monitor | 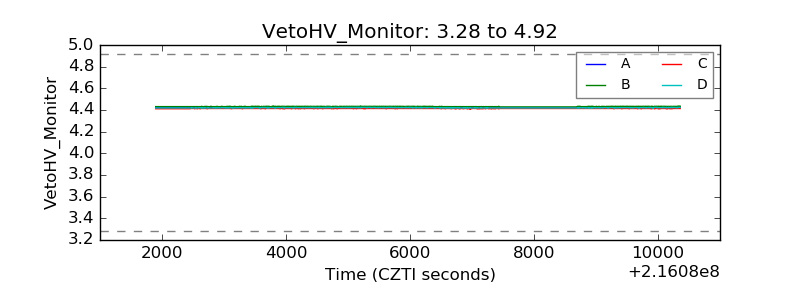 |
| Veto LLD | 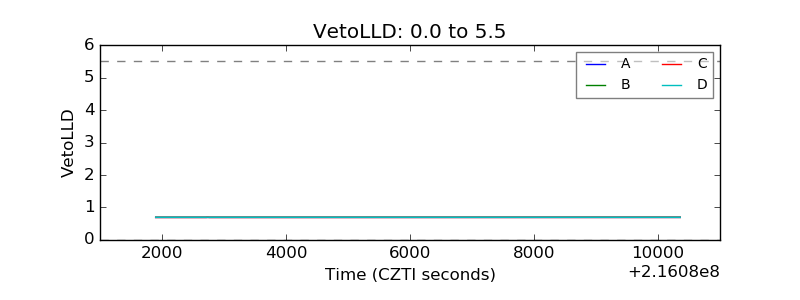 |
| Alpha Counter | 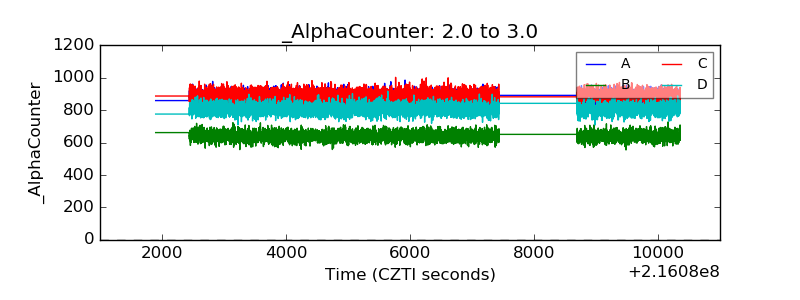 |
| _CPM_Rate | 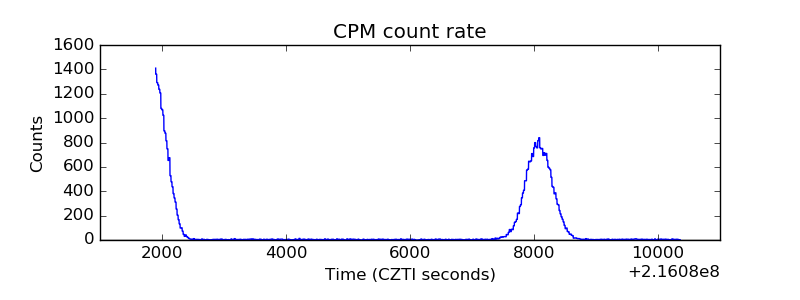 |
| CZT Counter | 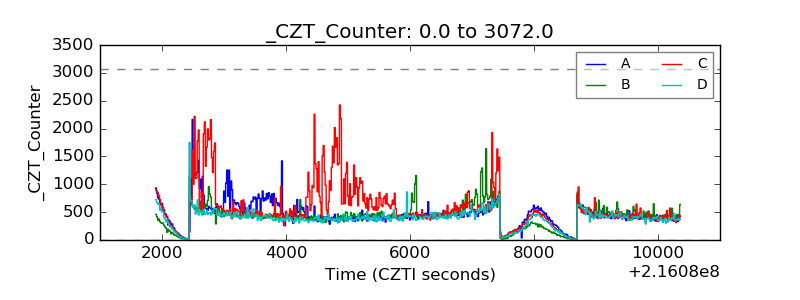 |
| +2.5 Volts monitor |  |
| +5 Volts monitor |  |
| _ROLL_ROT | 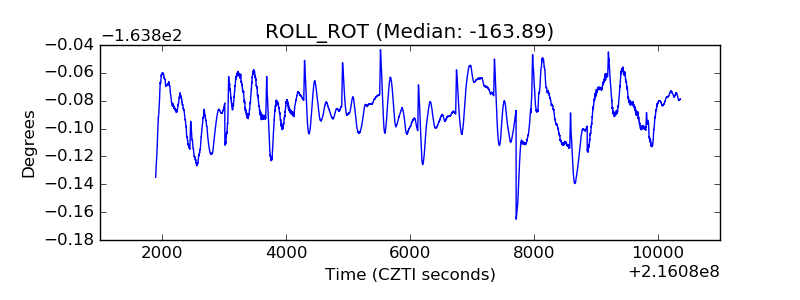 |
| _Roll_DEC | 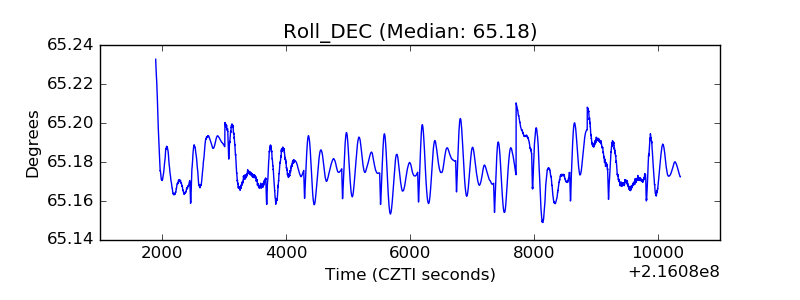 |
| _Roll_RA | 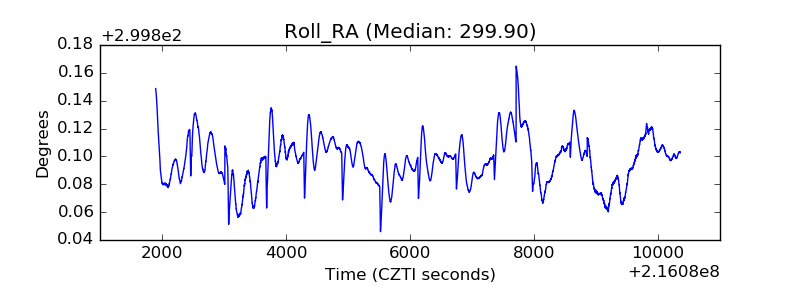 |
| Veto Counter | 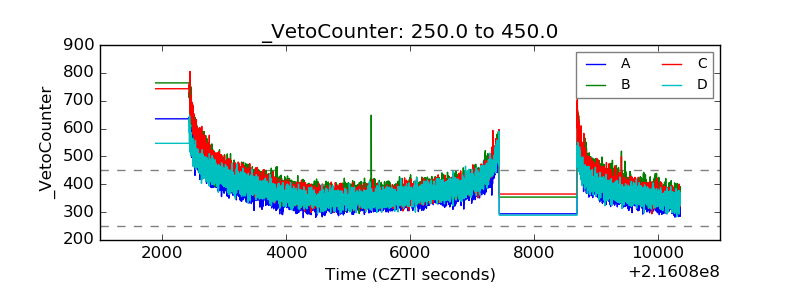 |