| Param | Original file | Final file |
|---|---|---|
| Filename | modeM0/AS1G06_086T01_9000000774_05994cztM0_level2.evt | modeM0/AS1G06_086T01_9000000774_05994cztM0_level2_quad_clean.evt |
| Size (bytes) | 420,724,800 | 122,578,560 |
| Size | 401.2 MB | 116.9 MB |
| Events in quadrant A | 3,017,705 | 811,590 |
| Events in quadrant B | 3,289,120 | 829,994 |
| Events in quadrant C | 2,966,589 | 817,334 |
| Events in quadrant D | 3,001,981 | 776,378 |
| Mode SS | |||
|---|---|---|---|
| Quadrant | BADHDUFLAG | Total packets | Discarded packets |
| A | 0 | 140 | 0 |
| B | 0 | 140 | 0 |
| C | 0 | 140 | 0 |
| D | 0 | 140 | 0 |
| Mode M9 | |||
|---|---|---|---|
| Quadrant | BADHDUFLAG | Total packets | Discarded packets |
| A | 0 | 14 | 0 |
| B | 0 | 14 | 0 |
| C | 0 | 14 | 0 |
| D | 0 | 15 | 0 |
| Mode M0 | |||
|---|---|---|---|
| Quadrant | BADHDUFLAG | Total packets | Discarded packets |
| A | 0 | 14080 | 3 |
| B | 0 | 14632 | 2 |
| C | 0 | 13954 | 2 |
| D | 0 | 14221 | 2 |
| Quadrant | Total seconds | Saturated seconds | Saturation percentage |
|---|---|---|---|
| A | 6848 | 55 | 0.803154% |
| B | 6848 | 98 | 1.431075% |
| C | 6848 | 30 | 0.438084% |
| D | 6848 | 25 | 0.365070% |
Noise dominated data is calculated using 1-second bins in cleaned event files. If a bin has >2000 counts, and if more than 50% of those come from <1% of pixels, then it is considered to be noise-dominated and hence unusable.
| Quadrant | # 1 sec bins | Bins with >0 counts | Bins with >2000 counts | High rate bins dominated by noise | Noise dominated (total time) | Noise dominated (detector-on time) | Marked lightcurve |
|---|---|---|---|---|---|---|---|
| A | 7848 | 6849 | 8 | 8 | 0.10% | 0.12% |  |
| B | 7848 | 6849 | 35 | 35 | 0.45% | 0.51% | 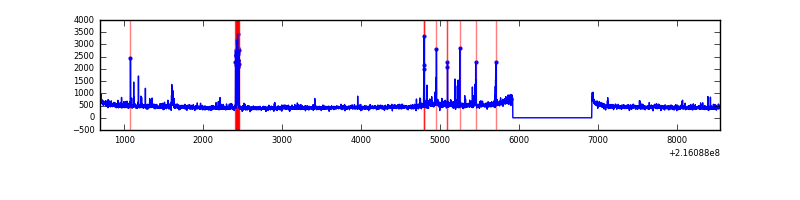 |
| C | 7848 | 6849 | 0 | 0 | 0.00% | 0.00% | 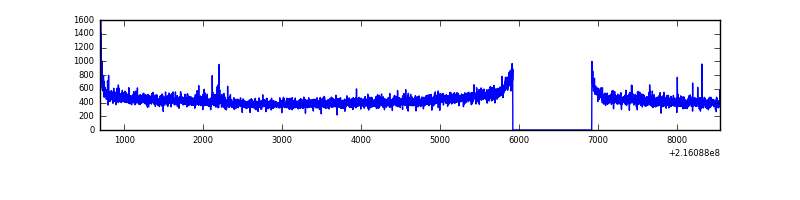 |
| D | 7848 | 6849 | 6 | 6 | 0.08% | 0.09% |  |
Top three noisy pixels from each quadrant. If the there are fewer than three noisy pixels in the level2.evt file, extra rows are filled as -1
| Pixel properties | Quadrant properties | ||||||
|---|---|---|---|---|---|---|---|
| Quadrant | DetID | PixID | Counts | Sigma | Mean | Median | Sigma |
| A | 7 | 16 | 26922 | 170.72 | 762 | 744 | 153.3 |
| A | 10 | 253 | 19030 | 119.25 | 762 | 744 | 153.3 |
| A | 14 | 238 | 17676 | 110.42 | 762 | 744 | 153.3 |
| B | 15 | 85 | 98450 | 660.91 | 778 | 761 | 147.8 |
| B | 4 | 48 | 52788 | 351.99 | 778 | 761 | 147.8 |
| B | 0 | 214 | 49803 | 331.79 | 778 | 761 | 147.8 |
| C | 1 | 16 | 23239 | 129.65 | 750 | 753 | 173.4 |
| C | 1 | 241 | 9889 | 52.68 | 750 | 753 | 173.4 |
| C | 12 | 4 | 6297 | 31.97 | 750 | 753 | 173.4 |
| D | 2 | 63 | 41115 | 225.92 | 738 | 713 | 178.8 |
| D | 2 | 14 | 40341 | 221.6 | 738 | 713 | 178.8 |
| D | 8 | 195 | 24067 | 130.59 | 738 | 713 | 178.8 |
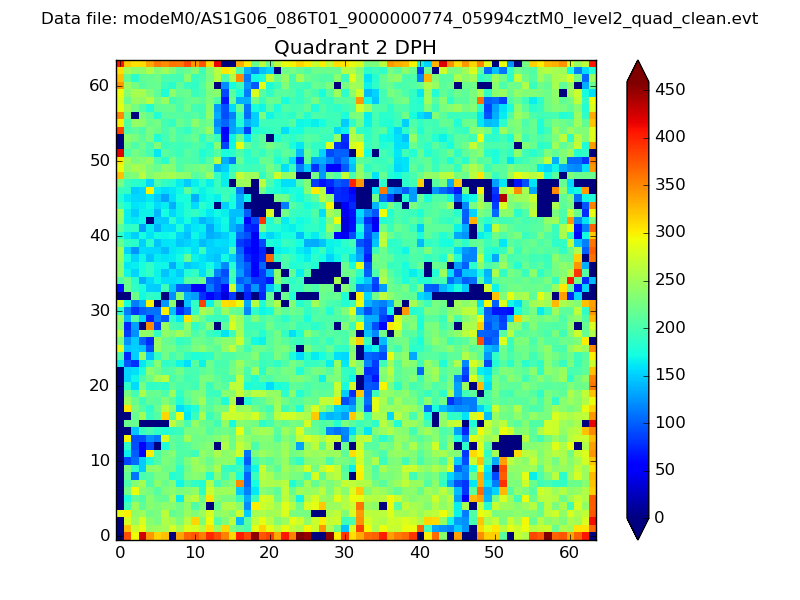
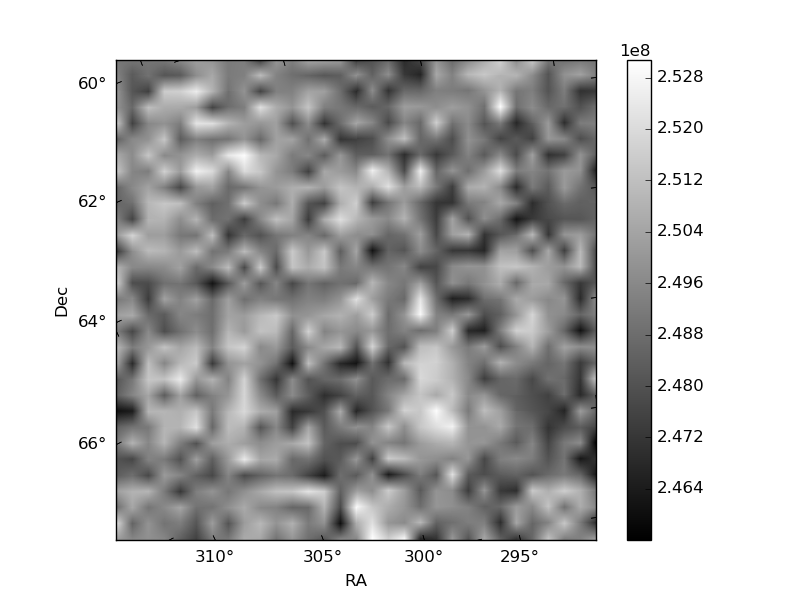
Histogram calculated using DETX and DETY for each event in the final _common_clean file
| Quadrant A | 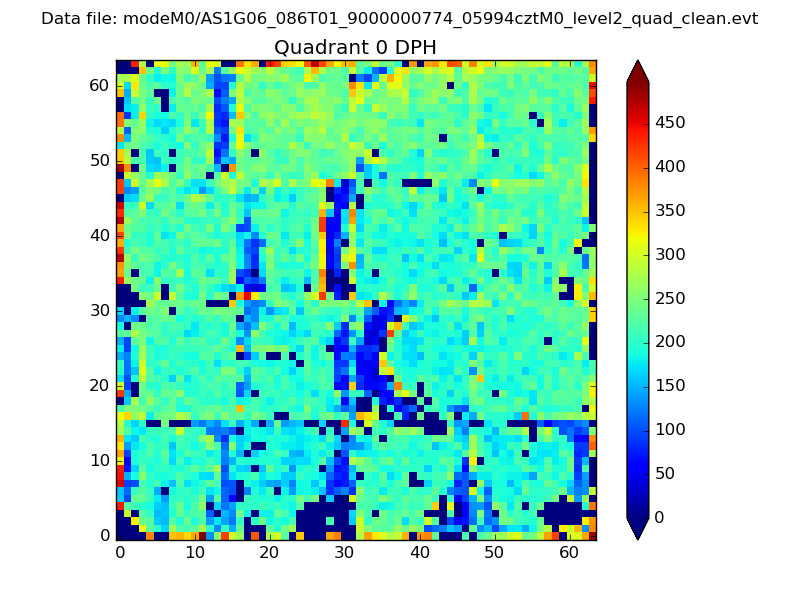 |
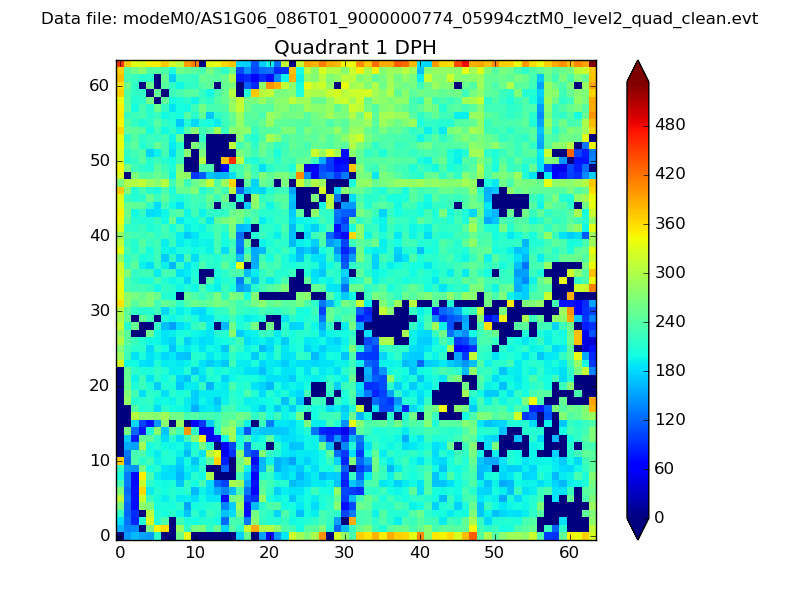 |
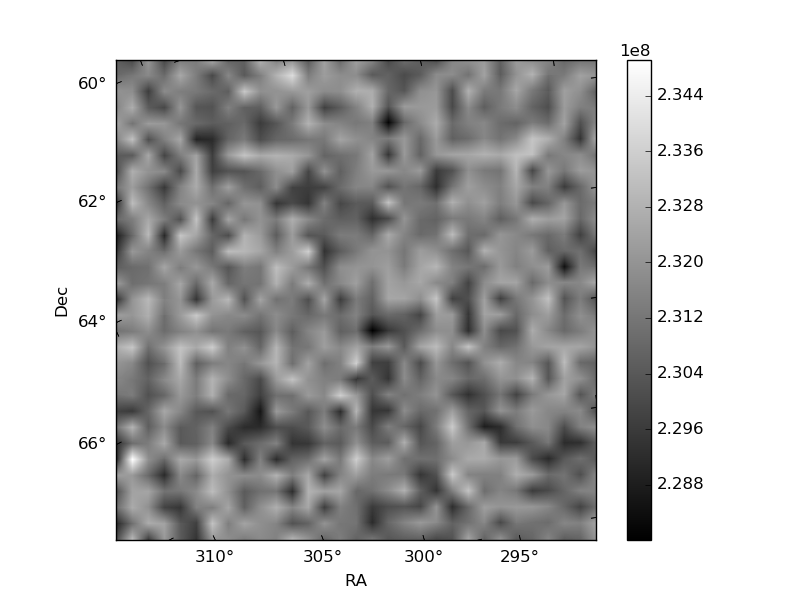
Quadrant B |
|---|---|---|---|
| Quadrant D | 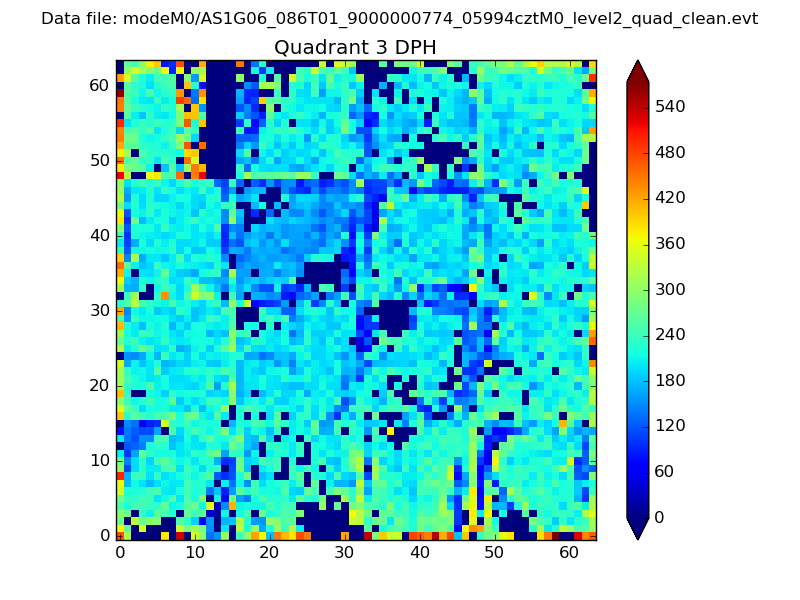 |
 |
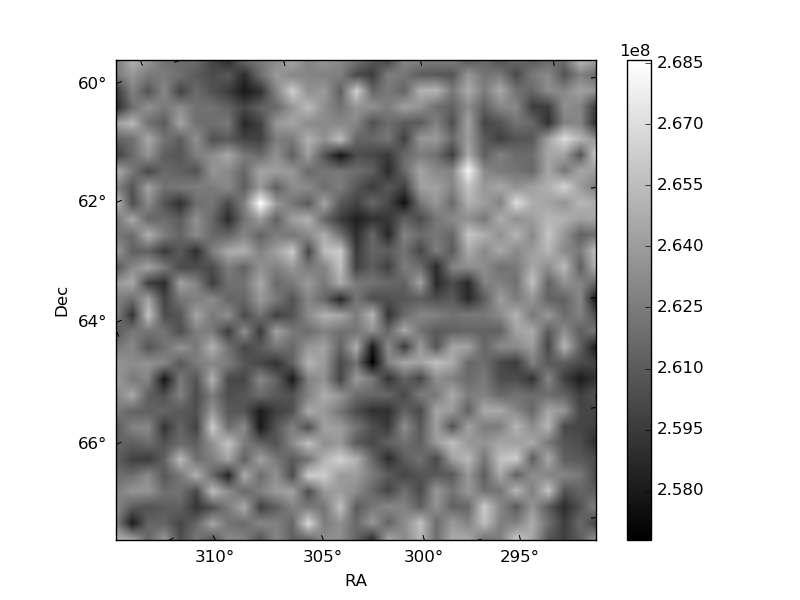
Quadrant C |
| Plot type | Count rate plots | Images |
|---|---|---|
| Comparison with Poisson distribution Blue bars denote a histogram of data divided into 1 sec bins. Red curve is a Poisson curve with rate = median count rate of data. |
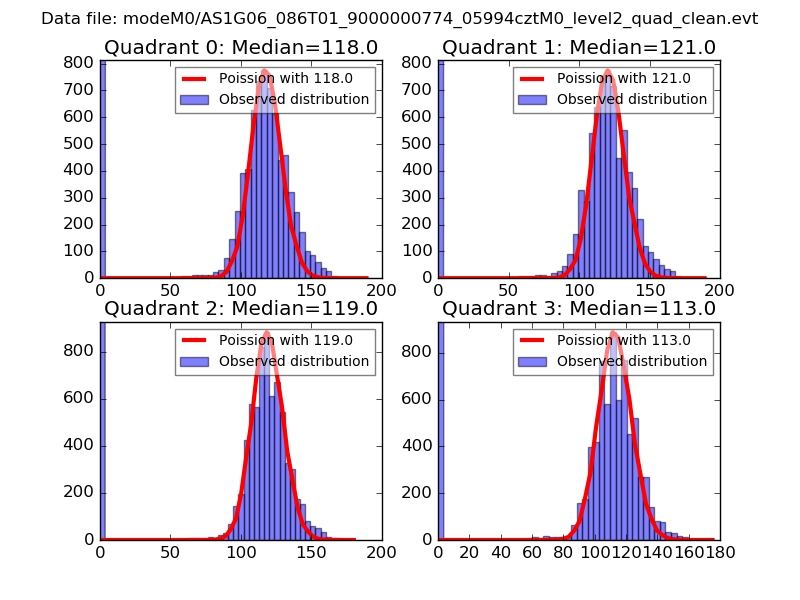 |
 |
| Quadrant-wise count rates Data is divided into 100 sec bins |
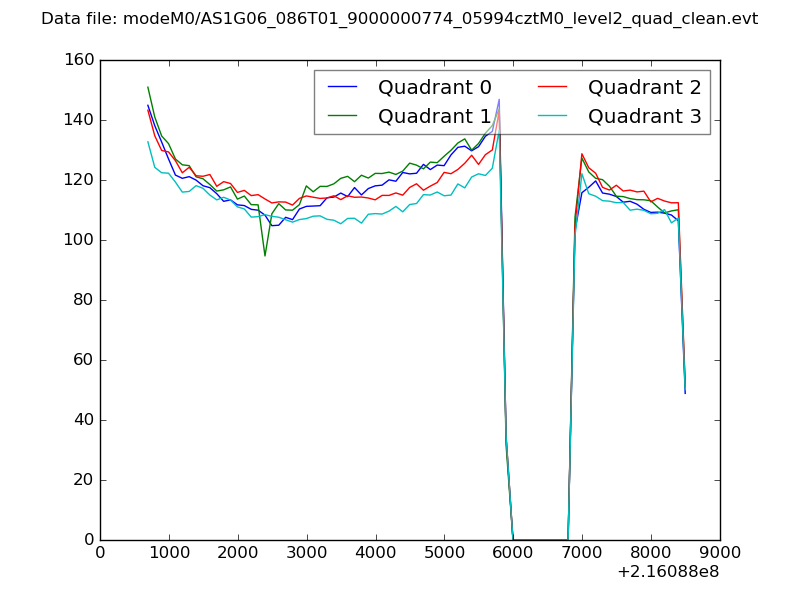 |
|
| Module-wise count rates for Quadrant A Data is divided into 100 sec bins |
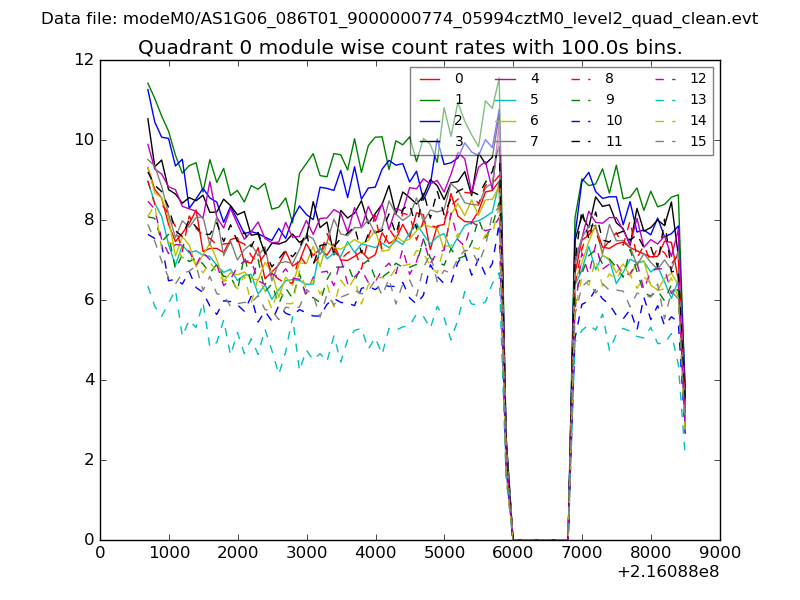 |
 |
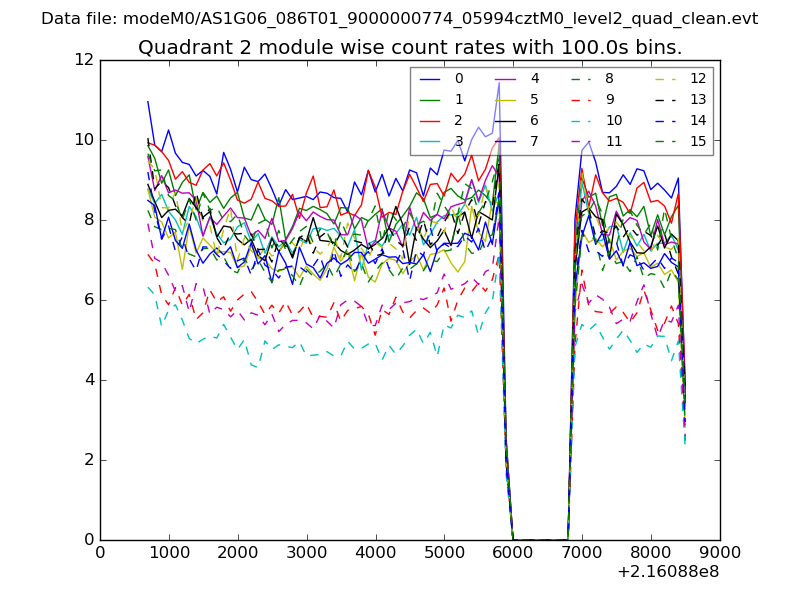
| Module-wise count rates for Quadrant B Data is divided into 100 sec bins |
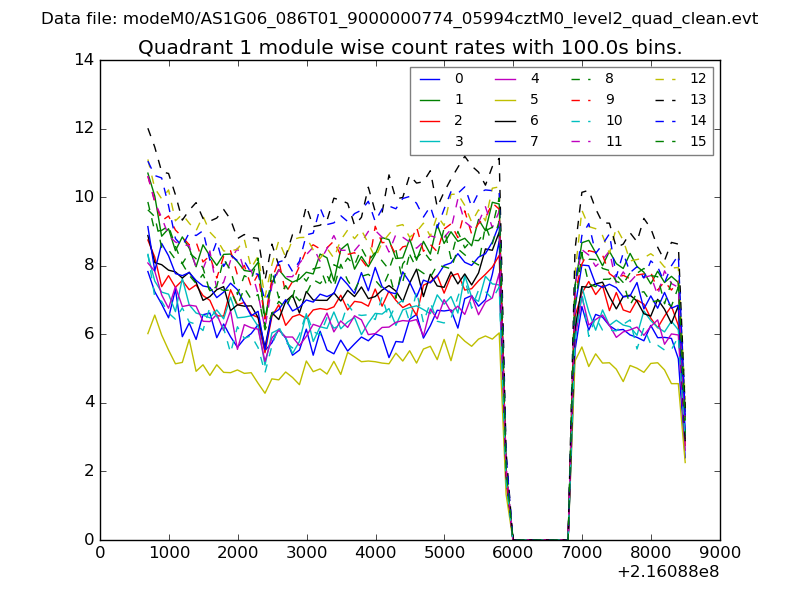 |
 |
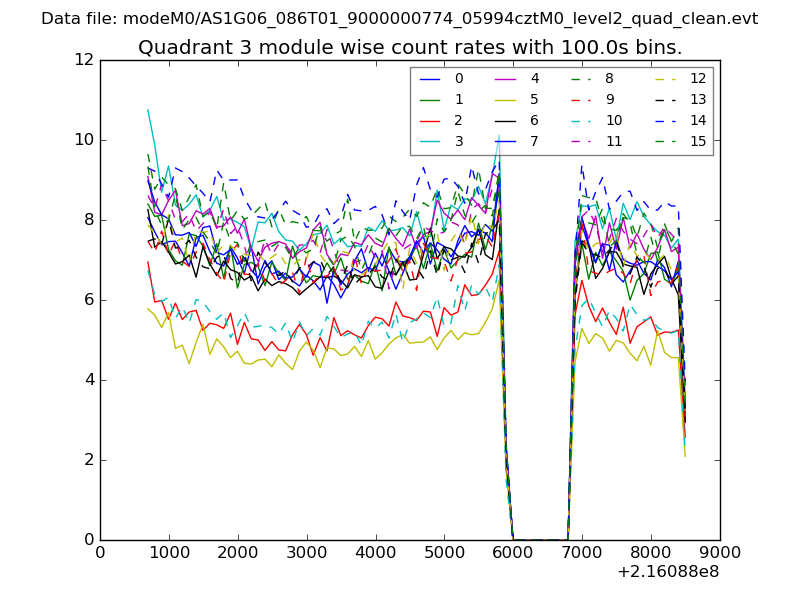
| Module-wise count rates for Quadrant C Data is divided into 100 sec bins |
 |
 |
| Module-wise count rates for Quadrant D Data is divided into 100 sec bins |
 |
 |
| Parameter | Plot |
|---|---|
| CZT HV Monitor | 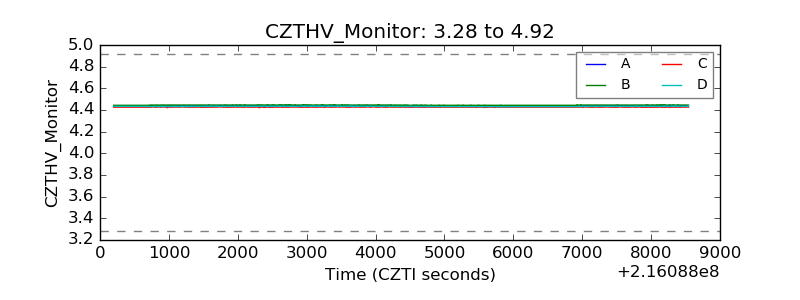 |
| D_VDD | 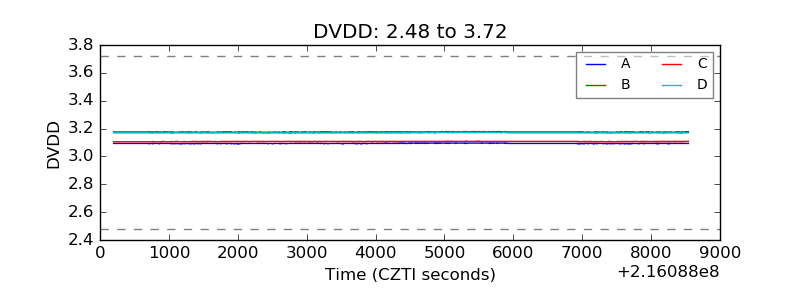 |
| Temperature 1 | 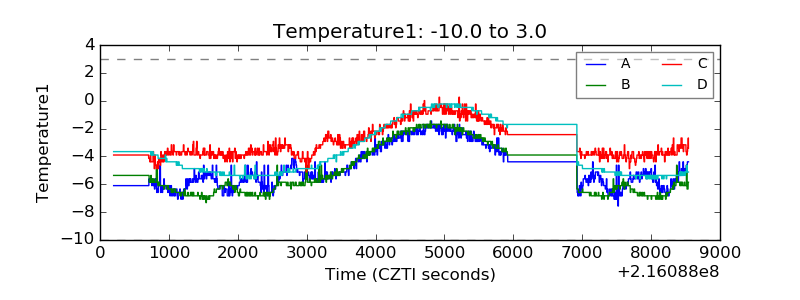 |
| Veto HV Monitor | 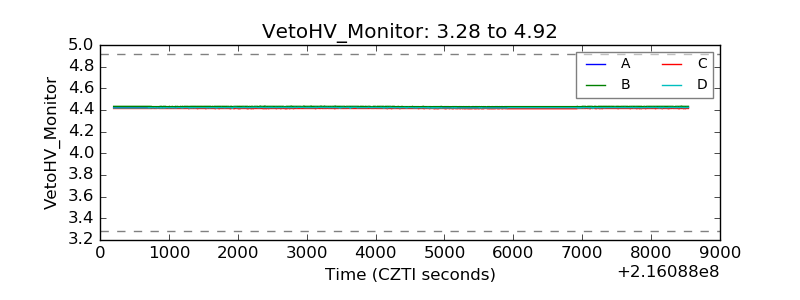 |
| Veto LLD | 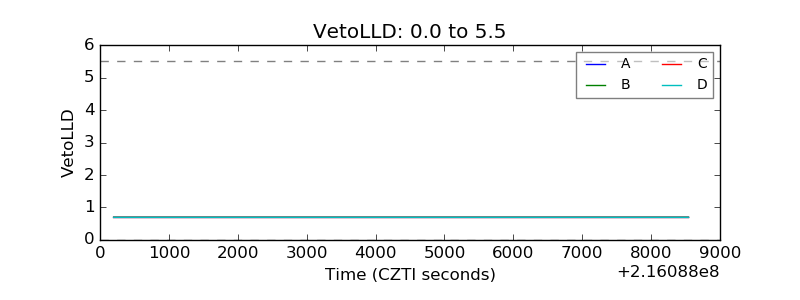 |
| Alpha Counter | 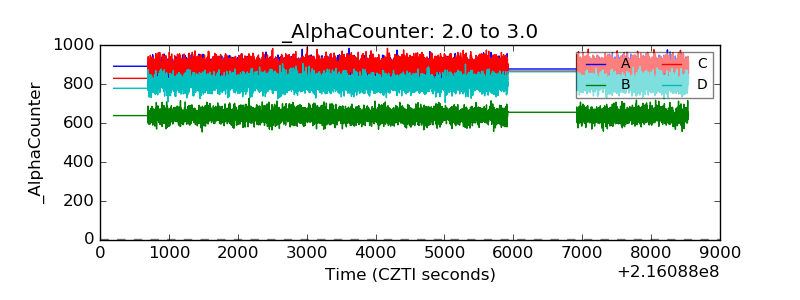 |
| _CPM_Rate | 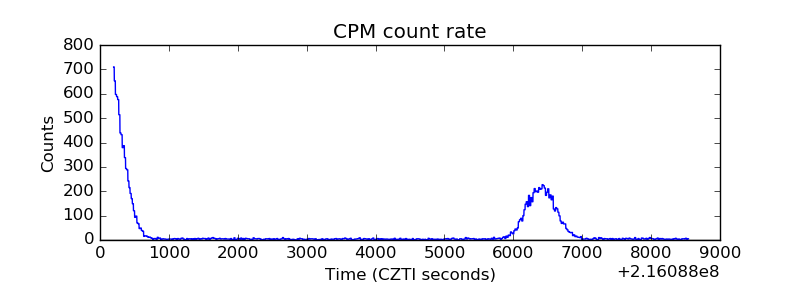 |
| CZT Counter | 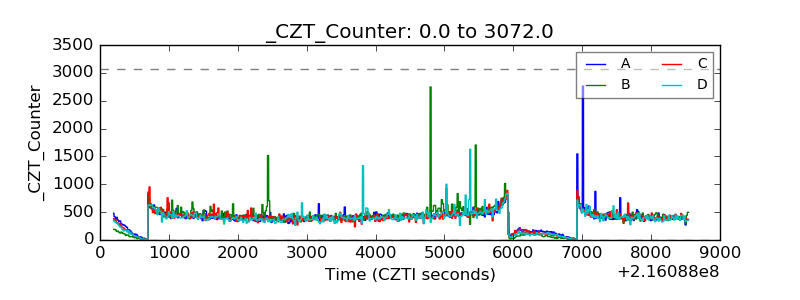 |
| +2.5 Volts monitor |  |
| +5 Volts monitor |  |
| _ROLL_ROT | 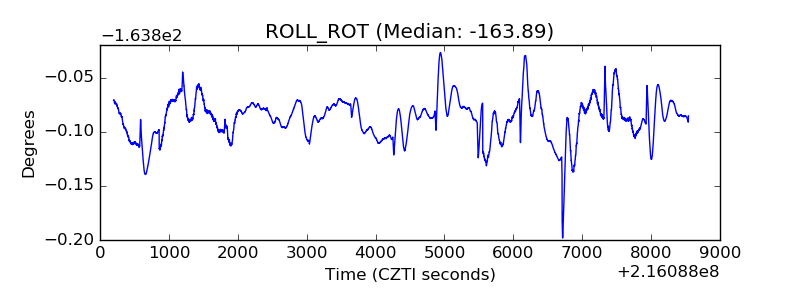 |
| _Roll_DEC | 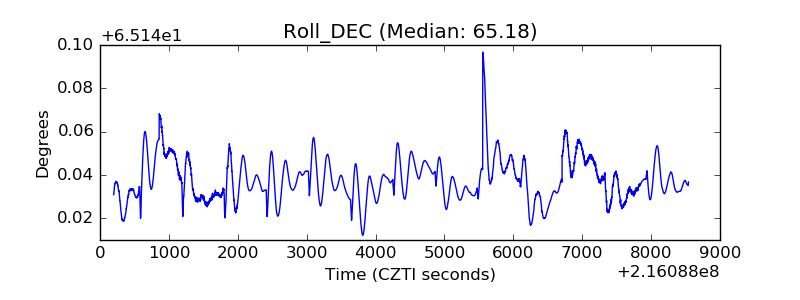 |
| _Roll_RA | 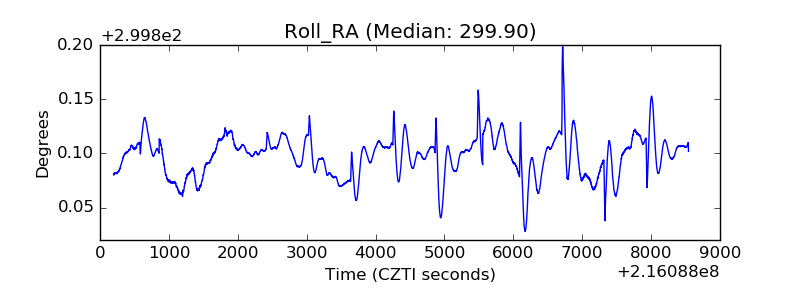 |
| Veto Counter | 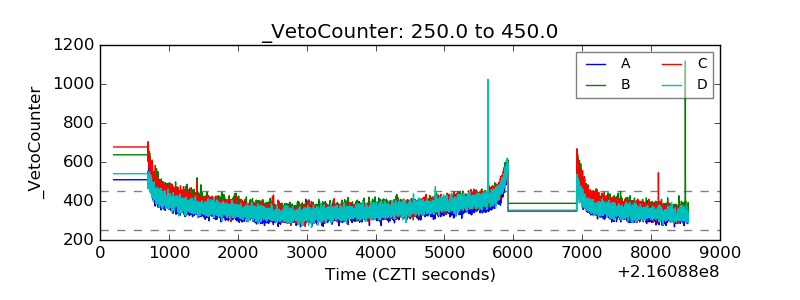 |