| Param | Original file | Final file |
|---|---|---|
| Filename | modeM0/AS1G06_086T01_9000000774_05995cztM0_level2.evt | modeM0/AS1G06_086T01_9000000774_05995cztM0_level2_quad_clean.evt |
| Size (bytes) | 434,773,440 | 121,766,400 |
| Size | 414.6 MB | 116.1 MB |
| Events in quadrant A | 3,260,627 | 803,114 |
| Events in quadrant B | 3,201,142 | 824,485 |
| Events in quadrant C | 2,995,248 | 807,629 |
| Events in quadrant D | 3,236,455 | 767,886 |
| Mode SS | |||
|---|---|---|---|
| Quadrant | BADHDUFLAG | Total packets | Discarded packets |
| A | 0 | 142 | 0 |
| B | 0 | 142 | 0 |
| C | 0 | 142 | 0 |
| D | 0 | 142 | 0 |
| Mode M9 | |||
|---|---|---|---|
| Quadrant | BADHDUFLAG | Total packets | Discarded packets |
| A | 0 | 5 | 0 |
| B | 0 | 5 | 0 |
| C | 0 | 5 | 0 |
| D | 0 | 5 | 0 |
| Mode M0 | |||
|---|---|---|---|
| Quadrant | BADHDUFLAG | Total packets | Discarded packets |
| A | 0 | 14910 | 4 |
| B | 0 | 14497 | 1 |
| C | 0 | 14199 | 1 |
| D | 0 | 15102 | 1 |
| Quadrant | Total seconds | Saturated seconds | Saturation percentage |
|---|---|---|---|
| A | 6954 | 134 | 1.926949% |
| B | 6955 | 127 | 1.826024% |
| C | 6955 | 59 | 0.848311% |
| D | 6955 | 167 | 2.401150% |
Noise dominated data is calculated using 1-second bins in cleaned event files. If a bin has >2000 counts, and if more than 50% of those come from <1% of pixels, then it is considered to be noise-dominated and hence unusable.
| Quadrant | # 1 sec bins | Bins with >0 counts | Bins with >2000 counts | High rate bins dominated by noise | Noise dominated (total time) | Noise dominated (detector-on time) | Marked lightcurve |
|---|---|---|---|---|---|---|---|
| A | 7515 | 6956 | 36 | 36 | 0.48% | 0.52% | 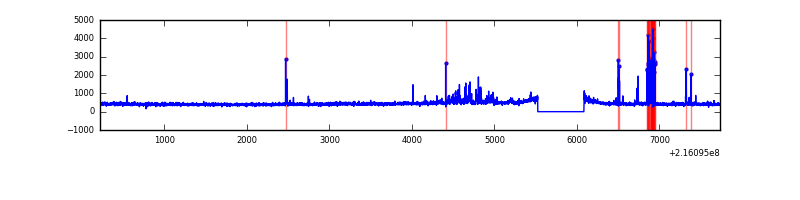 |
| B | 7515 | 6956 | 4 | 4 | 0.05% | 0.06% | 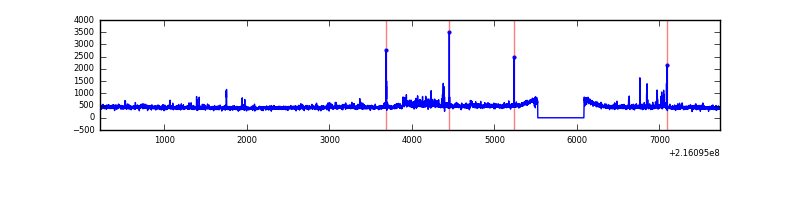 |
| C | 7515 | 6956 | 0 | 0 | 0.00% | 0.00% | 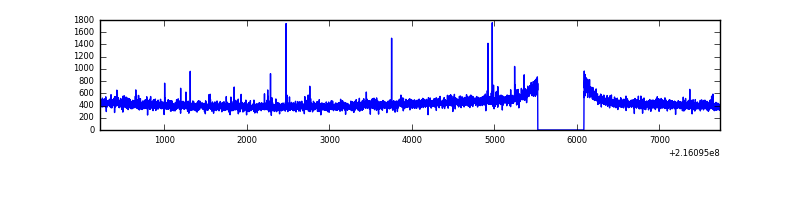 |
| D | 7515 | 6956 | 131 | 131 | 1.74% | 1.88% | 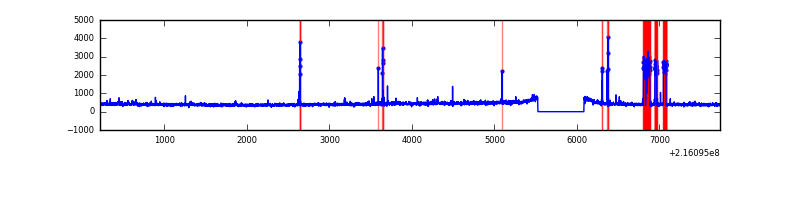 |
Top three noisy pixels from each quadrant. If the there are fewer than three noisy pixels in the level2.evt file, extra rows are filled as -1
| Pixel properties | Quadrant properties | ||||||
|---|---|---|---|---|---|---|---|
| Quadrant | DetID | PixID | Counts | Sigma | Mean | Median | Sigma |
| A | 4 | 2 | 152481 | 965.6 | 769 | 749 | 157.1 |
| A | 13 | 251 | 112711 | 712.51 | 769 | 749 | 157.1 |
| A | 7 | 16 | 28365 | 175.74 | 769 | 749 | 157.1 |
| B | 15 | 204 | 48365 | 317.71 | 783 | 762 | 149.8 |
| B | 0 | 214 | 42878 | 281.09 | 783 | 762 | 149.8 |
| B | 15 | 85 | 41488 | 271.81 | 783 | 762 | 149.8 |
| C | 12 | 4 | 21919 | 121.68 | 754 | 756 | 173.9 |
| C | 9 | 54 | 9952 | 52.87 | 754 | 756 | 173.9 |
| C | 1 | 16 | 8338 | 43.59 | 754 | 756 | 173.9 |
| D | 5 | 239 | 275441 | 1512.83 | 743 | 718 | 181.6 |
| D | 1 | 239 | 34268 | 184.75 | 743 | 718 | 181.6 |
| D | 2 | 14 | 24607 | 131.55 | 743 | 718 | 181.6 |
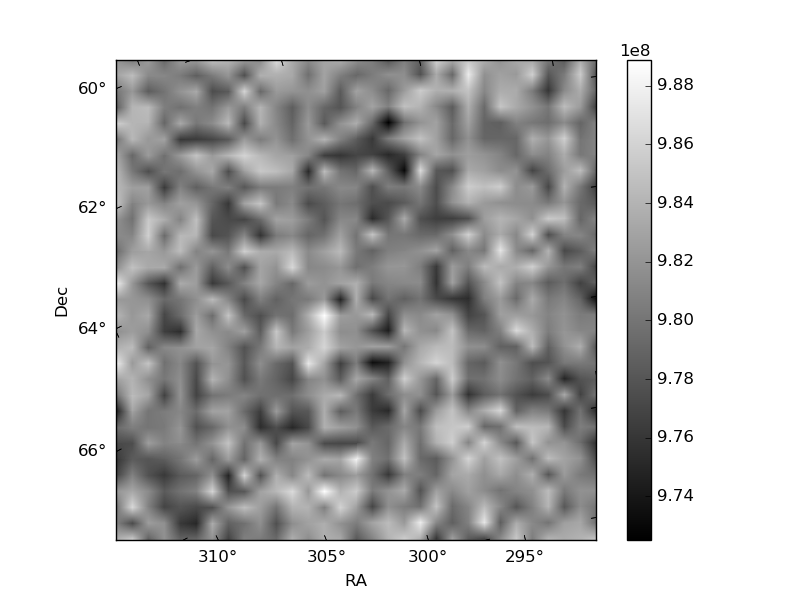
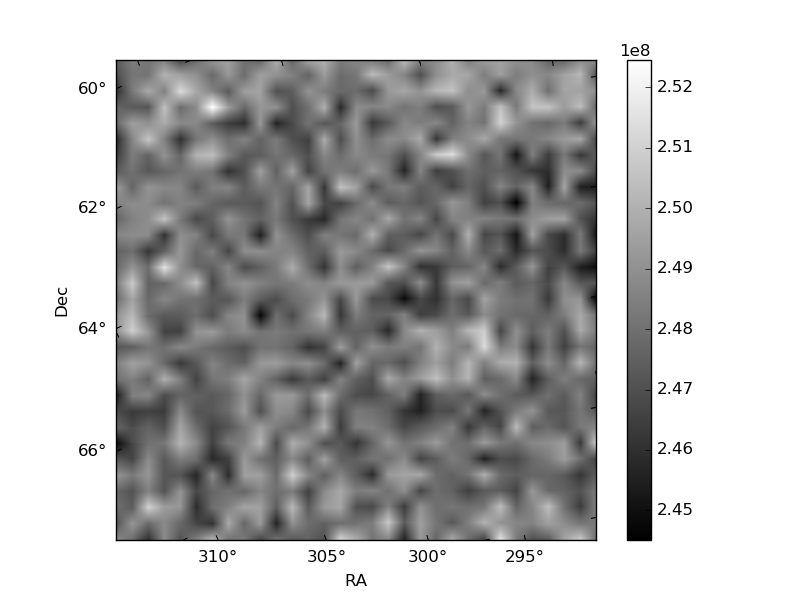
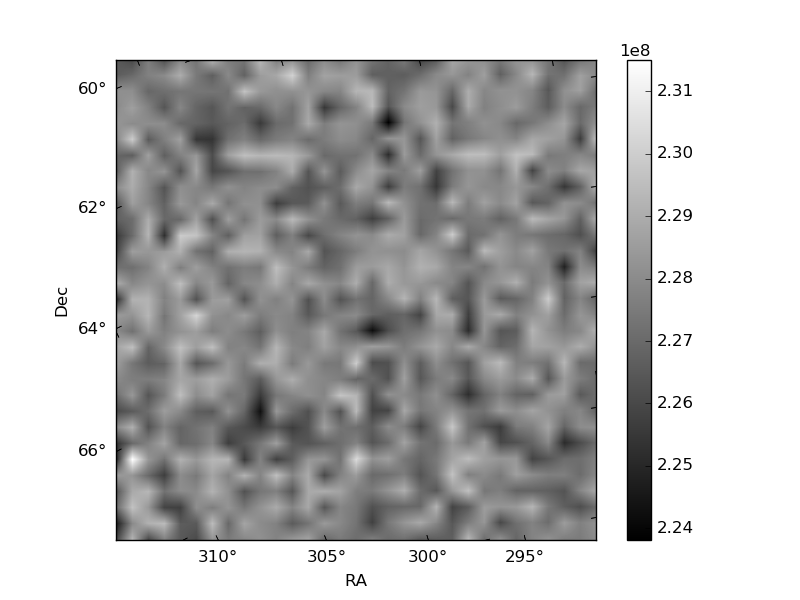
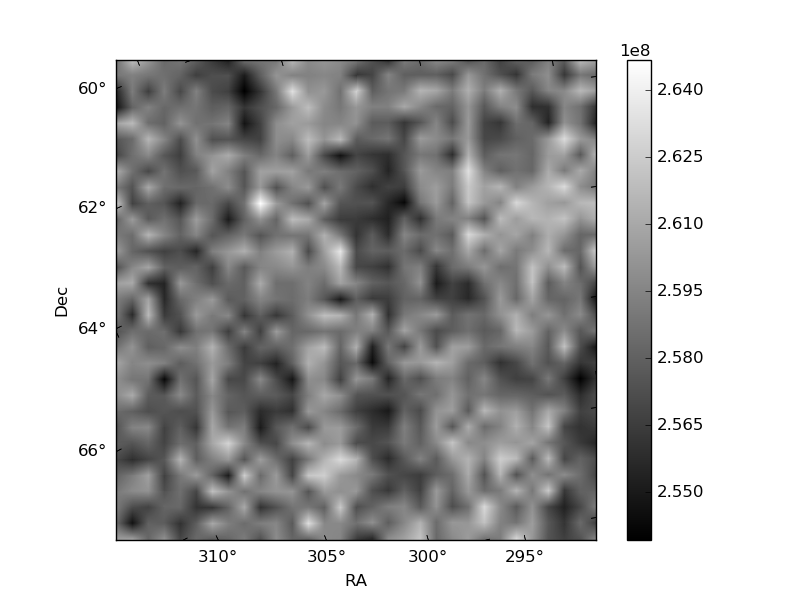
Histogram calculated using DETX and DETY for each event in the final _common_clean file
| Quadrant A | 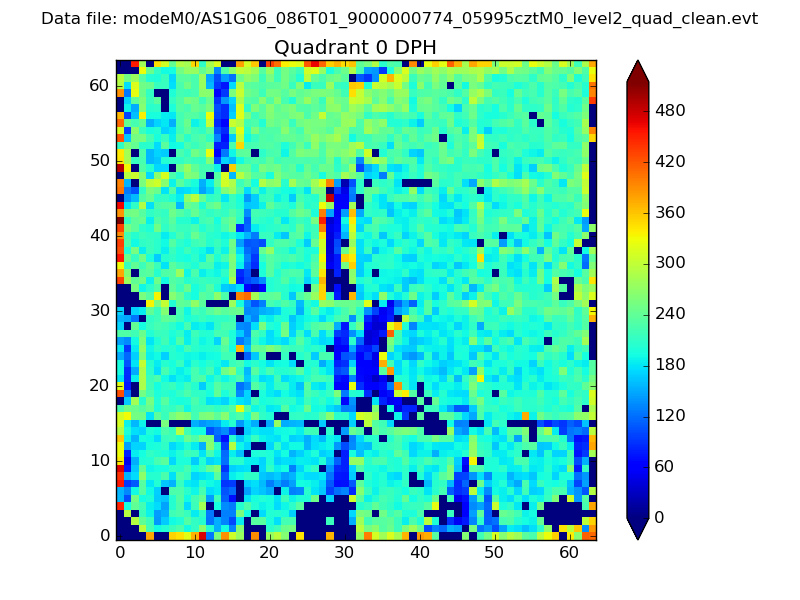 |
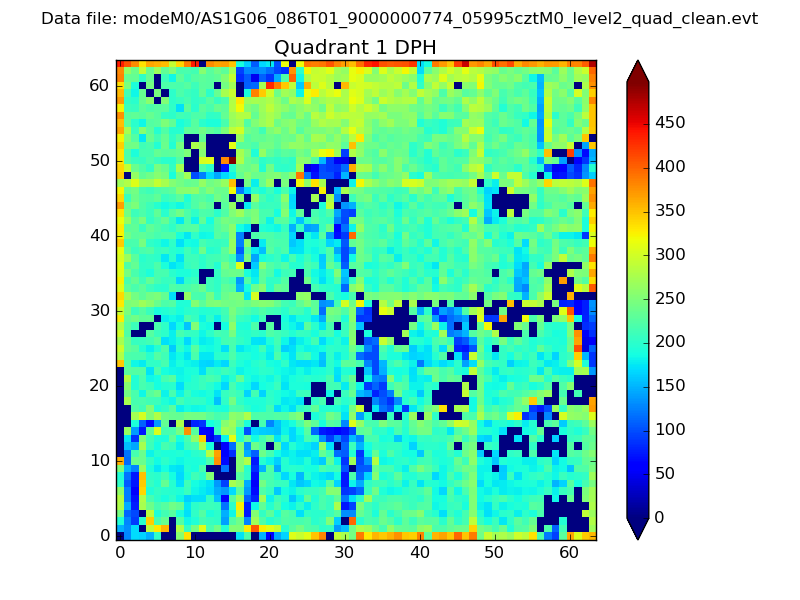 |
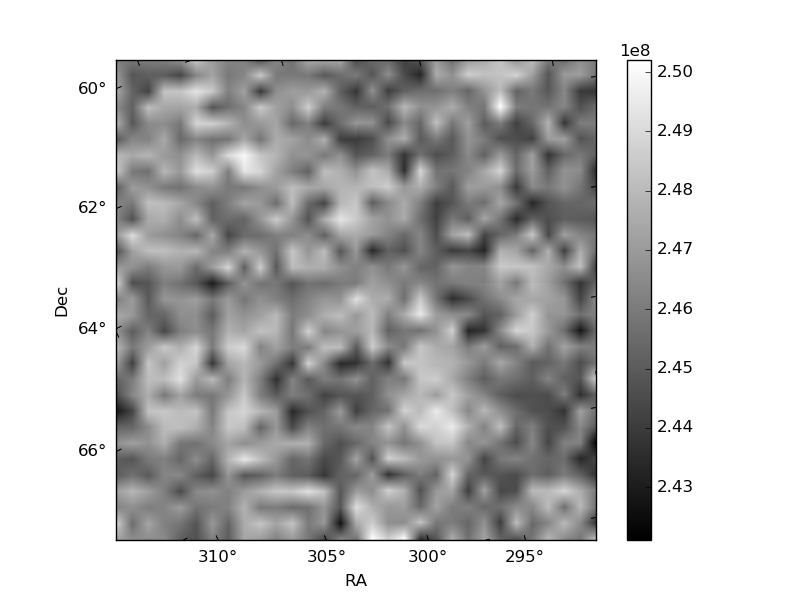
Quadrant B |
|---|---|---|---|
| Quadrant D | 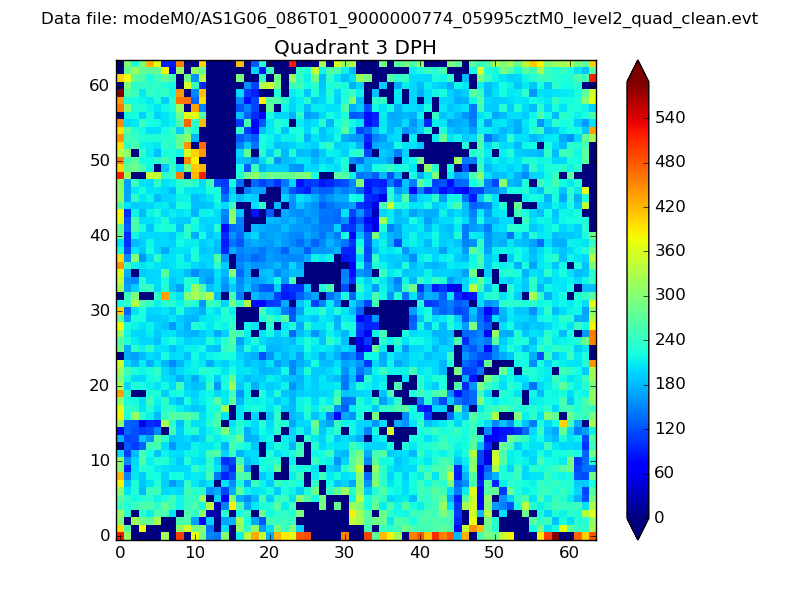 |
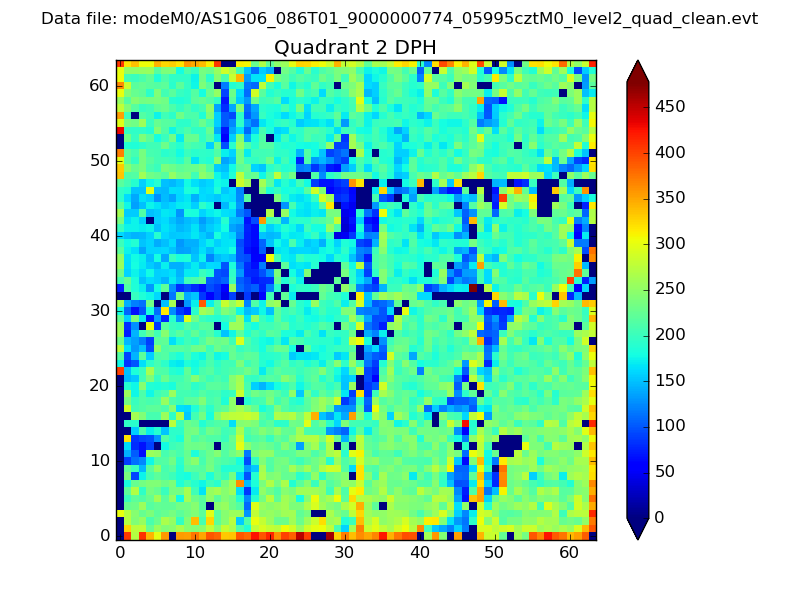 |
Quadrant C |
| Plot type | Count rate plots | Images |
|---|---|---|
| Comparison with Poisson distribution Blue bars denote a histogram of data divided into 1 sec bins. Red curve is a Poisson curve with rate = median count rate of data. |
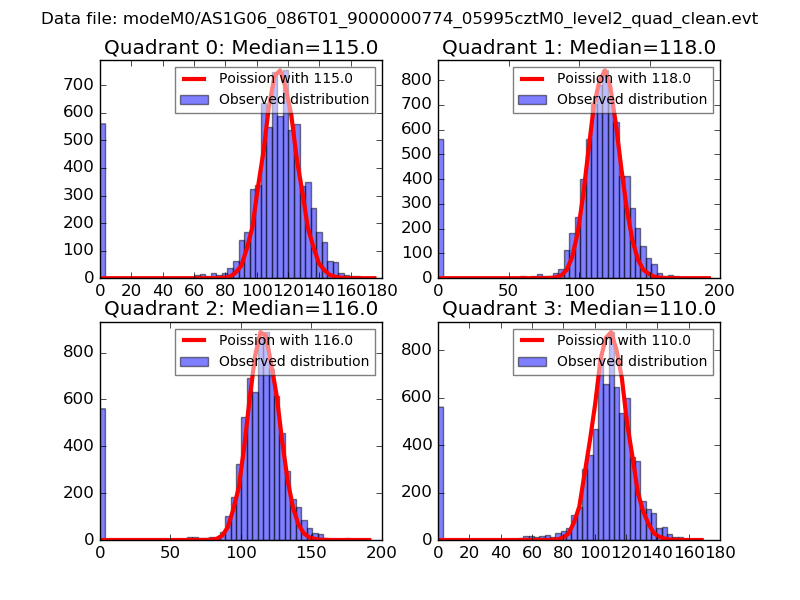 |
 |
| Quadrant-wise count rates Data is divided into 100 sec bins |
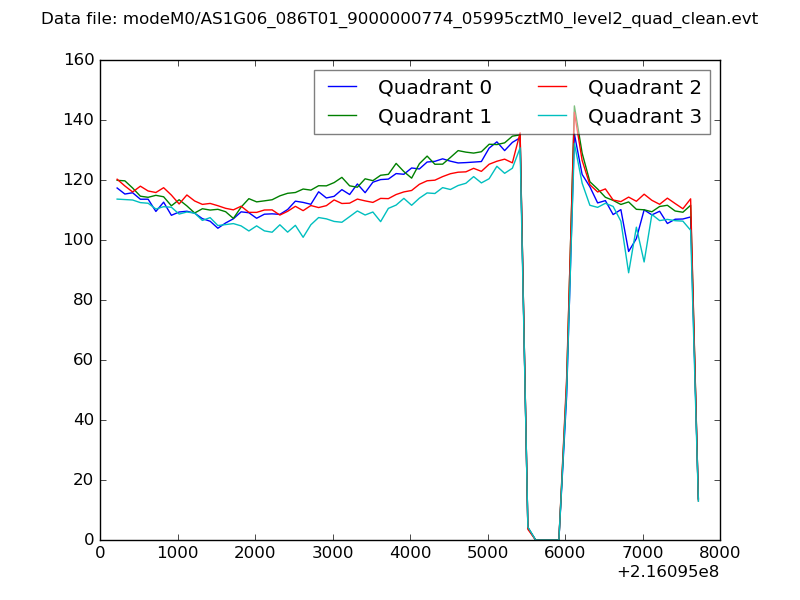 |
|
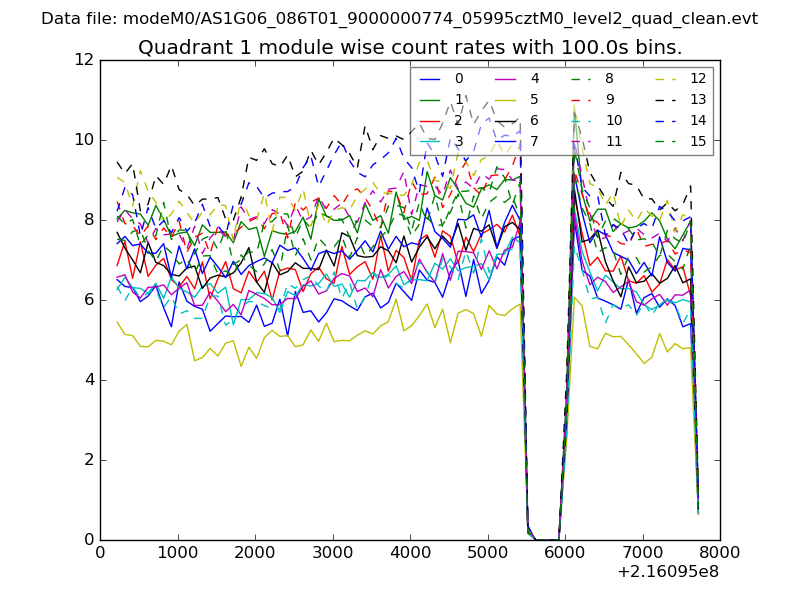
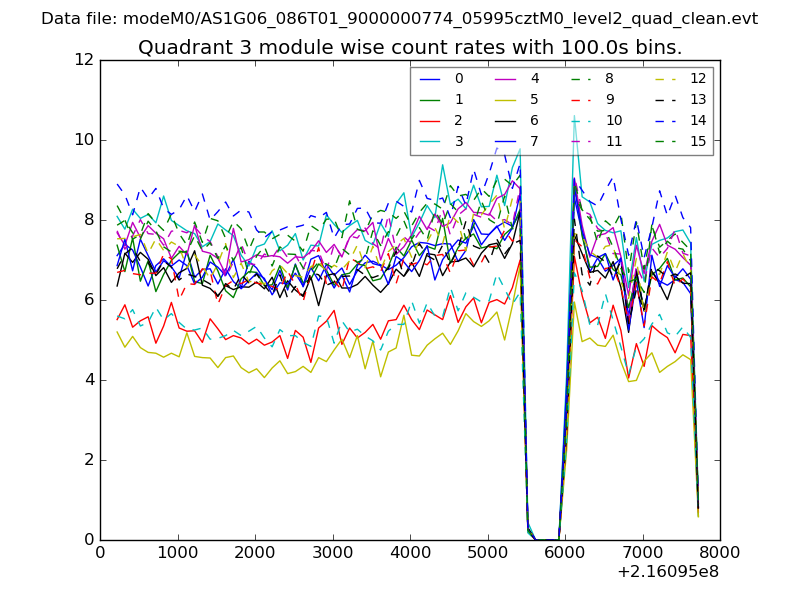
| Module-wise count rates for Quadrant A Data is divided into 100 sec bins |
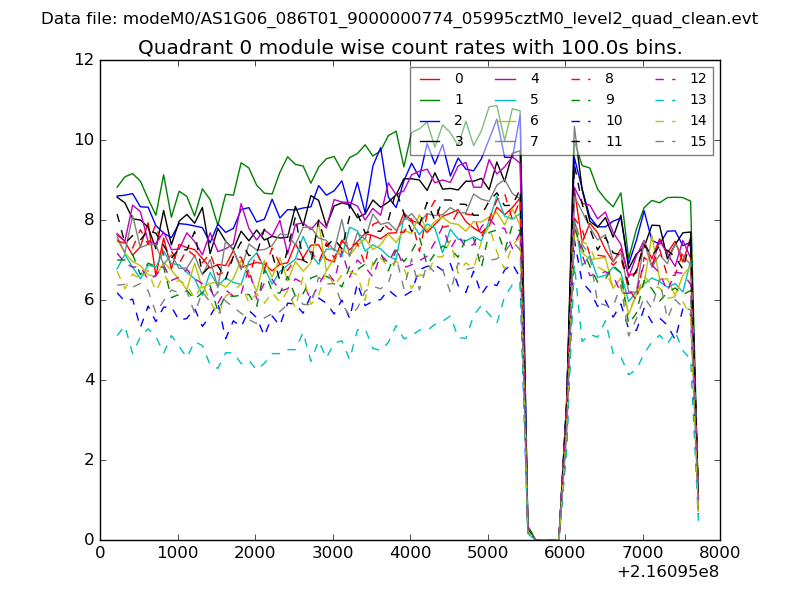 |
 |
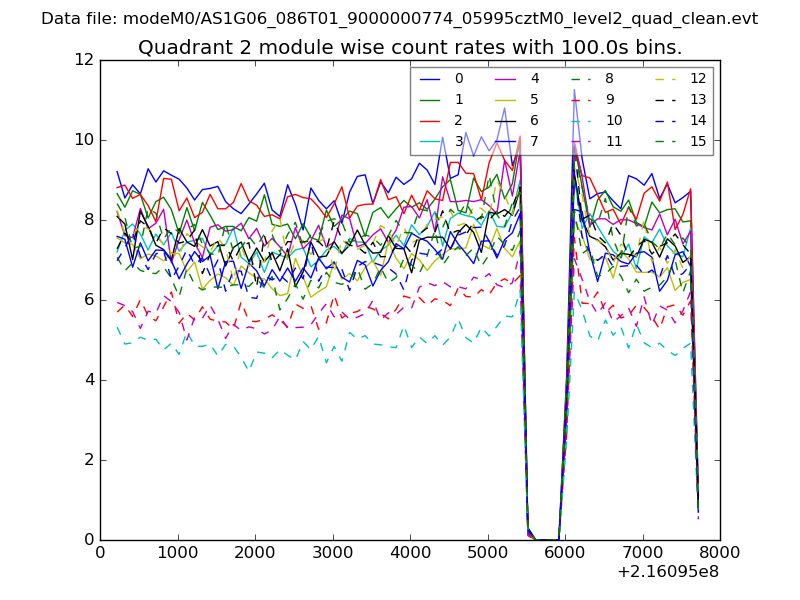
| Module-wise count rates for Quadrant B Data is divided into 100 sec bins |
 |
 |
| Module-wise count rates for Quadrant C Data is divided into 100 sec bins |
 |
 |
| Module-wise count rates for Quadrant D Data is divided into 100 sec bins |
 |
 |
| Parameter | Plot |
|---|---|
| CZT HV Monitor | 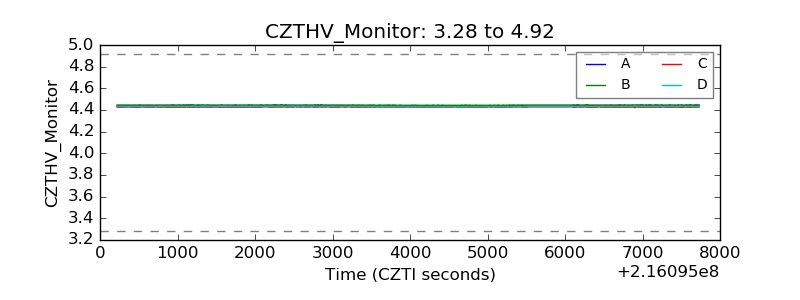 |
| D_VDD | 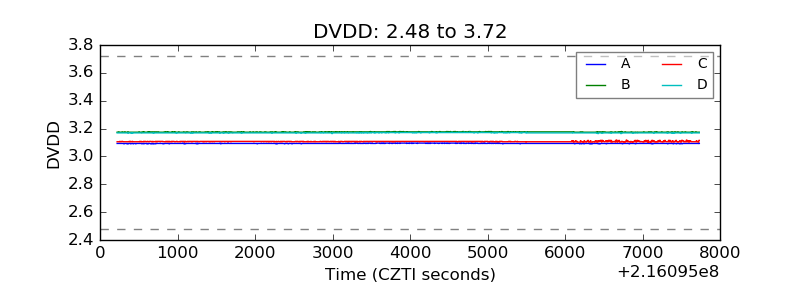 |
| Temperature 1 | 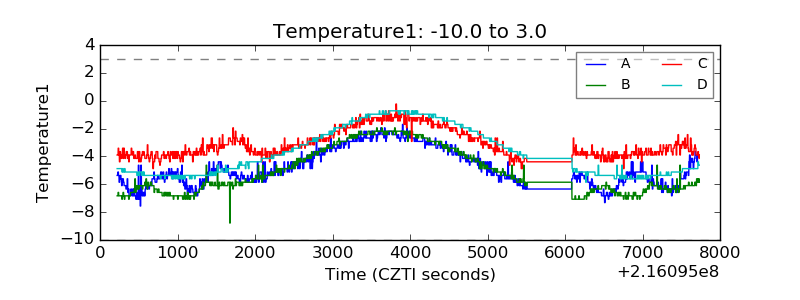 |
| Veto HV Monitor | 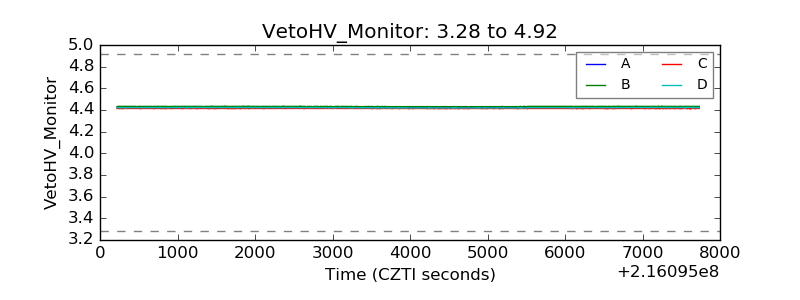 |
| Veto LLD | 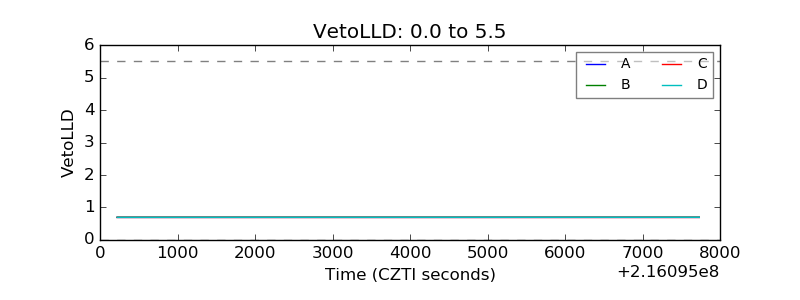 |
| Alpha Counter | 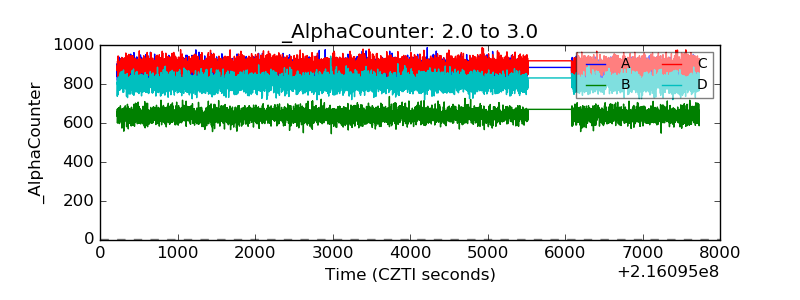 |
| _CPM_Rate | 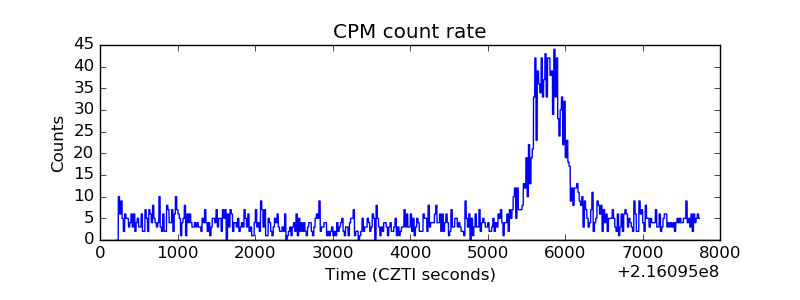 |
| CZT Counter | 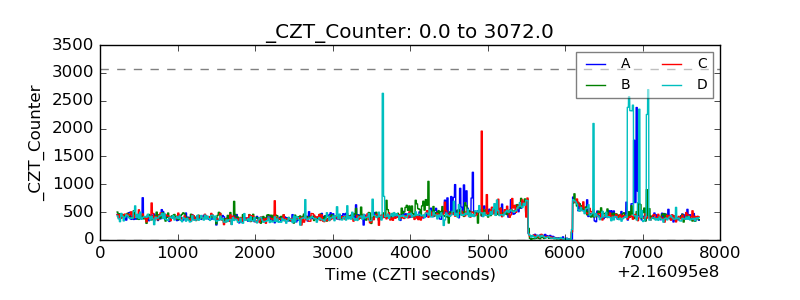 |
| +2.5 Volts monitor |  |
| +5 Volts monitor |  |
| _ROLL_ROT | 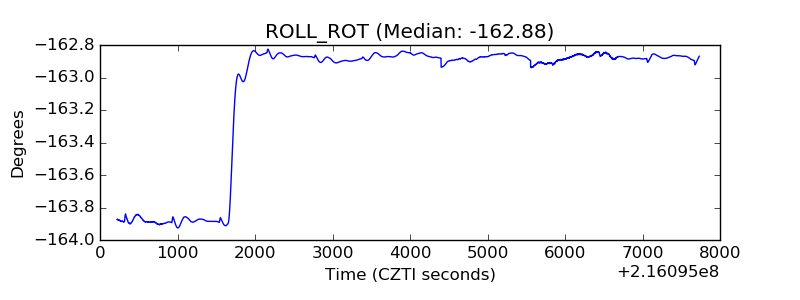 |
| _Roll_DEC | 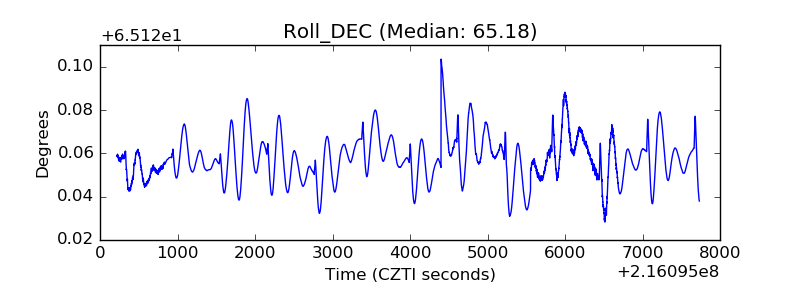 |
| _Roll_RA | 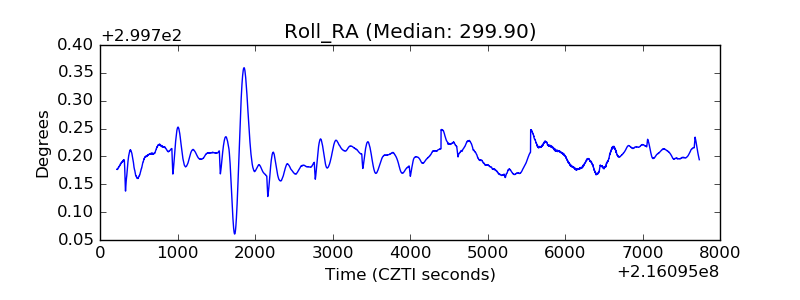 |
| Veto Counter | 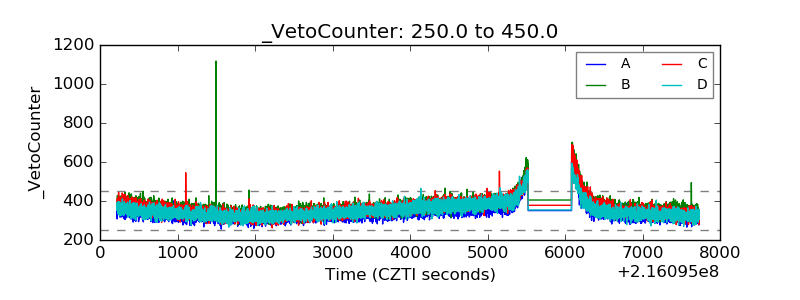 |