| Param | Original file | Final file |
|---|---|---|
| Filename | modeM0/AS1G06_086T01_9000000774_06000cztM0_level2.evt | modeM0/AS1G06_086T01_9000000774_06000cztM0_level2_quad_clean.evt |
| Size (bytes) | 12,746,880 | 3,922,560 |
| Size | 12.2 MB | 3.7 MB |
| Events in quadrant A | 70,006 | 16,839 |
| Events in quadrant B | 110,242 | 27,102 |
| Events in quadrant C | 100,180 | 27,624 |
| Events in quadrant D | 86,993 | 23,075 |
| Mode SS | |||
|---|---|---|---|
| Quadrant | BADHDUFLAG | Total packets | Discarded packets |
| A | 0 | 48 | 43 |
| B | 0 | 48 | 42 |
| C | 0 | 47 | 43 |
| D | 0 | 49 | 45 |
| Mode M0 | |||
|---|---|---|---|
| Quadrant | BADHDUFLAG | Total packets | Discarded packets |
| A | 0 | 6680 | 6359 |
| B | 0 | 4970 | 4487 |
| C | 0 | 4746 | 4243 |
| D | 0 | 4779 | 4335 |
| Quadrant | Total seconds | Saturated seconds | Saturation percentage |
|---|---|---|---|
| A | 151 | 1 | 0.662252% |
| B | 237 | 1 | 0.421941% |
| C | 252 | 0 | 0.000000% |
| D | 222 | 0 | 0.000000% |
Noise dominated data is calculated using 1-second bins in cleaned event files. If a bin has >2000 counts, and if more than 50% of those come from <1% of pixels, then it is considered to be noise-dominated and hence unusable.
| Quadrant | # 1 sec bins | Bins with >0 counts | Bins with >2000 counts | High rate bins dominated by noise | Noise dominated (total time) | Noise dominated (detector-on time) | Marked lightcurve |
|---|---|---|---|---|---|---|---|
| A | 2099 | 268 | 0 | 0 | 0.00% | 0.00% | 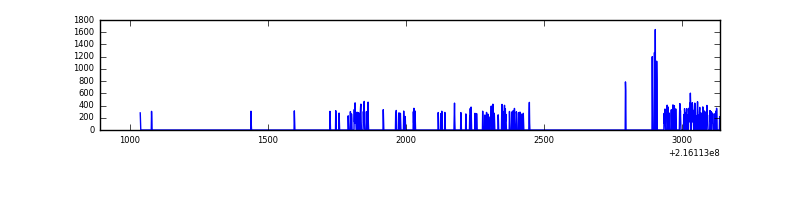 |
| B | 2220 | 415 | 0 | 0 | 0.00% | 0.00% | 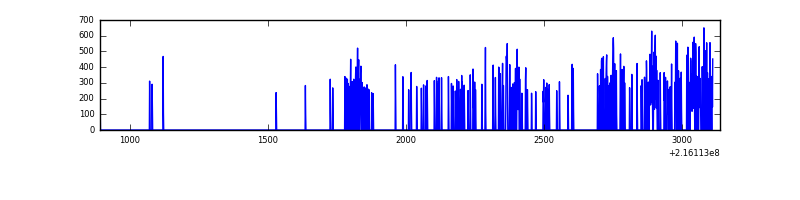 |
| C | 2238 | 438 | 0 | 0 | 0.00% | 0.00% | 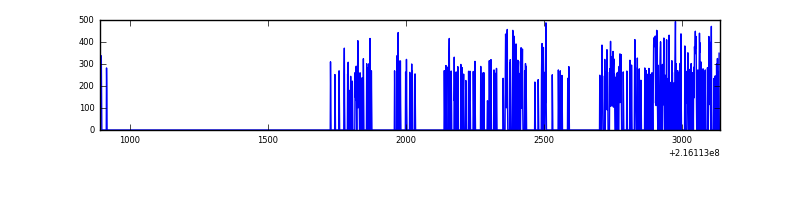 |
| D | 2215 | 382 | 0 | 0 | 0.00% | 0.00% | 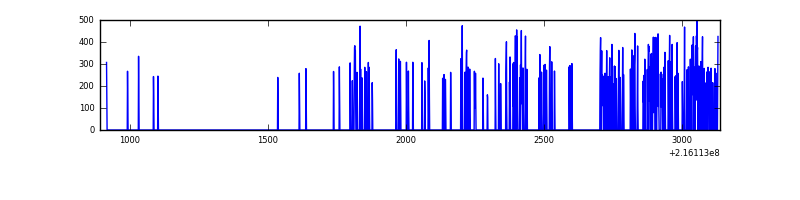 |
Top three noisy pixels from each quadrant. If the there are fewer than three noisy pixels in the level2.evt file, extra rows are filled as -1
| Pixel properties | Quadrant properties | ||||||
|---|---|---|---|---|---|---|---|
| Quadrant | DetID | PixID | Counts | Sigma | Mean | Median | Sigma |
| A | 15 | 236 | 7538 | 1429.85 | 16 | 15 | 5.3 |
| A | 0 | 226 | 169 | 29.27 | 16 | 15 | 5.3 |
| A | 12 | 194 | 155 | 26.61 | 16 | 15 | 5.3 |
| B | 15 | 204 | 6235 | 899.09 | 25 | 24 | 6.9 |
| B | 0 | 214 | 1898 | 271.28 | 25 | 24 | 6.9 |
| B | 4 | 81 | 1669 | 238.13 | 25 | 24 | 6.9 |
| C | 8 | 128 | 609 | 75.62 | 25 | 25 | 7.7 |
| C | 8 | 112 | 309 | 36.77 | 25 | 25 | 7.7 |
| C | 13 | 61 | 219 | 25.12 | 25 | 25 | 7.7 |
| D | 1 | 239 | 1529 | 210.12 | 22 | 21 | 7.2 |
| D | 8 | 195 | 613 | 82.49 | 22 | 21 | 7.2 |
| D | 14 | 206 | 373 | 49.05 | 22 | 21 | 7.2 |
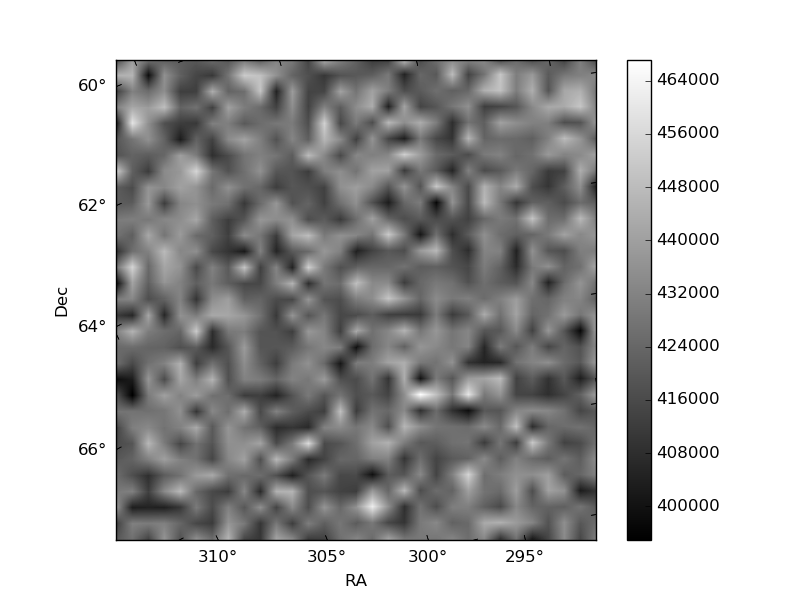
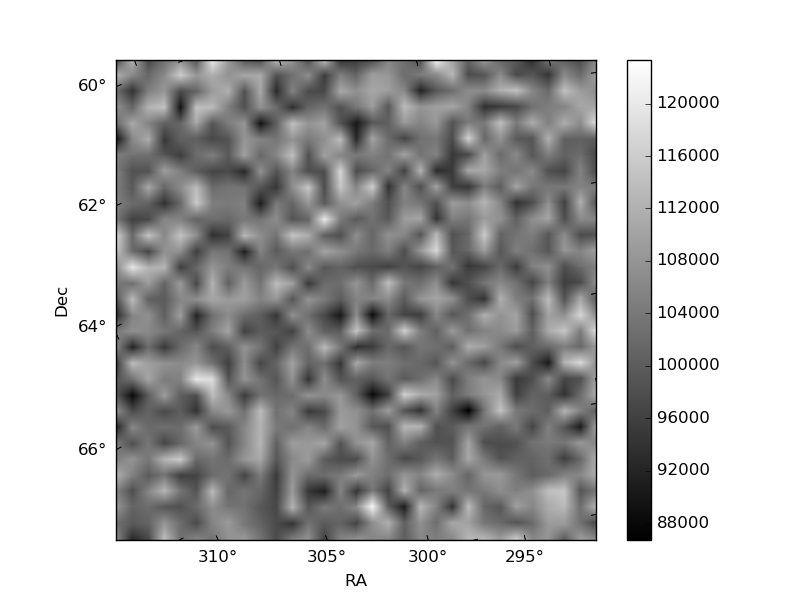
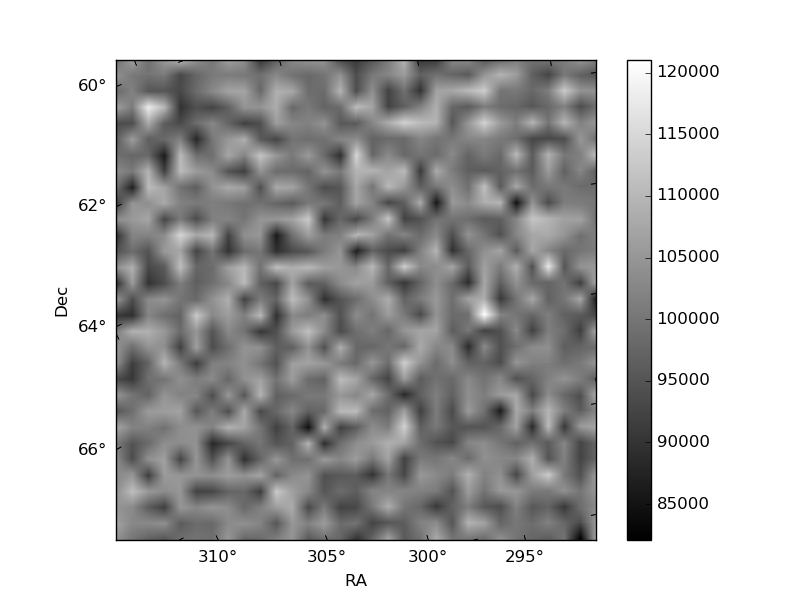
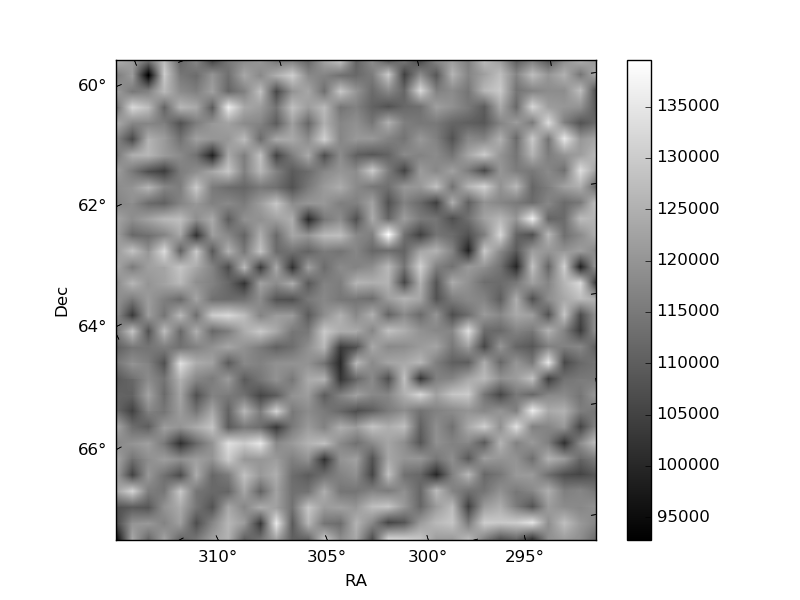
Histogram calculated using DETX and DETY for each event in the final _common_clean file
| Quadrant A | 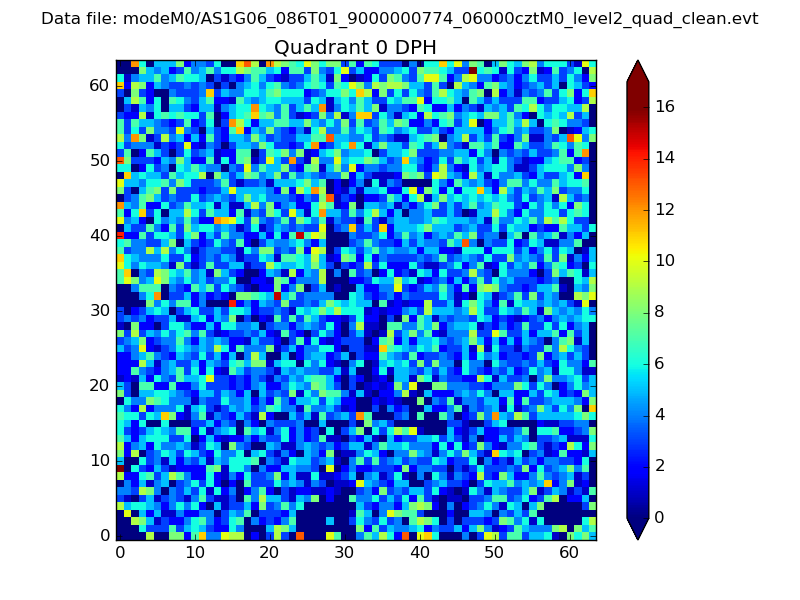 |
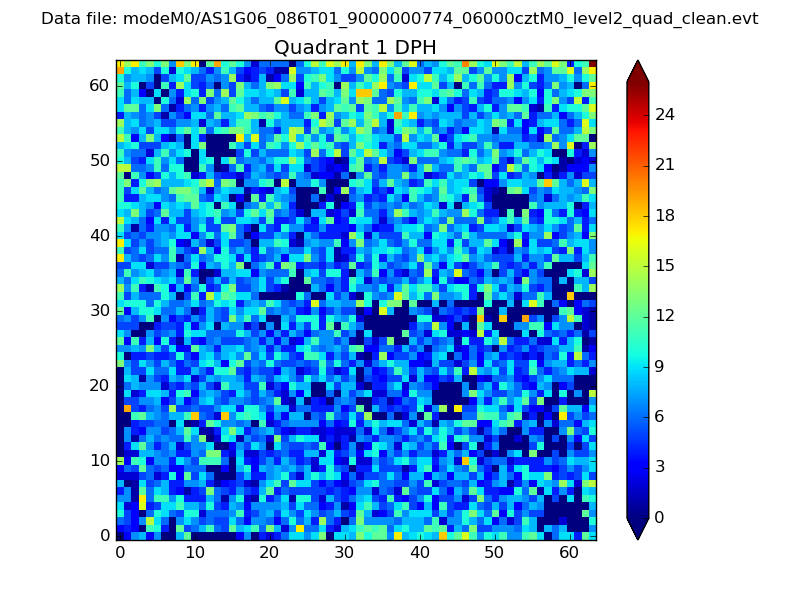 |
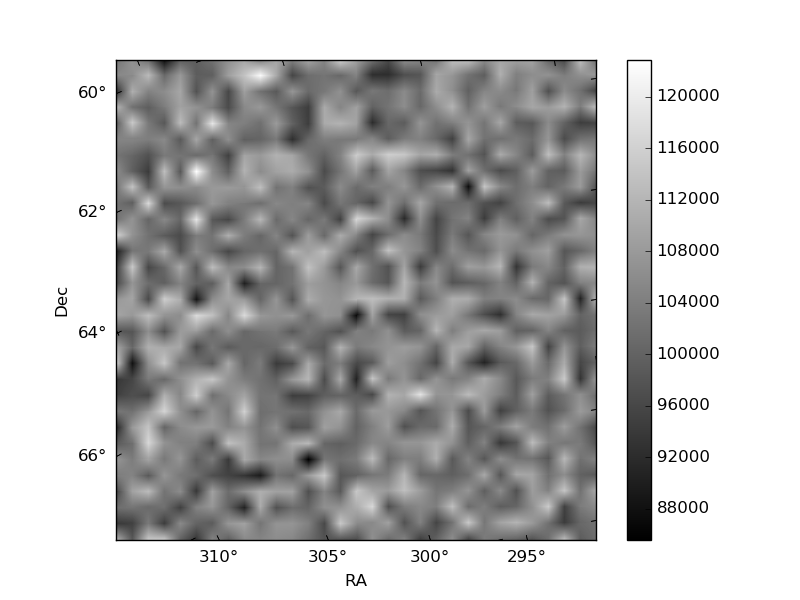
Quadrant B |
|---|---|---|---|
| Quadrant D | 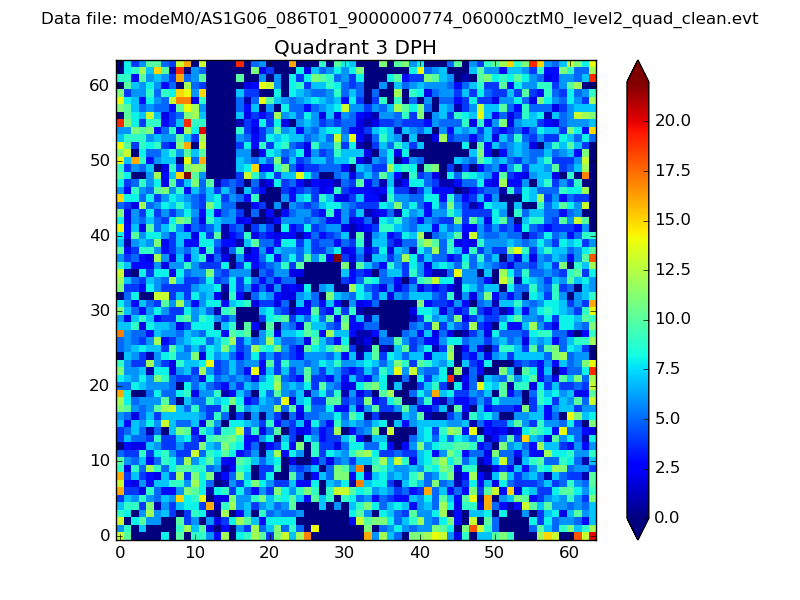 |
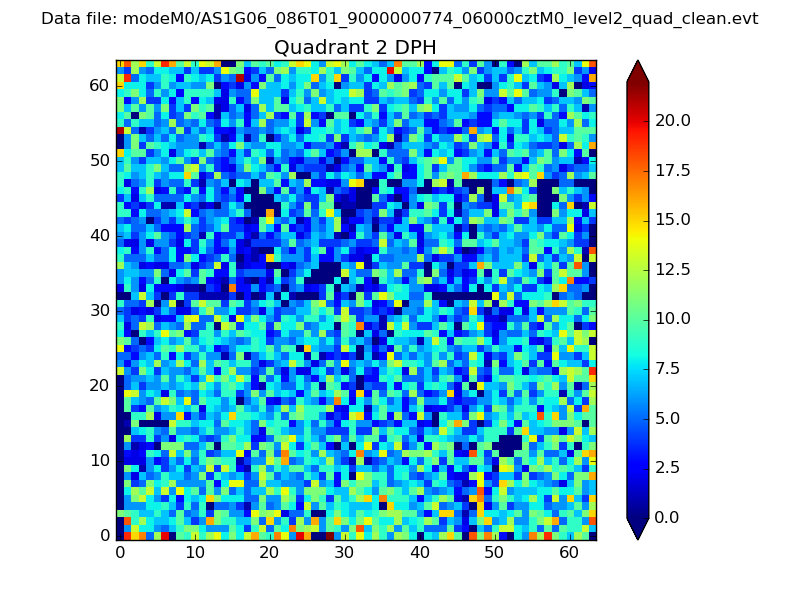 |
Quadrant C |
| Plot type | Count rate plots | Images |
|---|---|---|
| Comparison with Poisson distribution Blue bars denote a histogram of data divided into 1 sec bins. Red curve is a Poisson curve with rate = median count rate of data. |
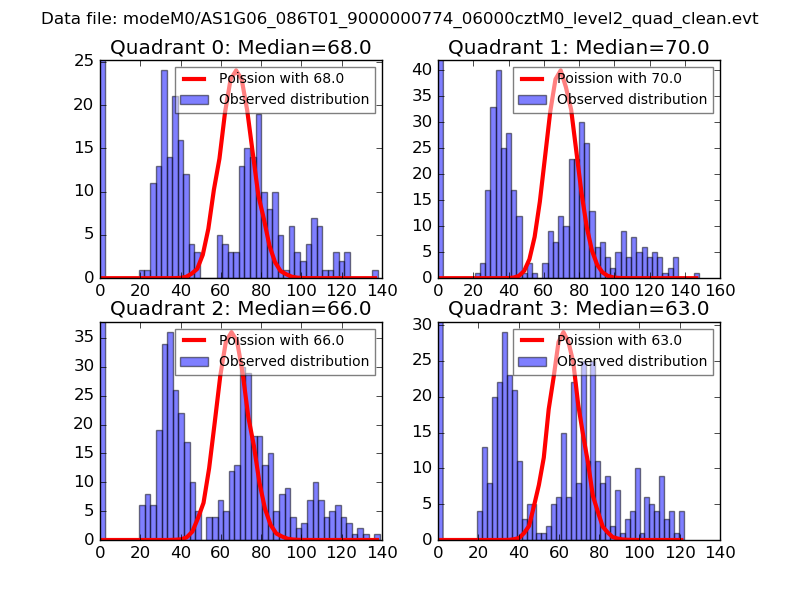 |
 |
| Quadrant-wise count rates Data is divided into 100 sec bins |
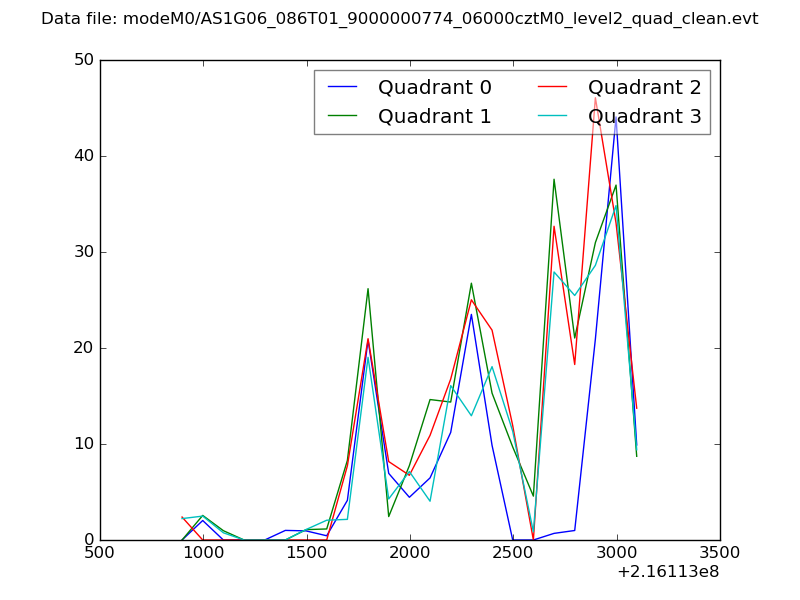 |
|
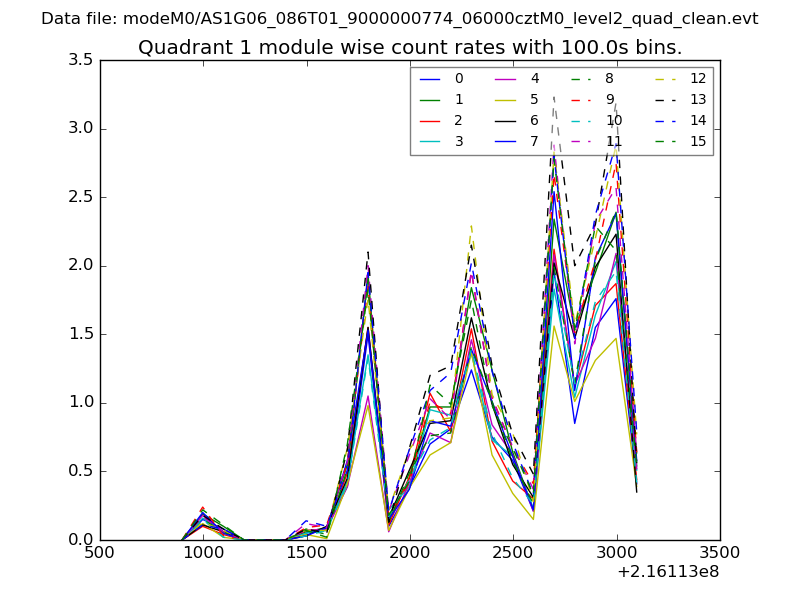
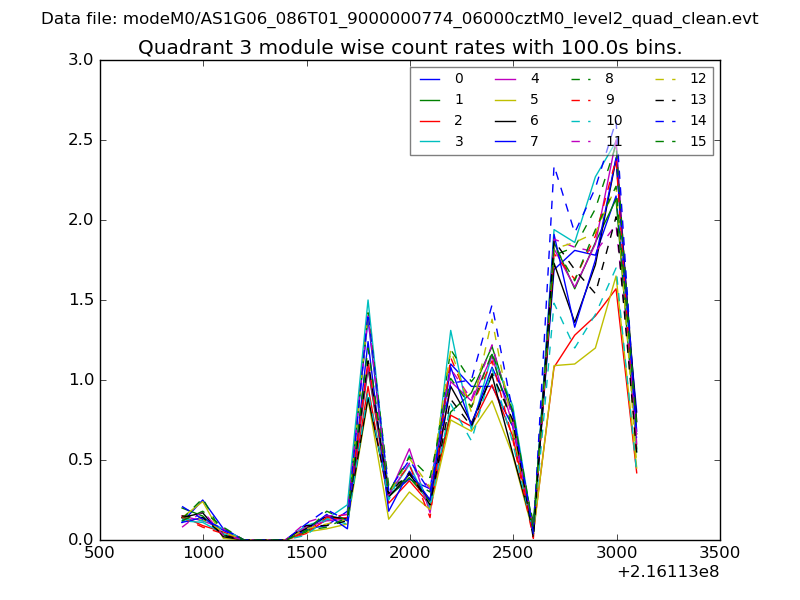
| Module-wise count rates for Quadrant A Data is divided into 100 sec bins |
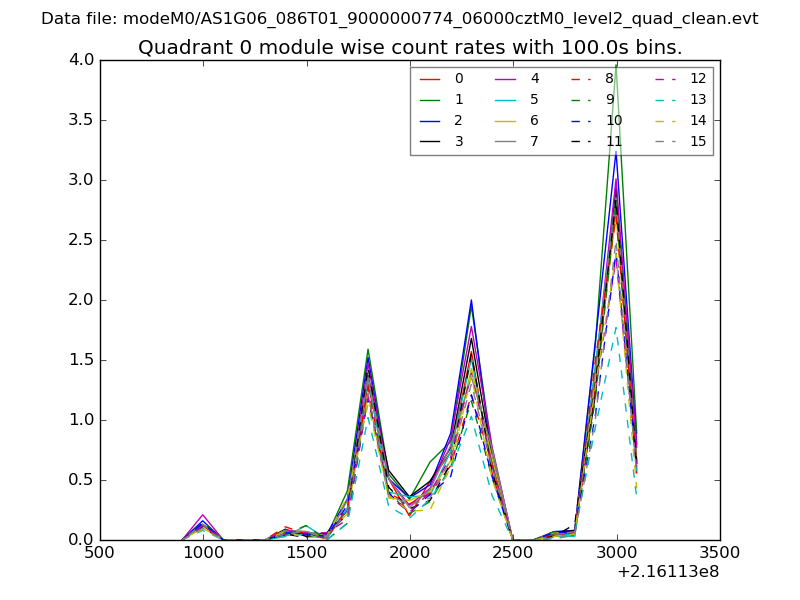 |
 |
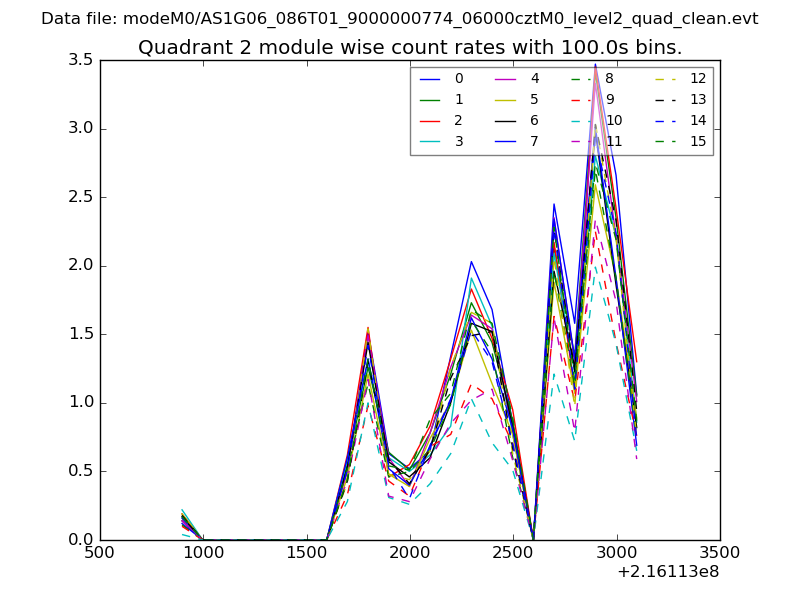
| Module-wise count rates for Quadrant B Data is divided into 100 sec bins |
 |
 |
| Module-wise count rates for Quadrant C Data is divided into 100 sec bins |
 |
 |
| Module-wise count rates for Quadrant D Data is divided into 100 sec bins |
 |
 |
| Parameter | Plot |
|---|---|
| CZT HV Monitor | 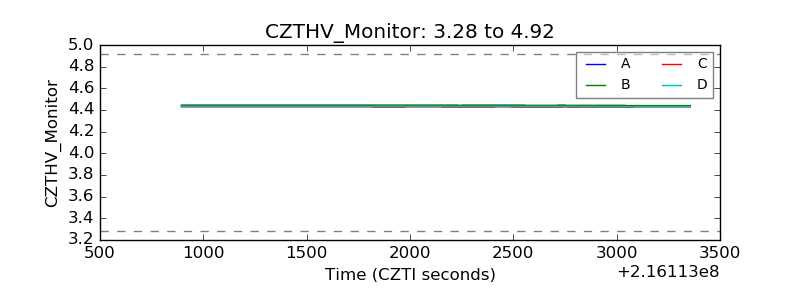 |
| D_VDD | 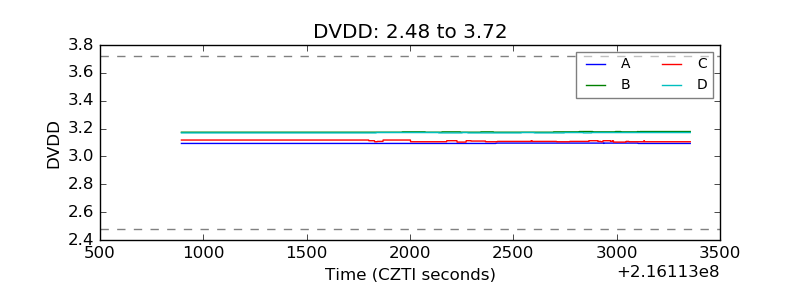 |
| Temperature 1 | 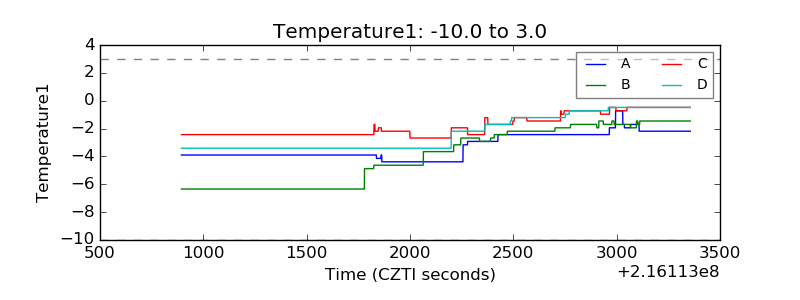 |
| Veto HV Monitor | 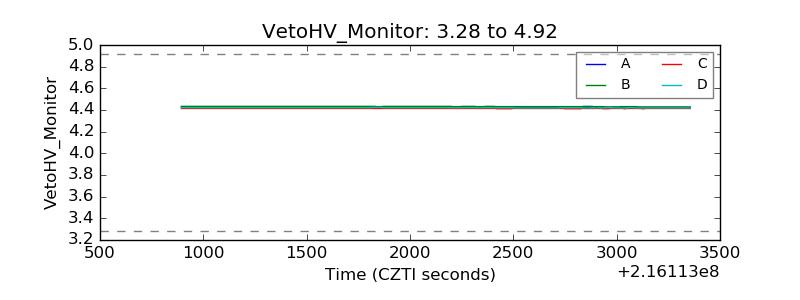 |
| Veto LLD | 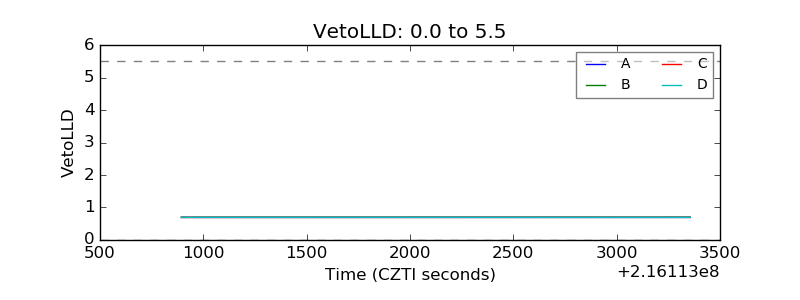 |
| Alpha Counter | 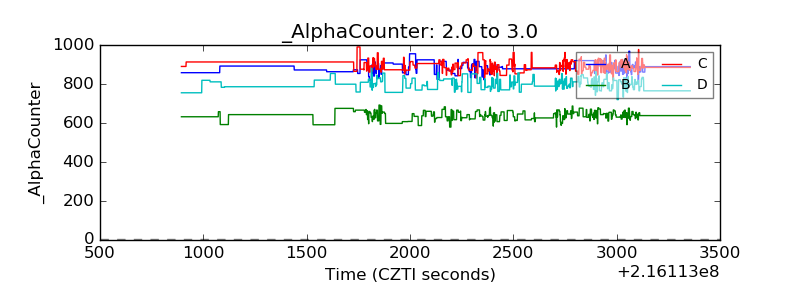 |
| _CPM_Rate | 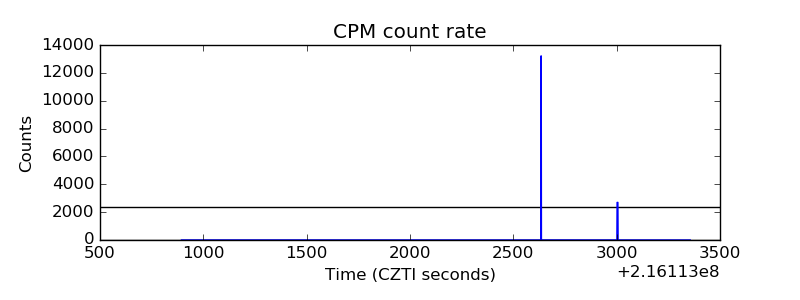 |
| CZT Counter | 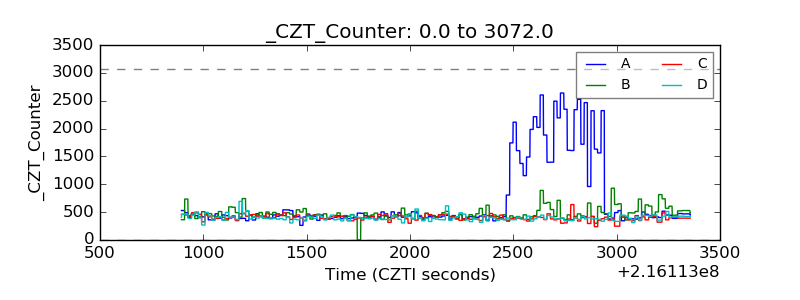 |
| +2.5 Volts monitor | 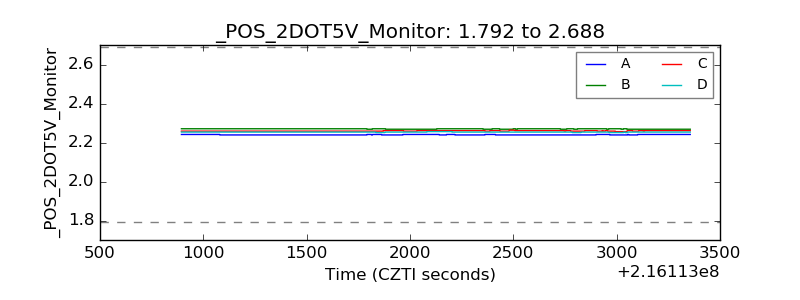 |
| +5 Volts monitor |  |
| _ROLL_ROT | 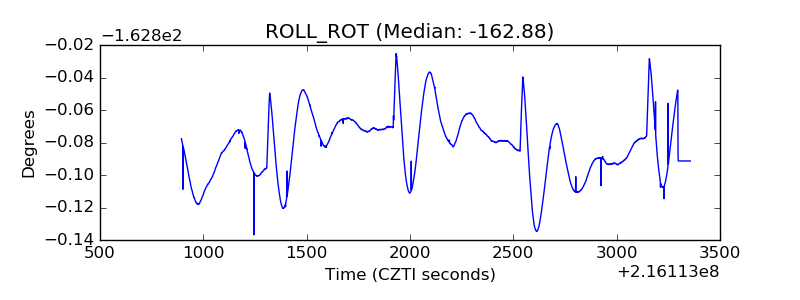 |
| _Roll_DEC | 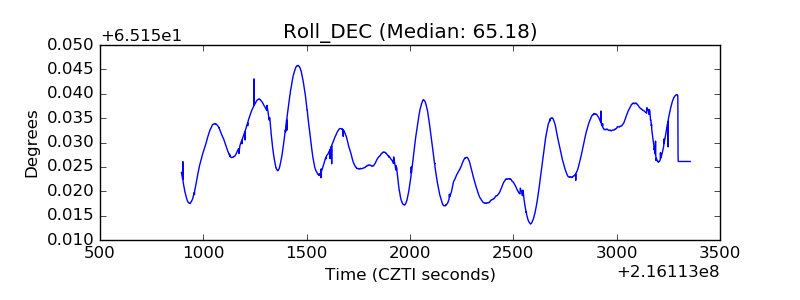 |
| _Roll_RA | 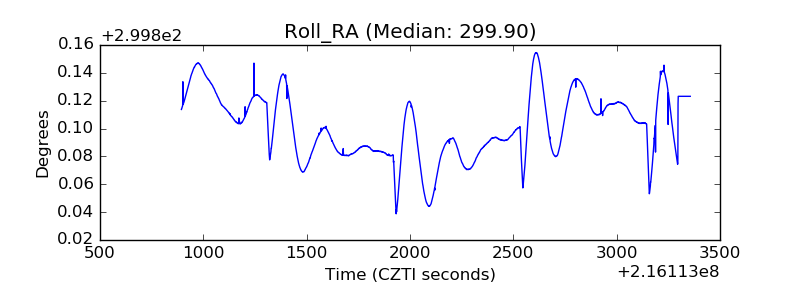 |
| Veto Counter | 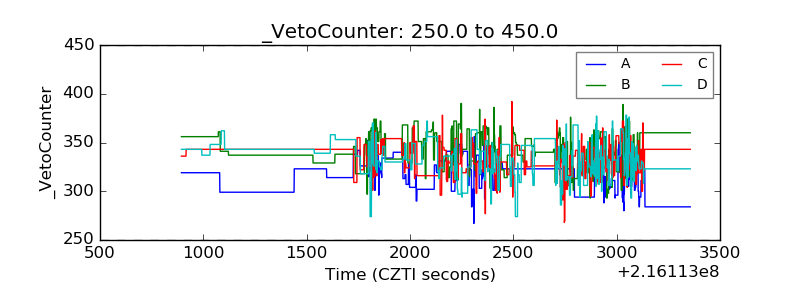 |