| Param | Original file | Final file |
|---|---|---|
| Filename | modeM0/AS1G06_086T01_9000000774_06002cztM0_level2.evt | modeM0/AS1G06_086T01_9000000774_06002cztM0_level2_quad_clean.evt |
| Size (bytes) | 2,171,995,200 | 599,330,880 |
| Size | 2.0 GB | 571.6 MB |
| Events in quadrant A | 16,491,574 | 4,003,088 |
| Events in quadrant B | 16,649,256 | 4,081,687 |
| Events in quadrant C | 14,976,318 | 3,951,455 |
| Events in quadrant D | 15,351,236 | 3,771,204 |
| Mode SS | |||
|---|---|---|---|
| Quadrant | BADHDUFLAG | Total packets | Discarded packets |
| A | 0 | 698 | 2 |
| B | 0 | 698 | 4 |
| C | 0 | 698 | 10 |
| D | 0 | 698 | 0 |
| Mode M9 | |||
|---|---|---|---|
| Quadrant | BADHDUFLAG | Total packets | Discarded packets |
| A | 0 | 37 | 0 |
| B | 0 | 37 | 0 |
| C | 0 | 37 | 1 |
| D | 0 | 37 | 0 |
| Mode M0 | |||
|---|---|---|---|
| Quadrant | BADHDUFLAG | Total packets | Discarded packets |
| A | 0 | 74102 | 686 |
| B | 0 | 73360 | 660 |
| C | 0 | 70524 | 591 |
| D | 0 | 72486 | 590 |
| Quadrant | Total seconds | Saturated seconds | Saturation percentage |
|---|---|---|---|
| A | 34153 | 783 | 2.292624% |
| B | 34151 | 472 | 1.382097% |
| C | 34174 | 269 | 0.787148% |
| D | 34181 | 588 | 1.720254% |
Noise dominated data is calculated using 1-second bins in cleaned event files. If a bin has >2000 counts, and if more than 50% of those come from <1% of pixels, then it is considered to be noise-dominated and hence unusable.
| Quadrant | # 1 sec bins | Bins with >0 counts | Bins with >2000 counts | High rate bins dominated by noise | Noise dominated (total time) | Noise dominated (detector-on time) | Marked lightcurve |
|---|---|---|---|---|---|---|---|
| A | 38057 | 34430 | 227 | 227 | 0.60% | 0.66% | 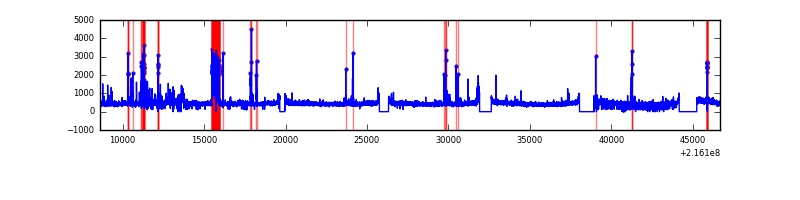 |
| B | 38057 | 34438 | 34 | 34 | 0.09% | 0.10% | 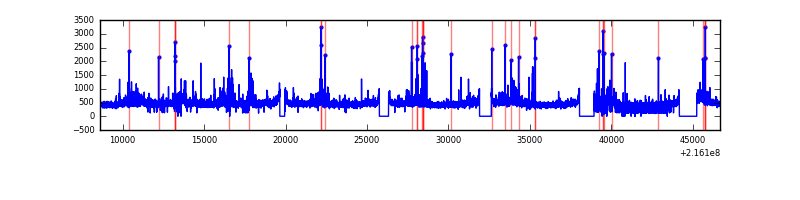 |
| C | 38057 | 34447 | 10 | 10 | 0.03% | 0.03% | 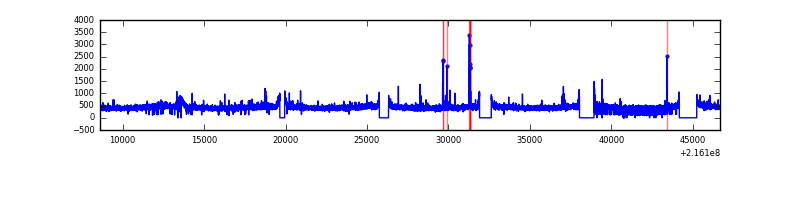 |
| D | 38057 | 34442 | 105 | 105 | 0.28% | 0.30% | 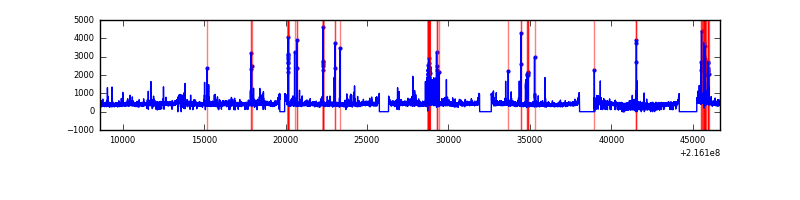 |
Top three noisy pixels from each quadrant. If the there are fewer than three noisy pixels in the level2.evt file, extra rows are filled as -1
| Pixel properties | Quadrant properties | ||||||
|---|---|---|---|---|---|---|---|
| Quadrant | DetID | PixID | Counts | Sigma | Mean | Median | Sigma |
| A | 15 | 236 | 731285 | 932.04 | 3868 | 3783 | 780.5 |
| A | 4 | 2 | 371150 | 470.65 | 3868 | 3783 | 780.5 |
| A | 15 | 234 | 115183 | 142.72 | 3868 | 3783 | 780.5 |
| B | 0 | 214 | 406251 | 539.35 | 3915 | 3819 | 746.1 |
| B | 15 | 204 | 266675 | 352.29 | 3915 | 3819 | 746.1 |
| B | 0 | 219 | 199061 | 261.67 | 3915 | 3819 | 746.1 |
| C | 9 | 54 | 122028 | 135.8 | 3770 | 3776 | 870.8 |
| C | 8 | 128 | 43092 | 45.15 | 3770 | 3776 | 870.8 |
| C | 1 | 16 | 39676 | 41.23 | 3770 | 3776 | 870.8 |
| D | 2 | 14 | 264386 | 284.53 | 3759 | 3632 | 916.4 |
| D | 2 | 63 | 210588 | 225.83 | 3759 | 3632 | 916.4 |
| D | 13 | 61 | 156540 | 166.85 | 3759 | 3632 | 916.4 |
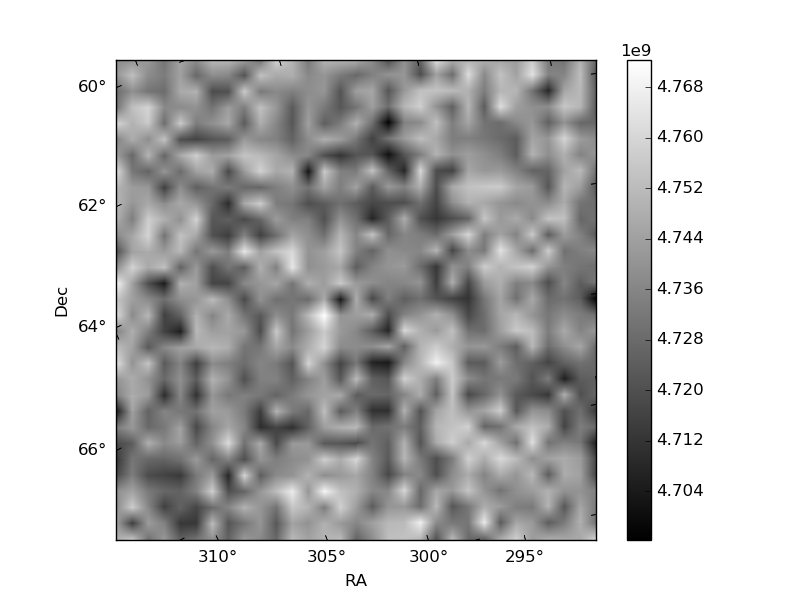
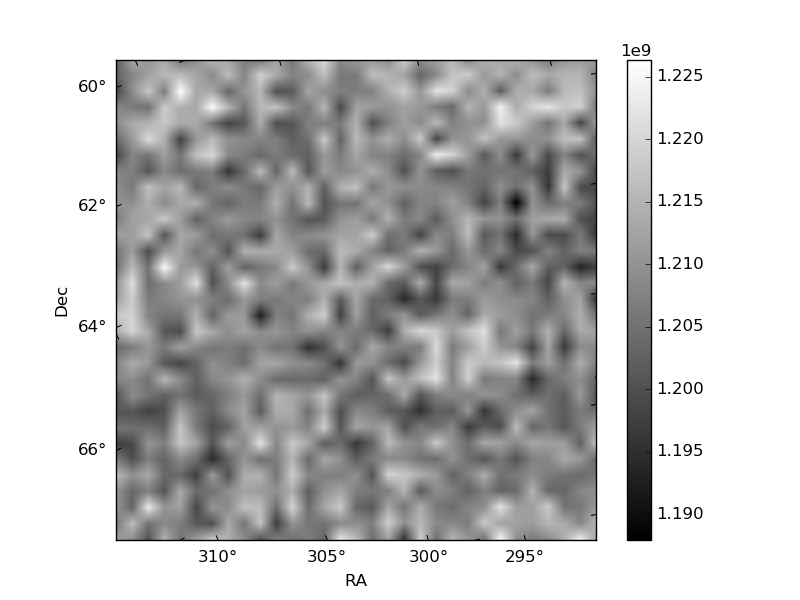
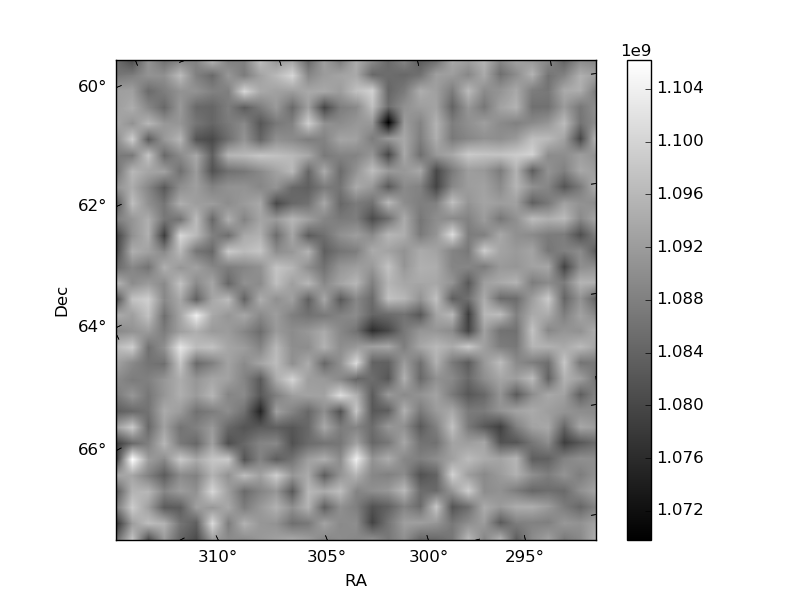
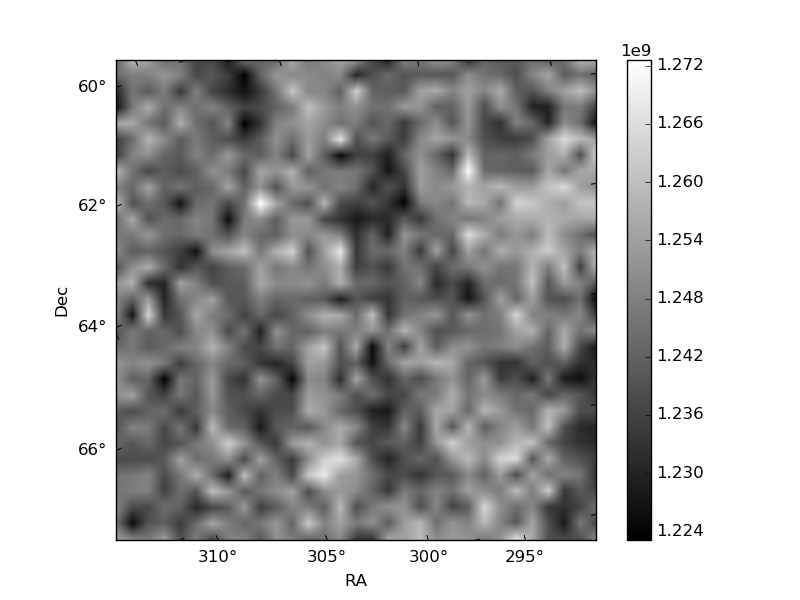
Histogram calculated using DETX and DETY for each event in the final _common_clean file
| Quadrant A | 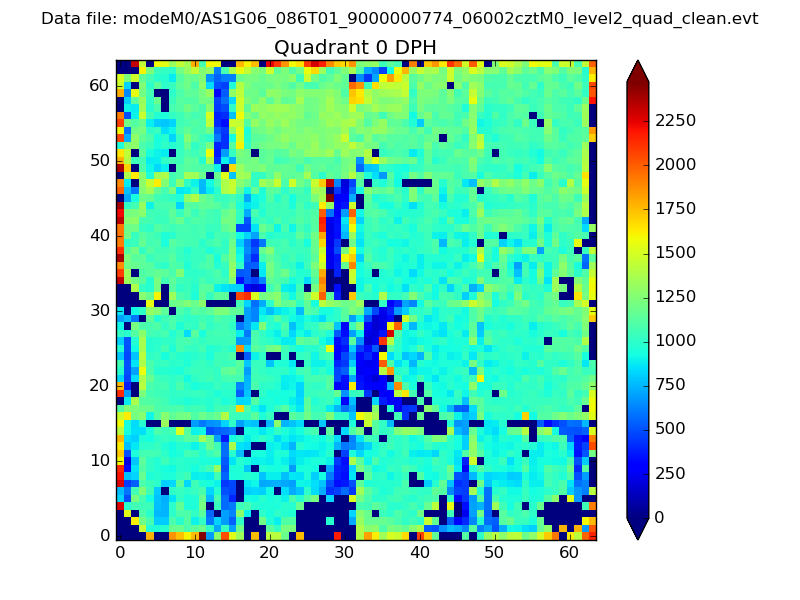 |
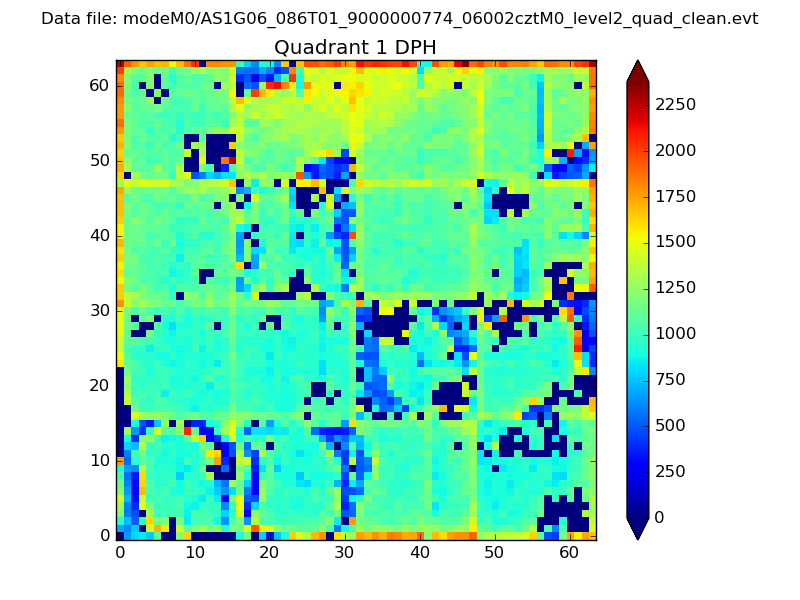 |
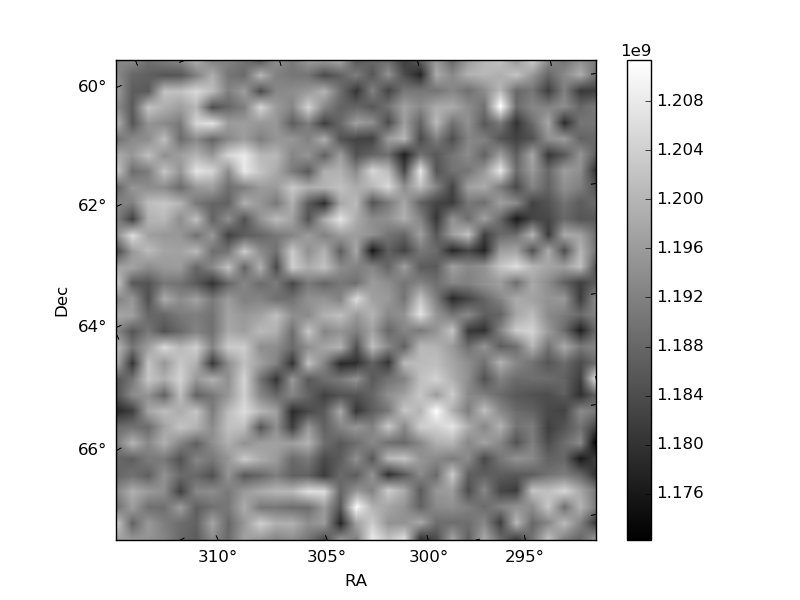
Quadrant B |
|---|---|---|---|
| Quadrant D | 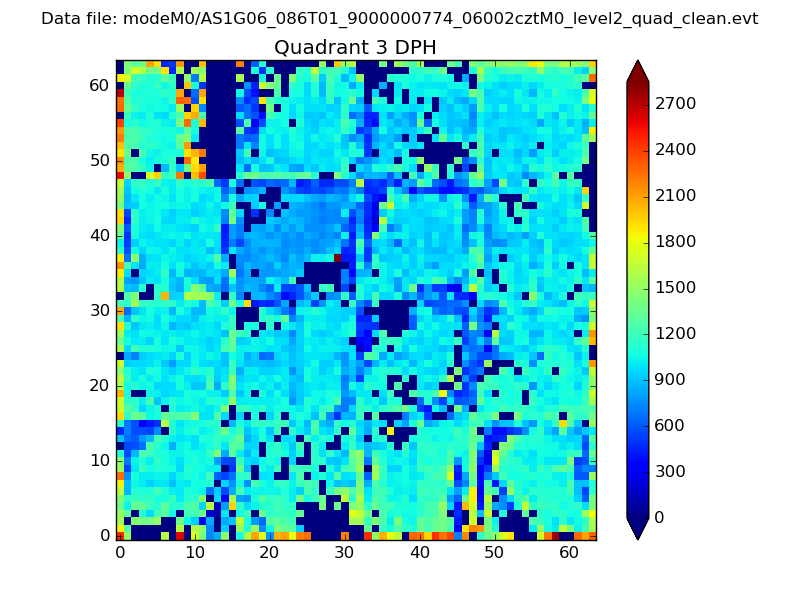 |
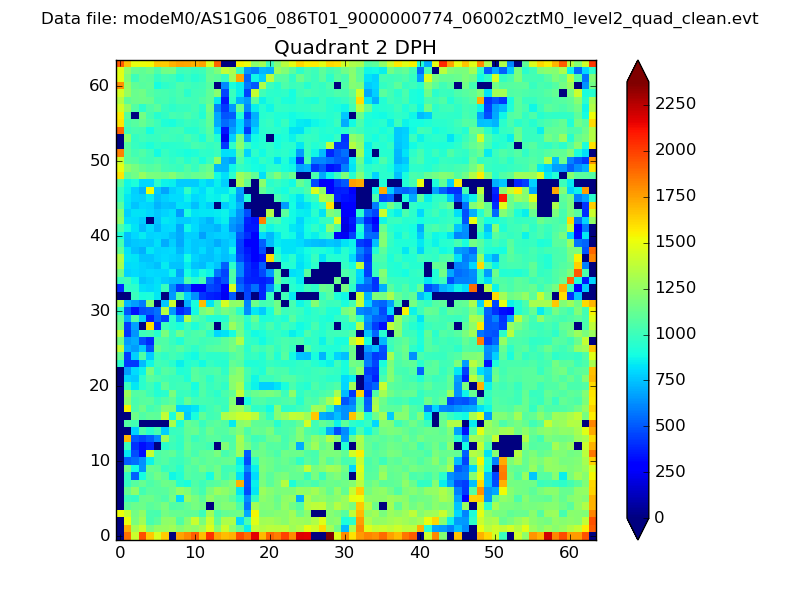 |
Quadrant C |
| Plot type | Count rate plots | Images |
|---|---|---|
| Comparison with Poisson distribution Blue bars denote a histogram of data divided into 1 sec bins. Red curve is a Poisson curve with rate = median count rate of data. |
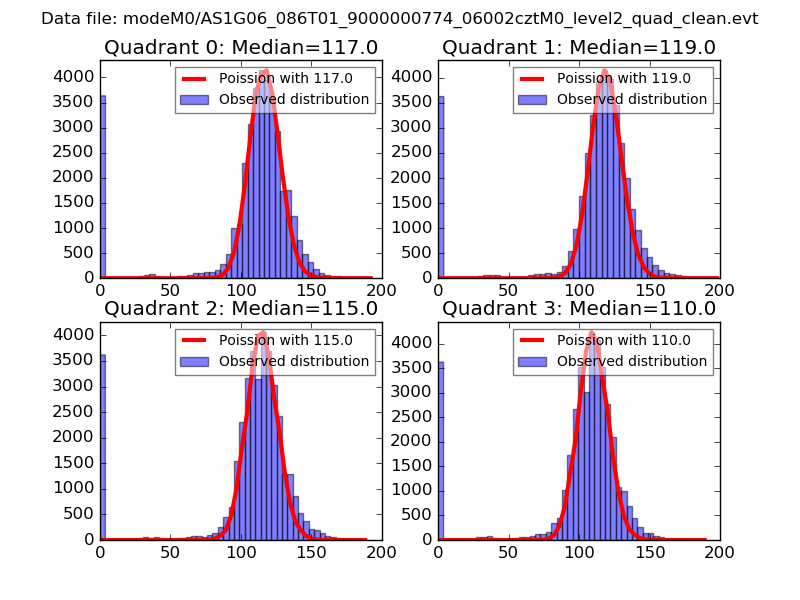 |
 |
| Quadrant-wise count rates Data is divided into 100 sec bins |
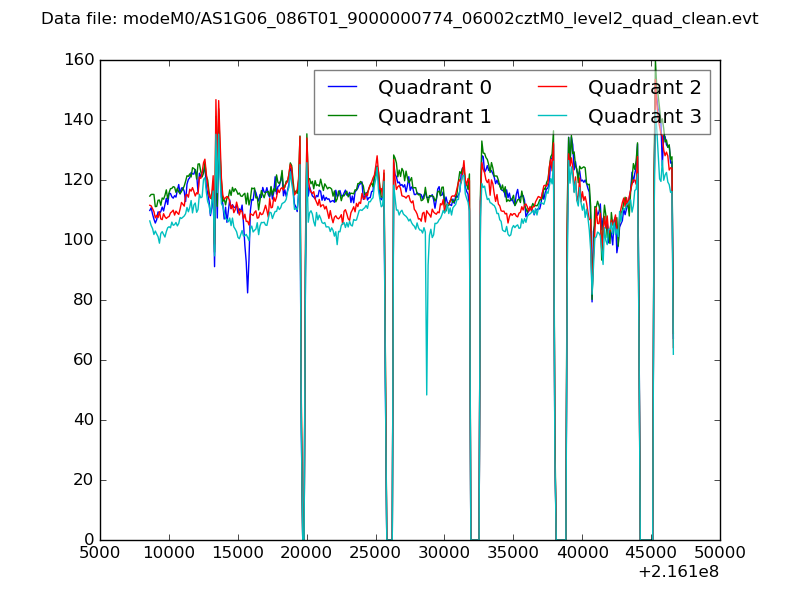 |
|
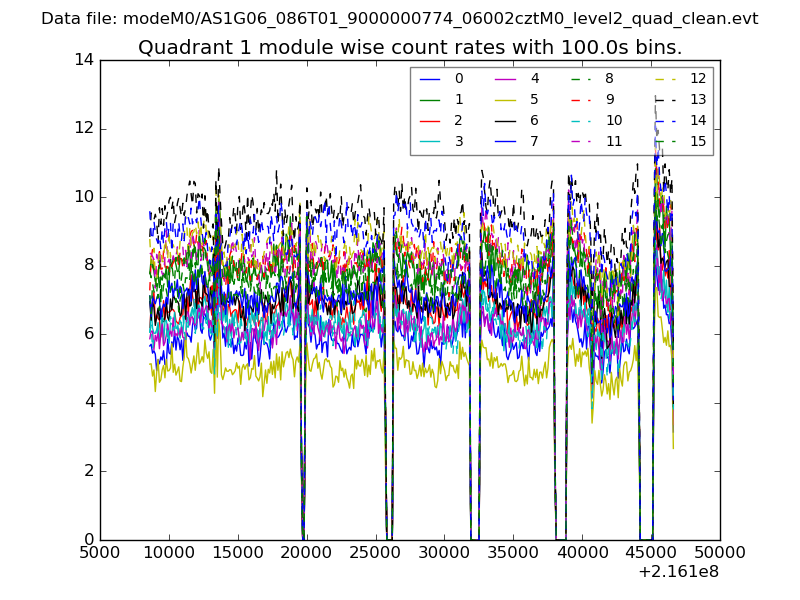
| Module-wise count rates for Quadrant A Data is divided into 100 sec bins |
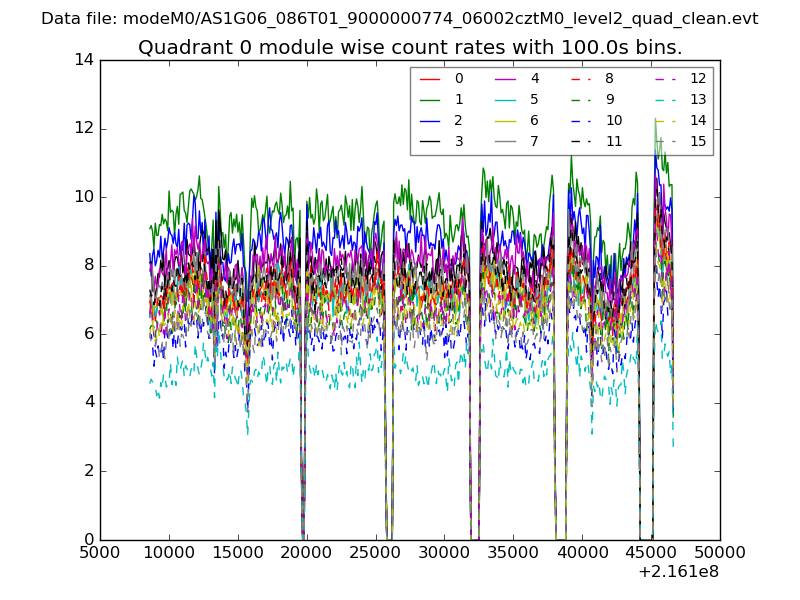 |
 |
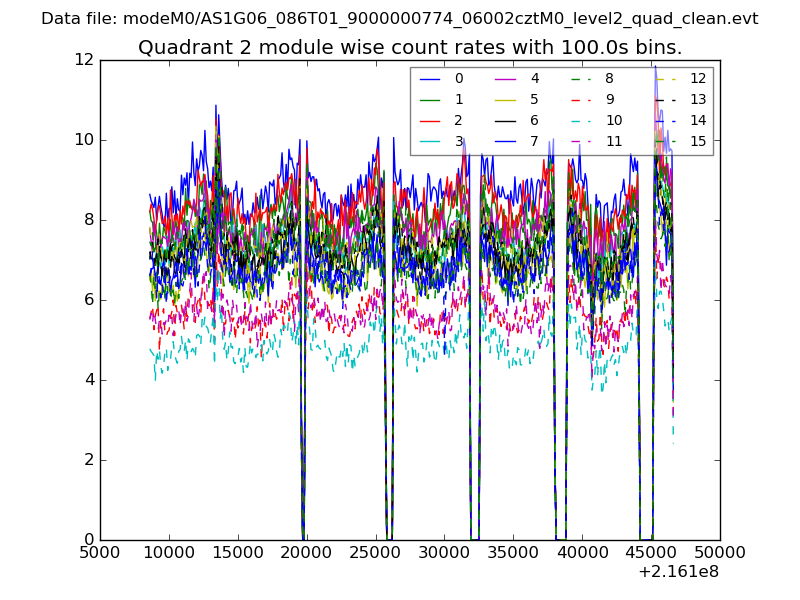
| Module-wise count rates for Quadrant B Data is divided into 100 sec bins |
 |
 |
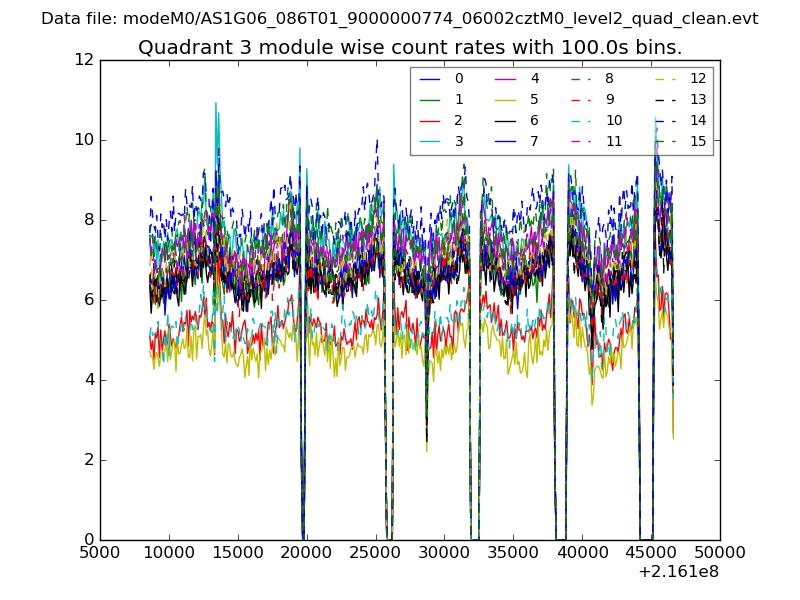
| Module-wise count rates for Quadrant C Data is divided into 100 sec bins |
 |
 |
| Module-wise count rates for Quadrant D Data is divided into 100 sec bins |
 |
 |
| Parameter | Plot |
|---|---|
| CZT HV Monitor | 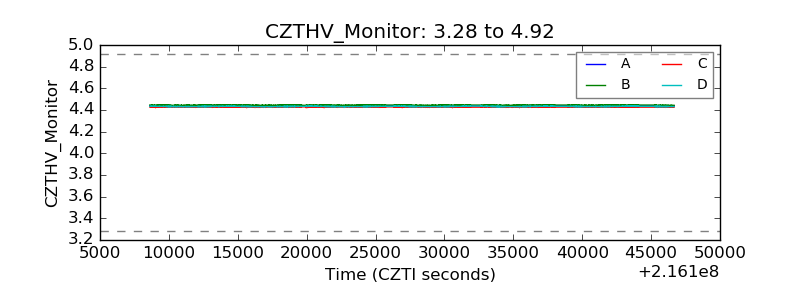 |
| D_VDD | 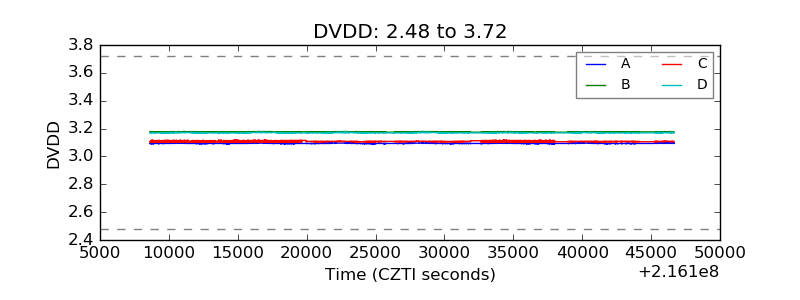 |
| Temperature 1 | 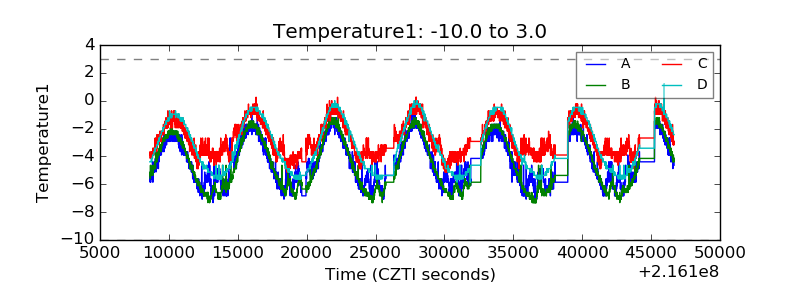 |
| Veto HV Monitor | 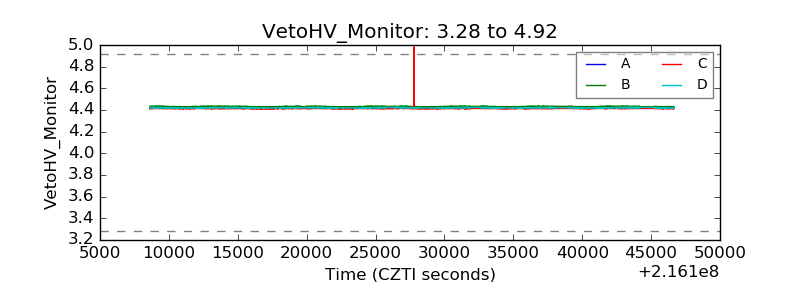 |
| Veto LLD | 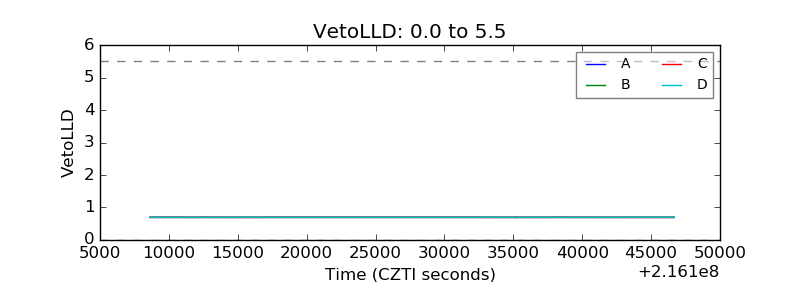 |
| Alpha Counter | 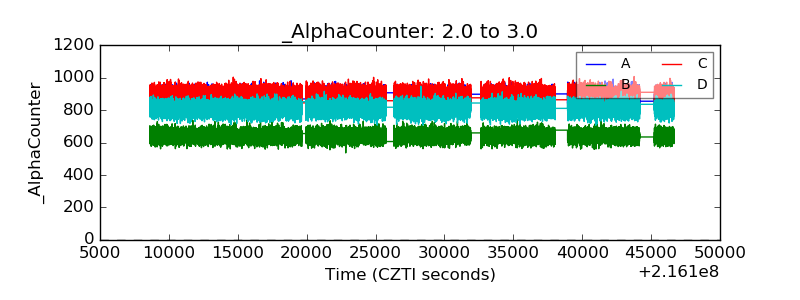 |
| _CPM_Rate | 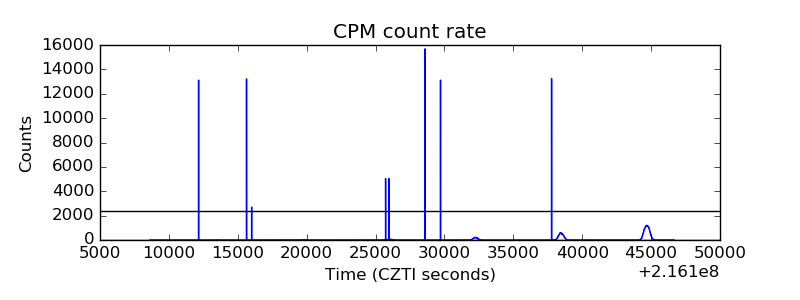 |
| CZT Counter | 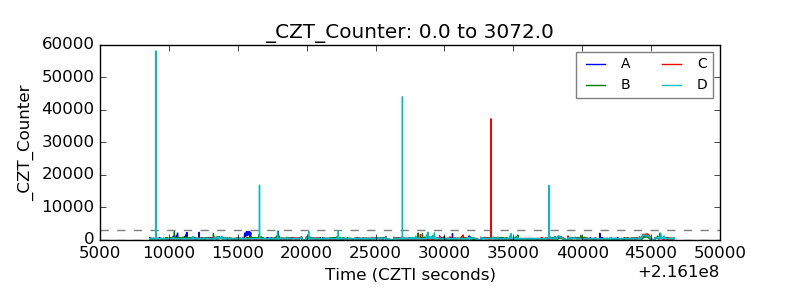 |
| +2.5 Volts monitor | 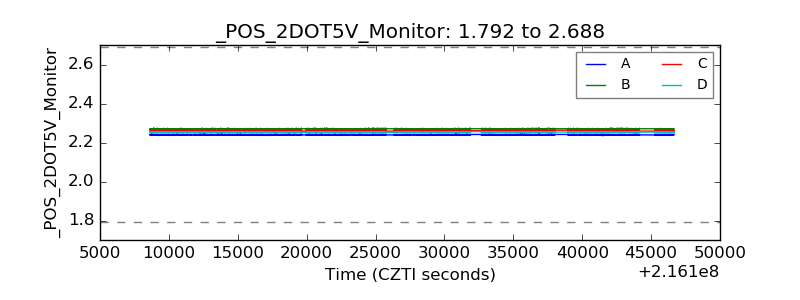 |
| +5 Volts monitor |  |
| _ROLL_ROT | 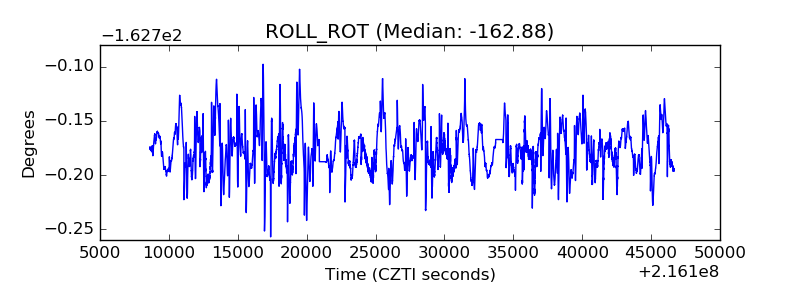 |
| _Roll_DEC | 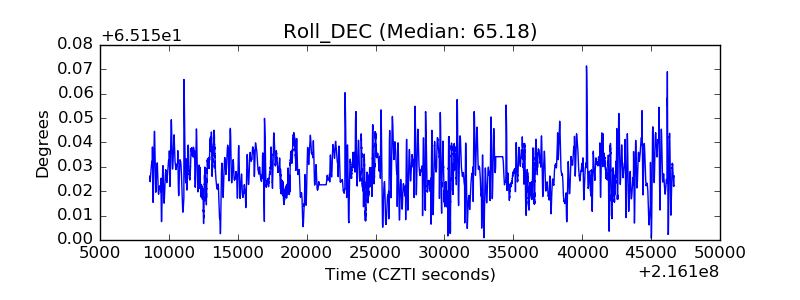 |
| _Roll_RA | 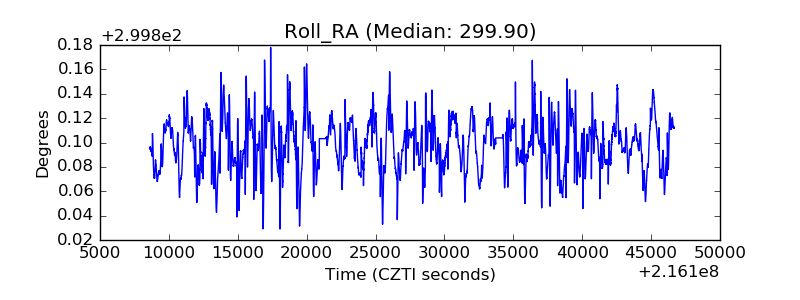 |
| Veto Counter |  |