| Param | Original file | Final file |
|---|---|---|
| Filename | modeM0/AS1G06_086T01_9000000774_06004cztM0_level2.evt | modeM0/AS1G06_086T01_9000000774_06004cztM0_level2_quad_clean.evt |
| Size (bytes) | 420,851,520 | 120,772,800 |
| Size | 401.4 MB | 115.2 MB |
| Events in quadrant A | 3,071,934 | 811,996 |
| Events in quadrant B | 3,260,222 | 827,532 |
| Events in quadrant C | 2,926,086 | 808,104 |
| Events in quadrant D | 3,053,440 | 765,396 |
| Mode SS | |||
|---|---|---|---|
| Quadrant | BADHDUFLAG | Total packets | Discarded packets |
| A | 0 | 130 | 0 |
| B | 0 | 130 | 0 |
| C | 0 | 130 | 4 |
| D | 0 | 130 | 0 |
| Mode M9 | |||
|---|---|---|---|
| Quadrant | BADHDUFLAG | Total packets | Discarded packets |
| A | 0 | 11 | 0 |
| B | 0 | 11 | 0 |
| C | 0 | 11 | 0 |
| D | 0 | 12 | 0 |
| Mode M0 | |||
|---|---|---|---|
| Quadrant | BADHDUFLAG | Total packets | Discarded packets |
| A | 0 | 13524 | 19 |
| B | 0 | 14184 | 39 |
| C | 0 | 13206 | 44 |
| D | 0 | 13858 | 33 |
| Quadrant | Total seconds | Saturated seconds | Saturation percentage |
|---|---|---|---|
| A | 6384 | 43 | 0.673559% |
| B | 6376 | 45 | 0.705772% |
| C | 6375 | 38 | 0.596078% |
| D | 6377 | 98 | 1.536773% |
Noise dominated data is calculated using 1-second bins in cleaned event files. If a bin has >2000 counts, and if more than 50% of those come from <1% of pixels, then it is considered to be noise-dominated and hence unusable.
| Quadrant | # 1 sec bins | Bins with >0 counts | Bins with >2000 counts | High rate bins dominated by noise | Noise dominated (total time) | Noise dominated (detector-on time) | Marked lightcurve |
|---|---|---|---|---|---|---|---|
| A | 7546 | 6392 | 11 | 11 | 0.15% | 0.17% | 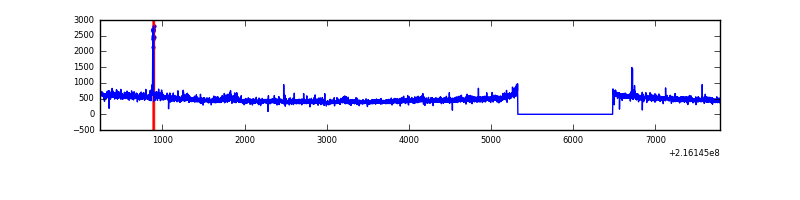 |
| B | 7546 | 6392 | 9 | 9 | 0.12% | 0.14% | 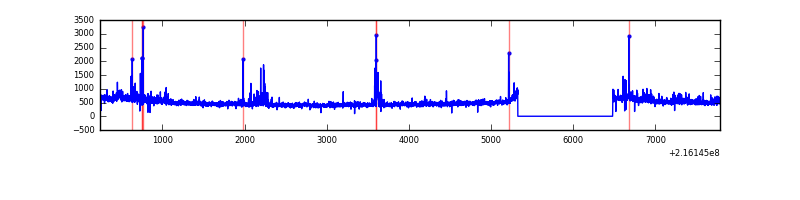 |
| C | 7546 | 6391 | 1 | 1 | 0.01% | 0.02% | 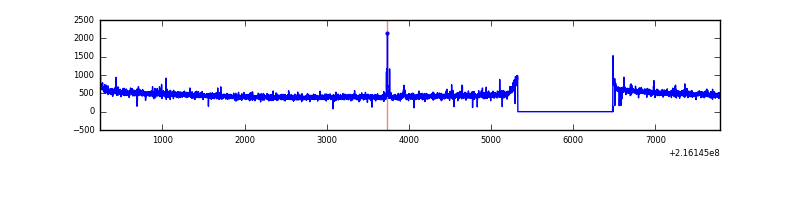 |
| D | 7546 | 6392 | 47 | 47 | 0.62% | 0.74% | 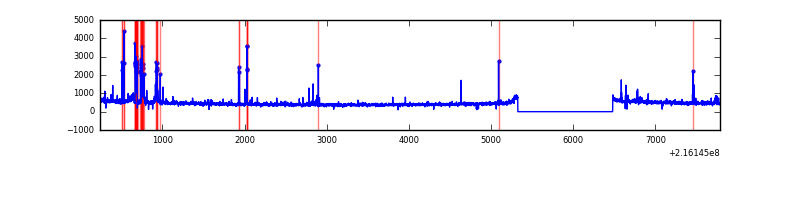 |
Top three noisy pixels from each quadrant. If the there are fewer than three noisy pixels in the level2.evt file, extra rows are filled as -1
| Pixel properties | Quadrant properties | ||||||
|---|---|---|---|---|---|---|---|
| Quadrant | DetID | PixID | Counts | Sigma | Mean | Median | Sigma |
| A | 8 | 6 | 88457 | 576.21 | 747 | 730 | 152.2 |
| A | 15 | 234 | 51015 | 330.28 | 747 | 730 | 152.2 |
| A | 8 | 5 | 23486 | 149.47 | 747 | 730 | 152.2 |
| B | 15 | 204 | 80005 | 558.94 | 754 | 737 | 141.8 |
| B | 0 | 214 | 75868 | 529.77 | 754 | 737 | 141.8 |
| B | 0 | 219 | 74132 | 517.53 | 754 | 737 | 141.8 |
| C | 1 | 16 | 26935 | 155.45 | 735 | 738 | 168.5 |
| C | 9 | 54 | 19333 | 110.34 | 735 | 738 | 168.5 |
| C | 13 | 61 | 6018 | 31.33 | 735 | 738 | 168.5 |
| D | 2 | 63 | 138596 | 778.63 | 728 | 705 | 177.1 |
| D | 2 | 14 | 29764 | 164.09 | 728 | 705 | 177.1 |
| D | 13 | 61 | 29217 | 161.0 | 728 | 705 | 177.1 |
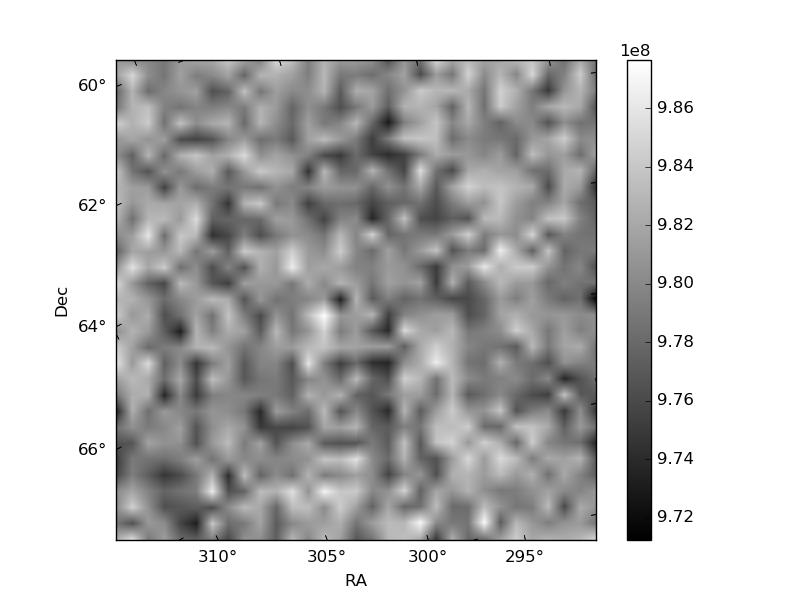
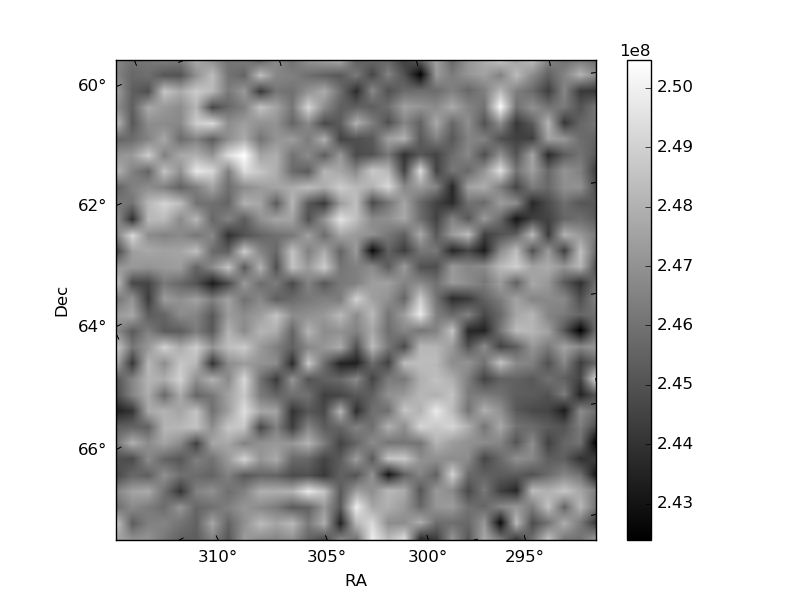
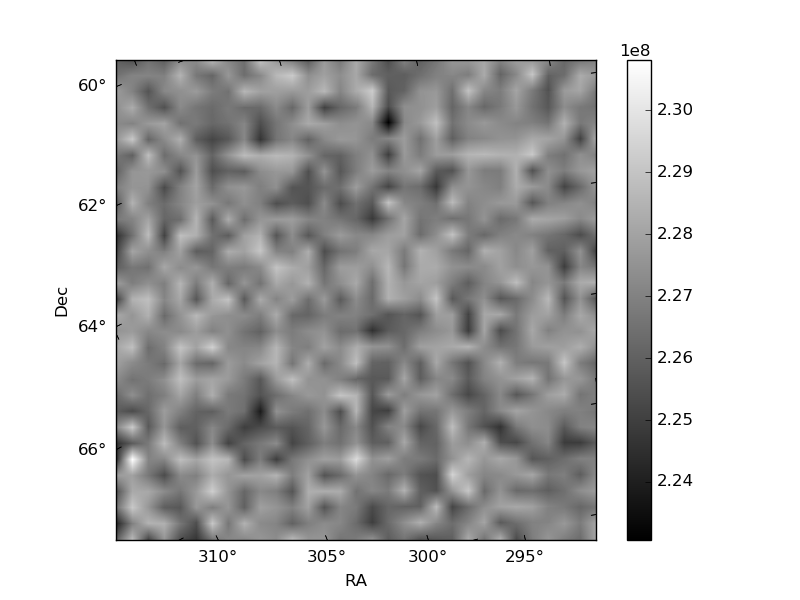
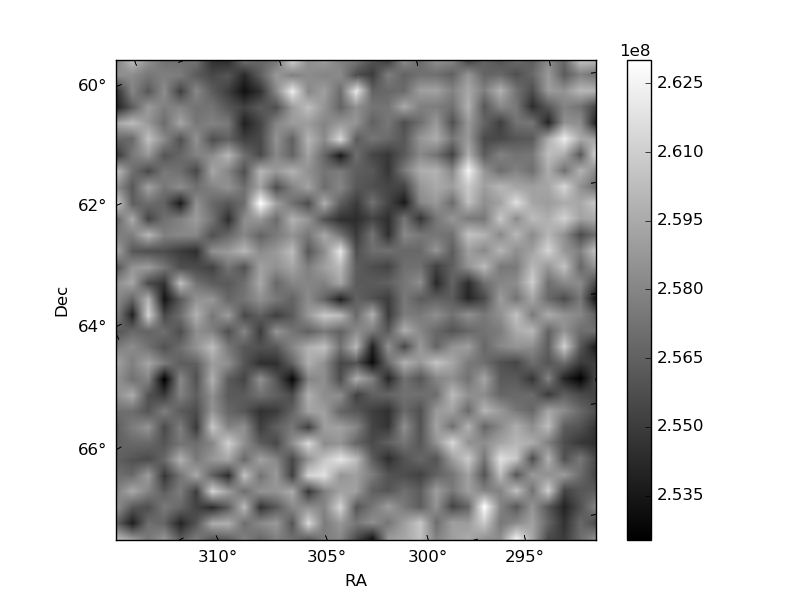
Histogram calculated using DETX and DETY for each event in the final _common_clean file
| Quadrant A | 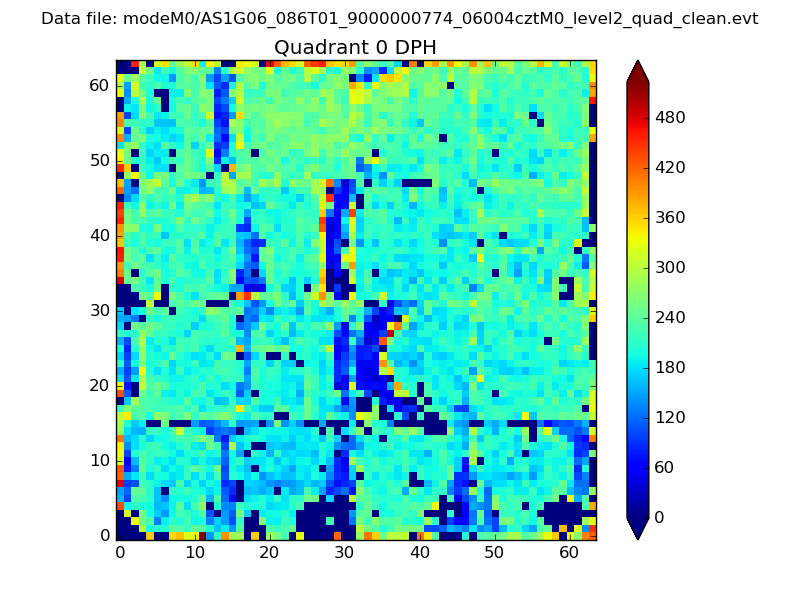 |
 |
Quadrant B |
|---|---|---|---|
| Quadrant D | 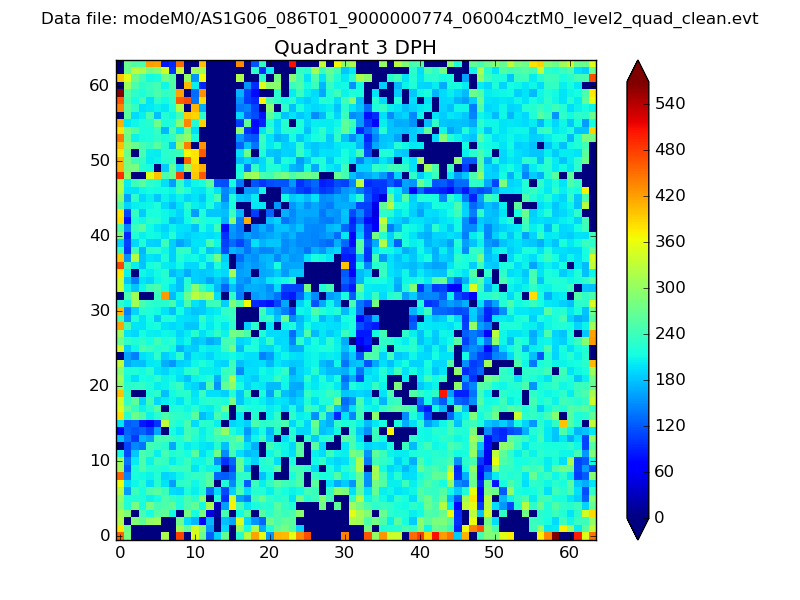 |
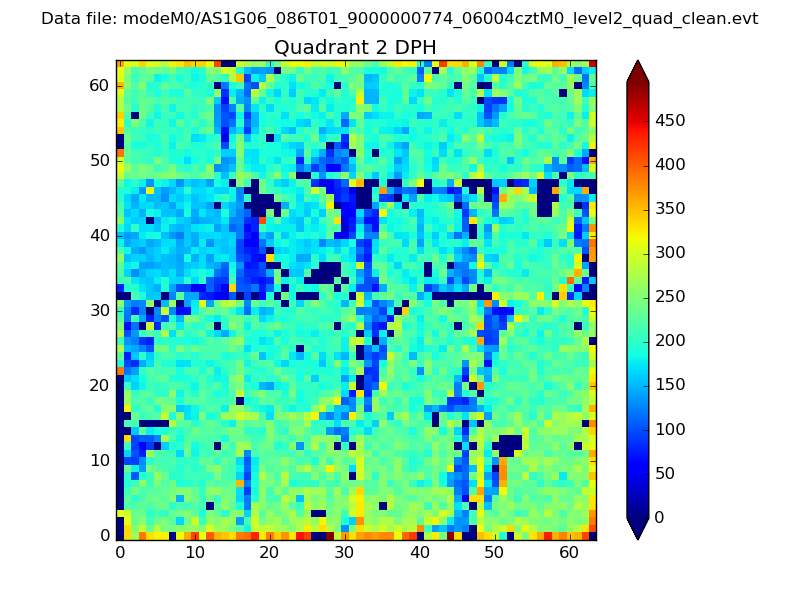 |
Quadrant C |
| Plot type | Count rate plots | Images |
|---|---|---|
| Comparison with Poisson distribution Blue bars denote a histogram of data divided into 1 sec bins. Red curve is a Poisson curve with rate = median count rate of data. |
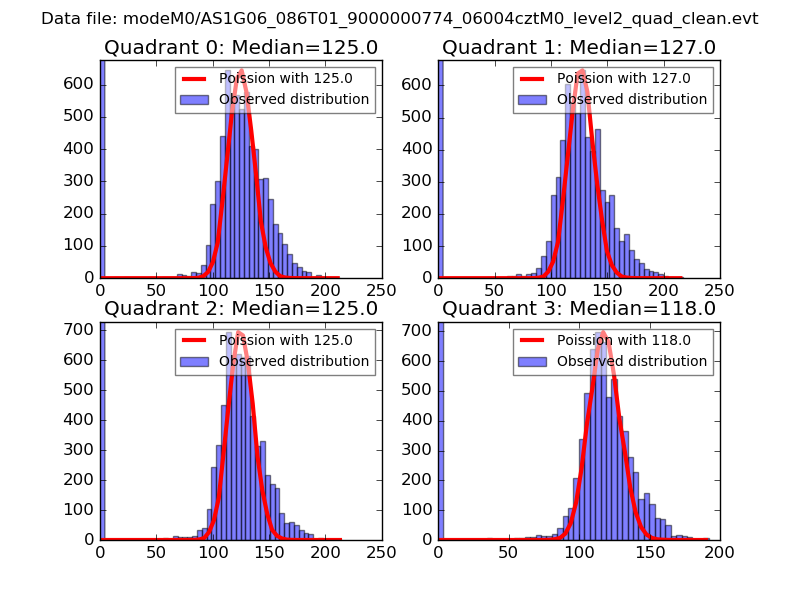 |
 |
| Quadrant-wise count rates Data is divided into 100 sec bins |
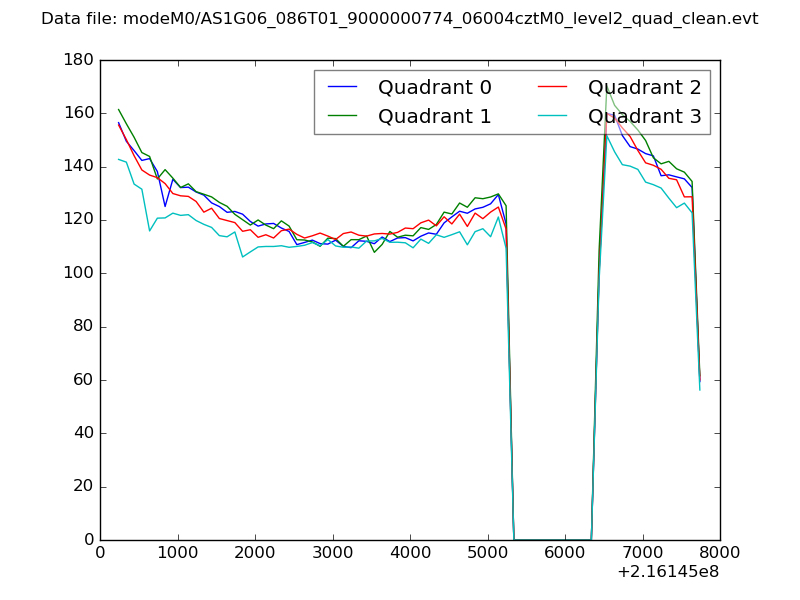 |
|
| Module-wise count rates for Quadrant A Data is divided into 100 sec bins |
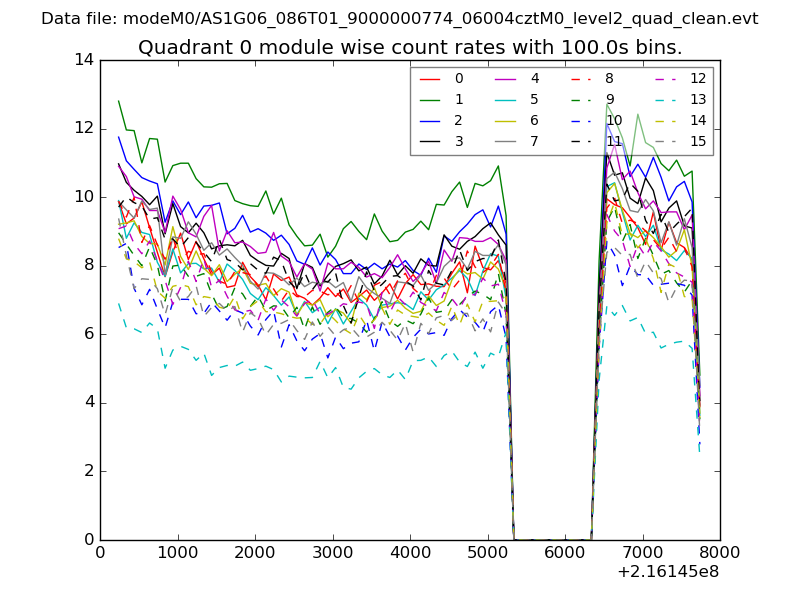 |
 |
| Module-wise count rates for Quadrant B Data is divided into 100 sec bins |
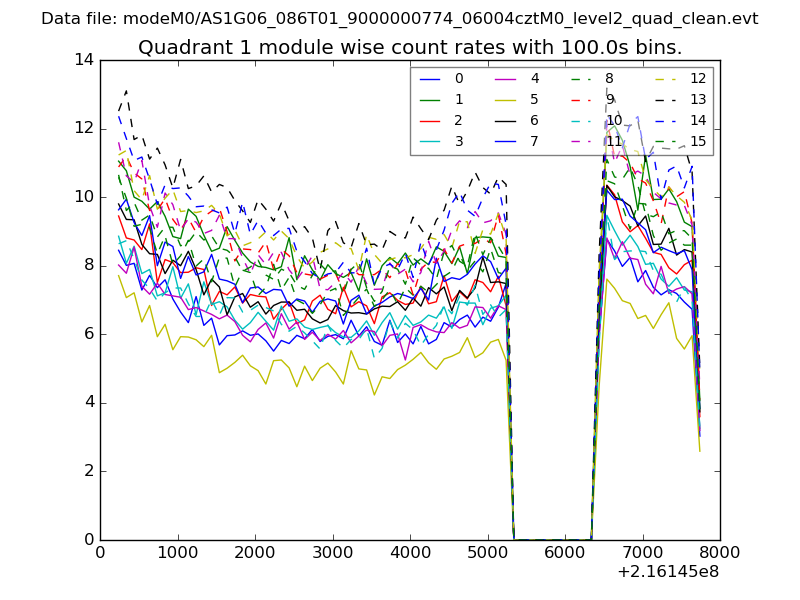 |
 |
| Module-wise count rates for Quadrant C Data is divided into 100 sec bins |
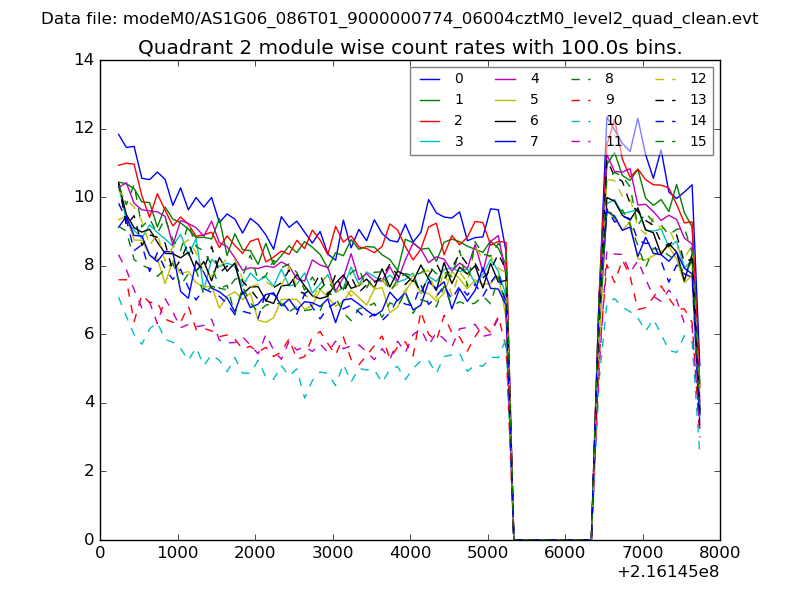 |
 |
| Module-wise count rates for Quadrant D Data is divided into 100 sec bins |
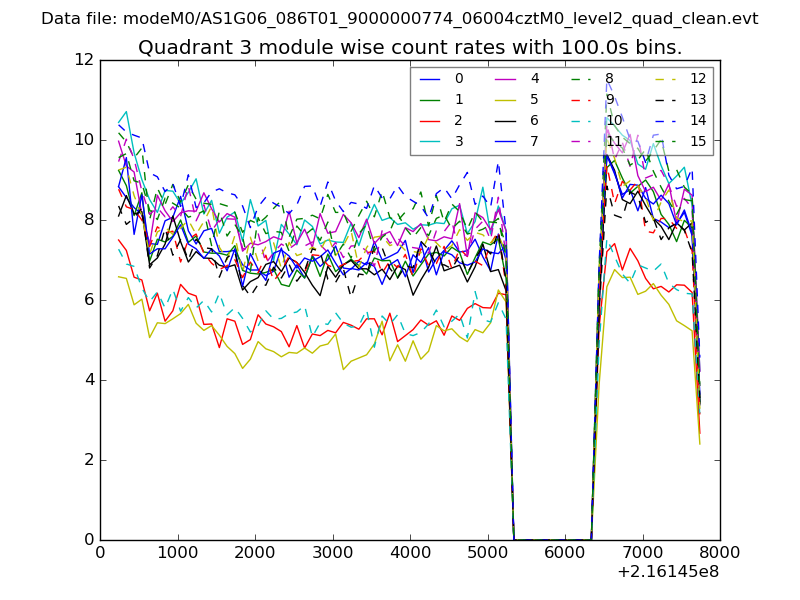 |
 |
| Parameter | Plot |
|---|---|
| CZT HV Monitor | 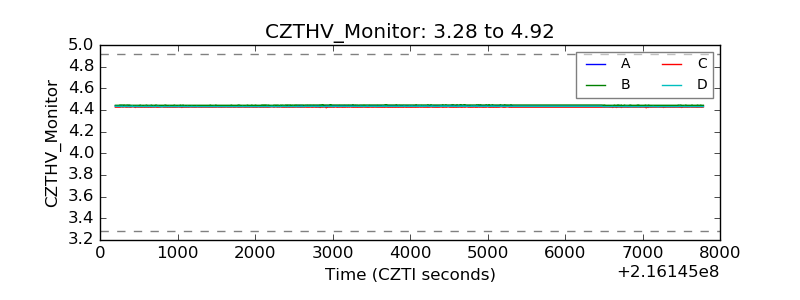 |
| D_VDD | 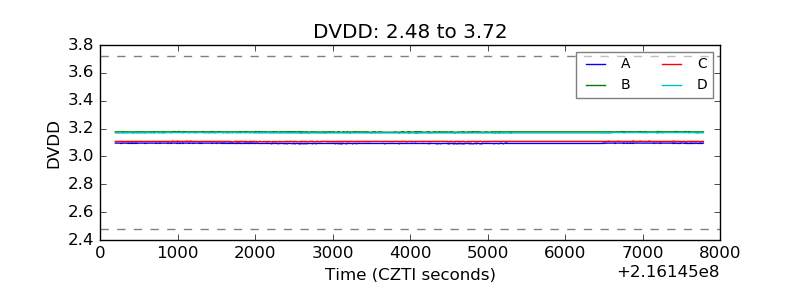 |
| Temperature 1 | 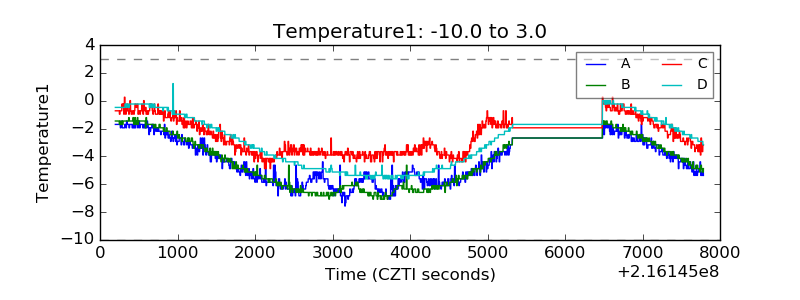 |
| Veto HV Monitor | 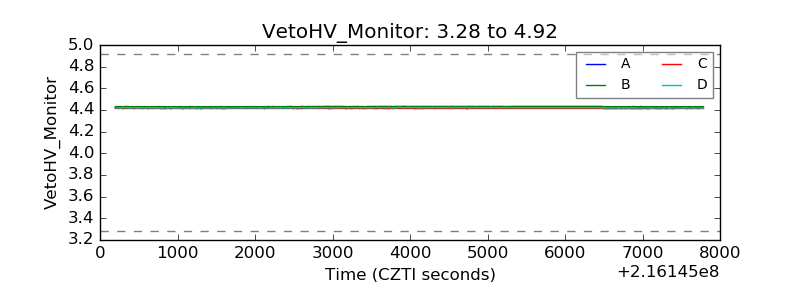 |
| Veto LLD | 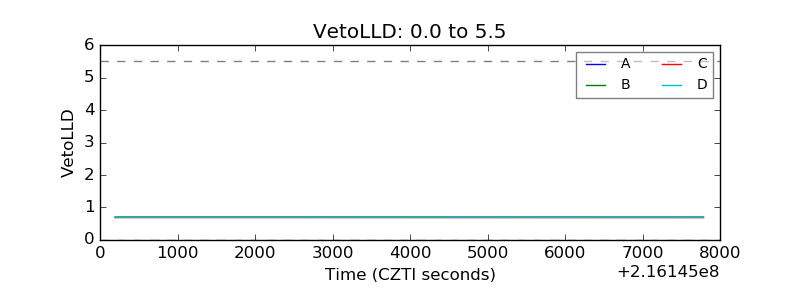 |
| Alpha Counter | 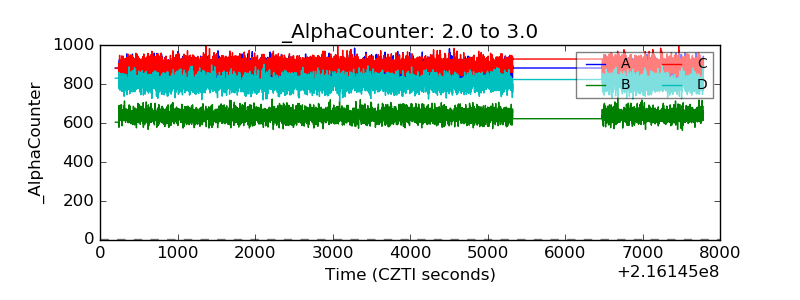 |
| _CPM_Rate | 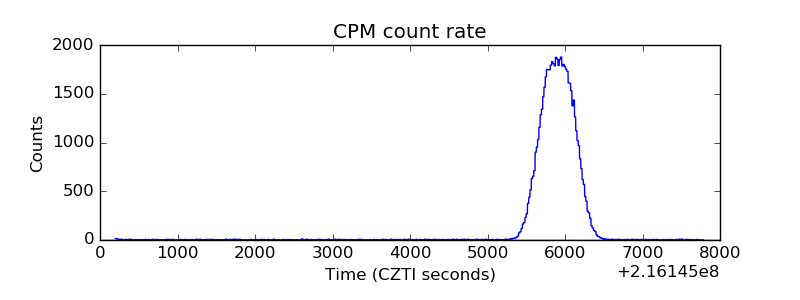 |
| CZT Counter | 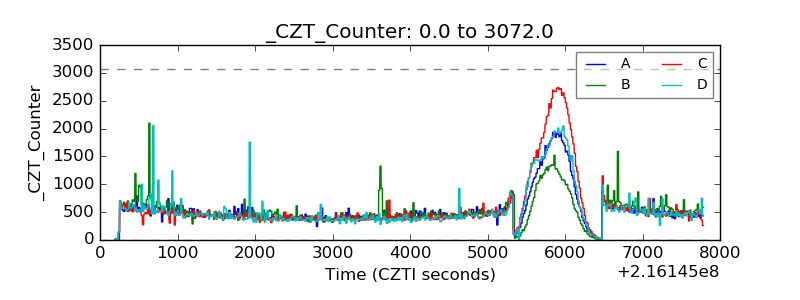 |
| +2.5 Volts monitor |  |
| +5 Volts monitor |  |
| _ROLL_ROT | 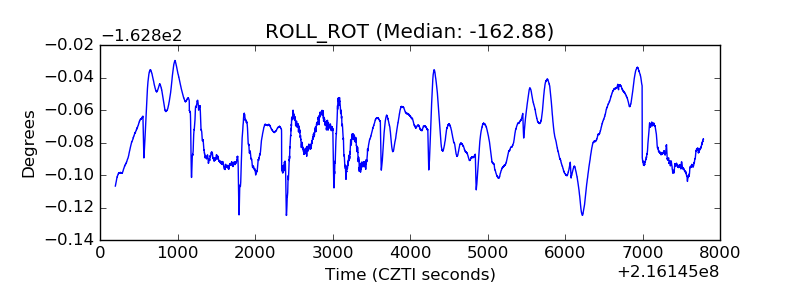 |
| _Roll_DEC | 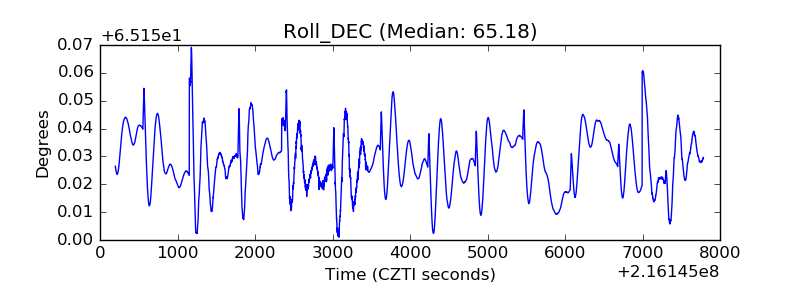 |
| _Roll_RA | 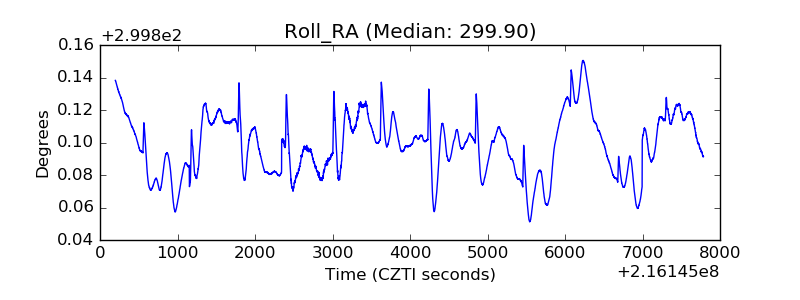 |
| Veto Counter | 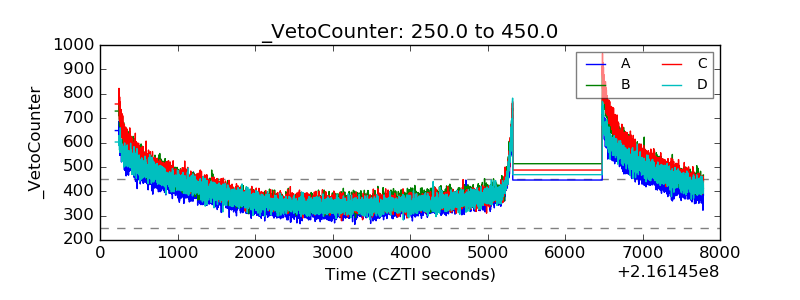 |