| Param | Original file | Final file |
|---|---|---|
| Filename | modeM0/AS1G06_086T01_9000000774_06007cztM0_level2.evt | modeM0/AS1G06_086T01_9000000774_06007cztM0_level2_quad_clean.evt |
| Size (bytes) | 404,530,560 | 118,612,800 |
| Size | 385.8 MB | 113.1 MB |
| Events in quadrant A | 2,804,919 | 794,300 |
| Events in quadrant B | 3,484,196 | 811,113 |
| Events in quadrant C | 2,805,395 | 800,162 |
| Events in quadrant D | 2,732,631 | 752,088 |
| Mode SS | |||
|---|---|---|---|
| Quadrant | BADHDUFLAG | Total packets | Discarded packets |
| A | 0 | 126 | 0 |
| B | 0 | 126 | 0 |
| C | 0 | 126 | 0 |
| D | 0 | 126 | 0 |
| Mode M9 | |||
|---|---|---|---|
| Quadrant | BADHDUFLAG | Total packets | Discarded packets |
| A | 0 | 19 | 0 |
| B | 0 | 19 | 0 |
| C | 0 | 19 | 0 |
| D | 0 | 20 | 0 |
| Mode M0 | |||
|---|---|---|---|
| Quadrant | BADHDUFLAG | Total packets | Discarded packets |
| A | 0 | 12764 | 3 |
| B | 0 | 14672 | 2 |
| C | 0 | 12752 | 2 |
| D | 0 | 12886 | 2 |
| Quadrant | Total seconds | Saturated seconds | Saturation percentage |
|---|---|---|---|
| A | 6231 | 29 | 0.465415% |
| B | 6231 | 218 | 3.498636% |
| C | 6231 | 32 | 0.513561% |
| D | 6231 | 29 | 0.465415% |
Noise dominated data is calculated using 1-second bins in cleaned event files. If a bin has >2000 counts, and if more than 50% of those come from <1% of pixels, then it is considered to be noise-dominated and hence unusable.
| Quadrant | # 1 sec bins | Bins with >0 counts | Bins with >2000 counts | High rate bins dominated by noise | Noise dominated (total time) | Noise dominated (detector-on time) | Marked lightcurve |
|---|---|---|---|---|---|---|---|
| A | 7501 | 6232 | 0 | 0 | 0.00% | 0.00% | 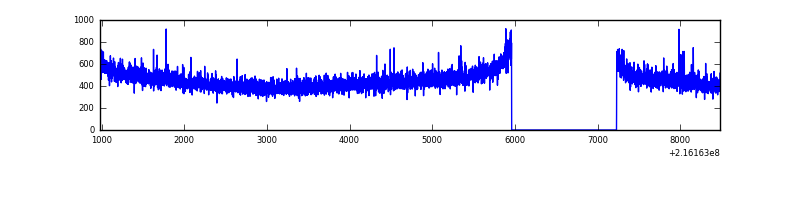 |
| B | 7501 | 6232 | 94 | 94 | 1.25% | 1.51% | 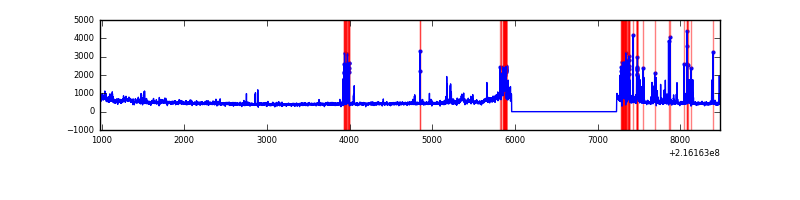 |
| C | 7501 | 6232 | 0 | 0 | 0.00% | 0.00% | 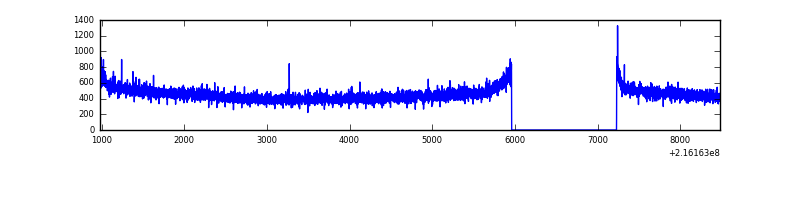 |
| D | 7501 | 6232 | 5 | 5 | 0.07% | 0.08% | 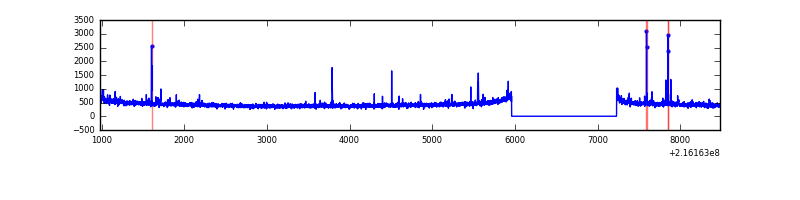 |
Top three noisy pixels from each quadrant. If the there are fewer than three noisy pixels in the level2.evt file, extra rows are filled as -1
| Pixel properties | Quadrant properties | ||||||
|---|---|---|---|---|---|---|---|
| Quadrant | DetID | PixID | Counts | Sigma | Mean | Median | Sigma |
| A | 15 | 234 | 8563 | 53.73 | 722 | 708 | 146.2 |
| A | 15 | 236 | 7379 | 45.63 | 722 | 708 | 146.2 |
| A | 0 | 226 | 7054 | 43.41 | 722 | 708 | 146.2 |
| B | 3 | 64 | 459266 | 3327.66 | 729 | 712 | 137.8 |
| B | 15 | 204 | 79096 | 568.82 | 729 | 712 | 137.8 |
| B | 0 | 219 | 49091 | 351.08 | 729 | 712 | 137.8 |
| C | 1 | 16 | 19929 | 117.04 | 713 | 716 | 164.2 |
| C | 13 | 61 | 5821 | 31.1 | 713 | 716 | 164.2 |
| C | 1 | 241 | 2497 | 10.85 | 713 | 716 | 164.2 |
| D | 2 | 14 | 26860 | 153.32 | 702 | 679 | 170.8 |
| D | 13 | 105 | 22194 | 125.99 | 702 | 679 | 170.8 |
| D | 2 | 63 | 12412 | 68.71 | 702 | 679 | 170.8 |
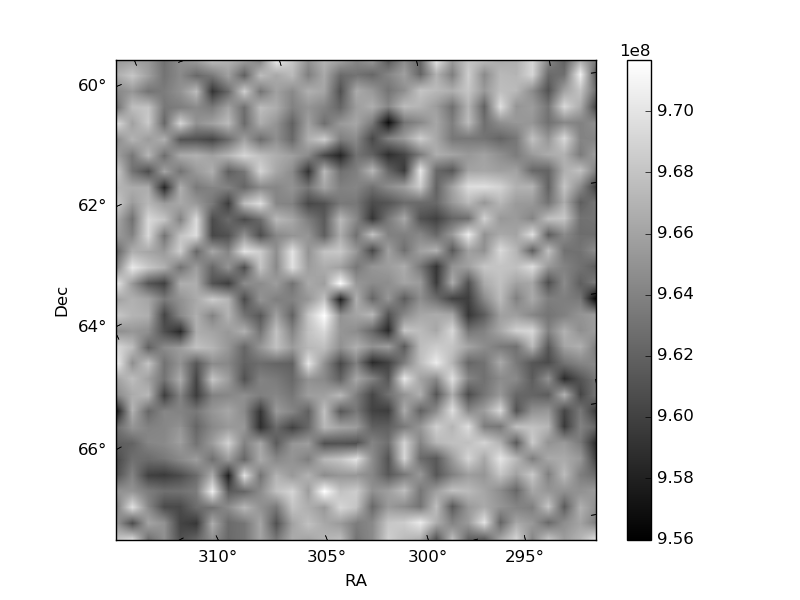
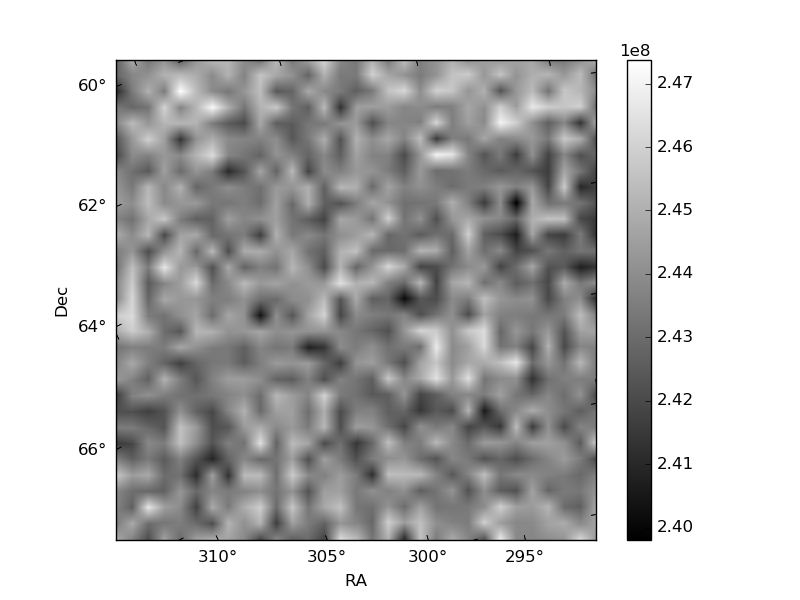
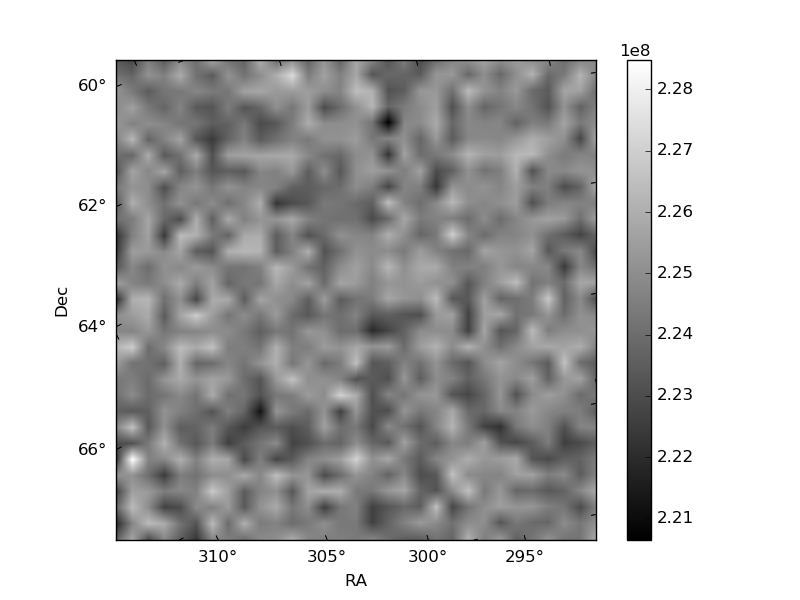
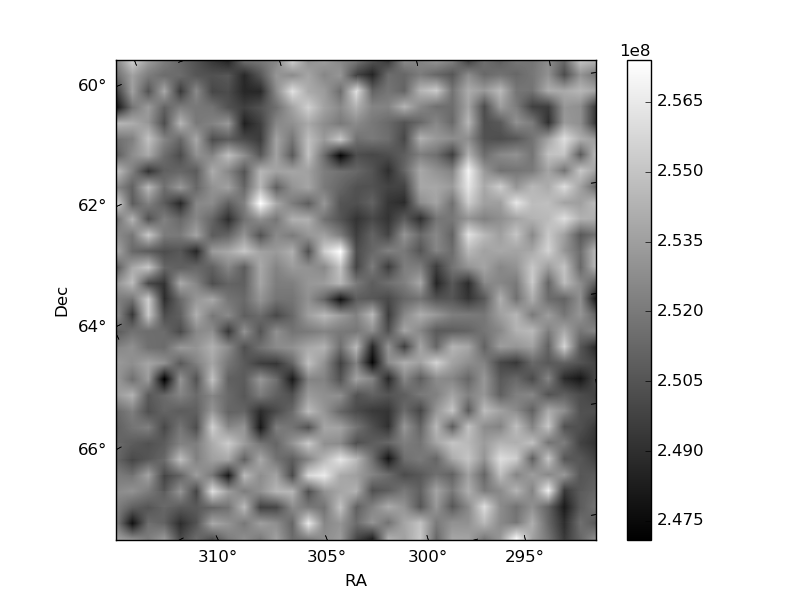
Histogram calculated using DETX and DETY for each event in the final _common_clean file
| Quadrant A | 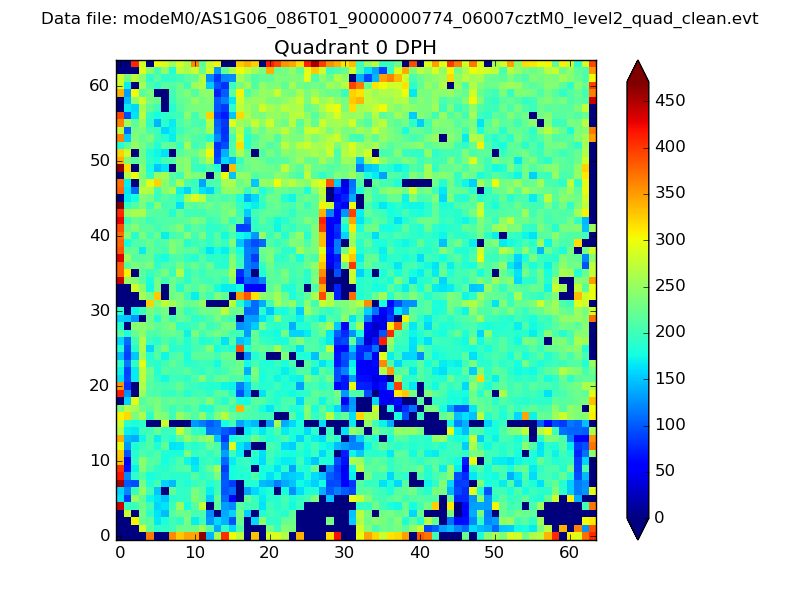 |
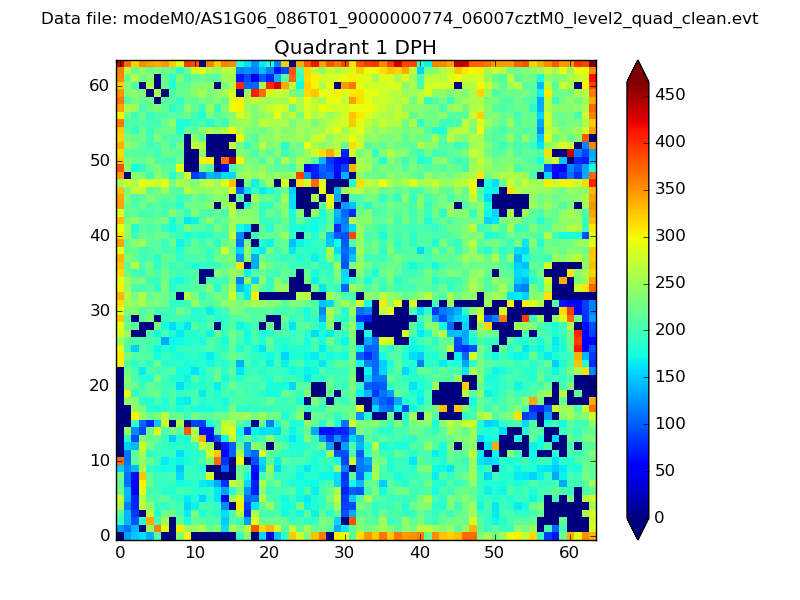 |
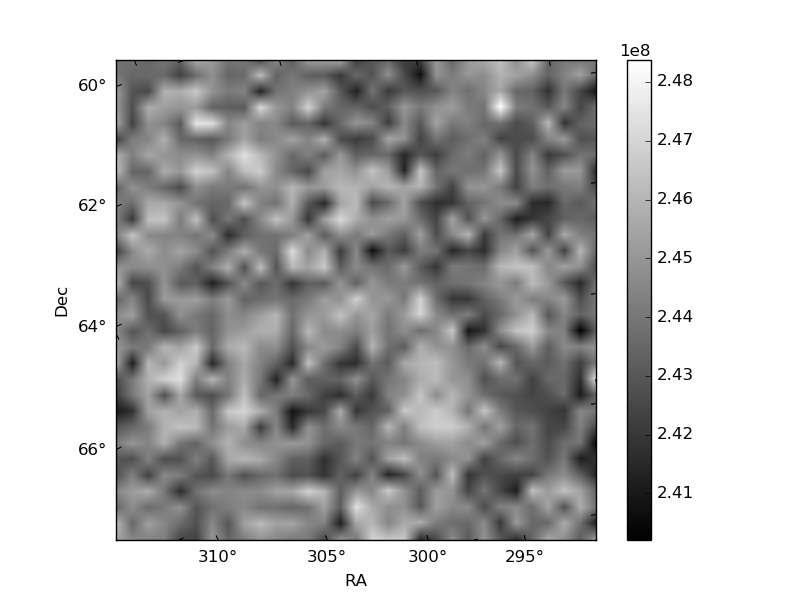
Quadrant B |
|---|---|---|---|
| Quadrant D | 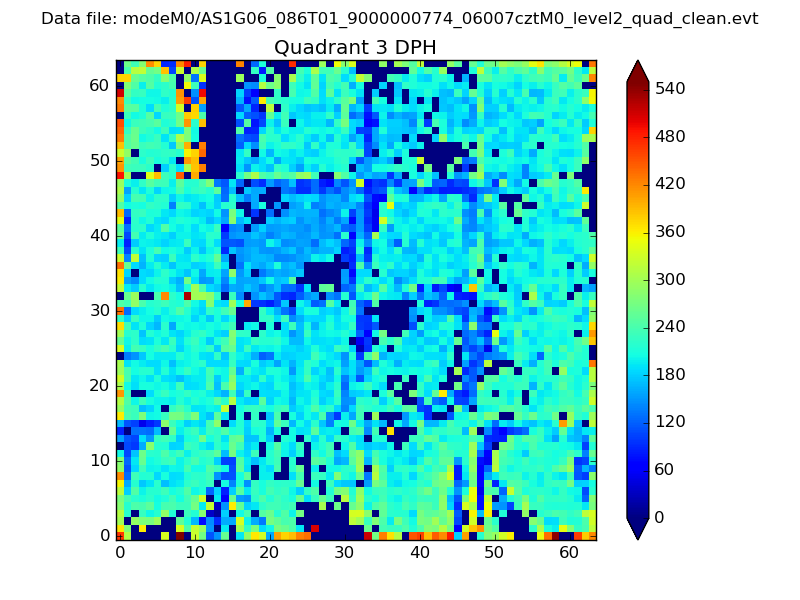 |
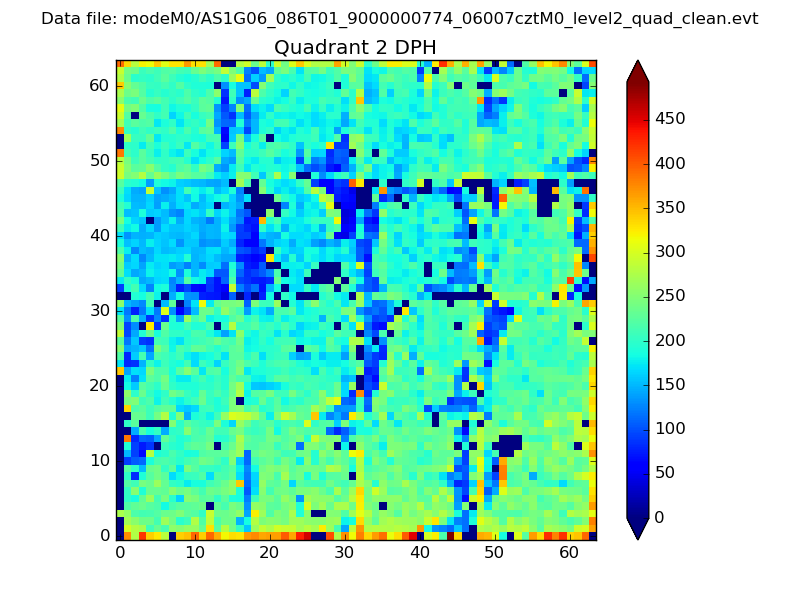 |
Quadrant C |
| Plot type | Count rate plots | Images |
|---|---|---|
| Comparison with Poisson distribution Blue bars denote a histogram of data divided into 1 sec bins. Red curve is a Poisson curve with rate = median count rate of data. |
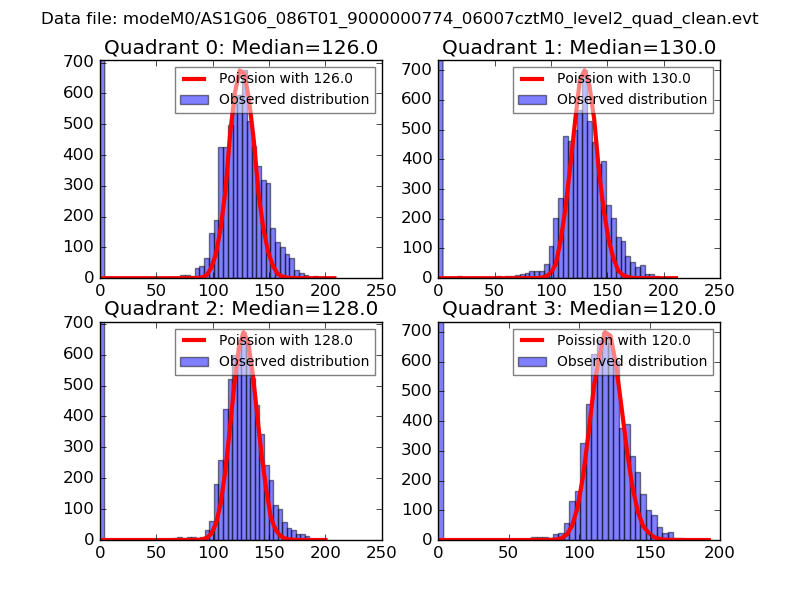 |
 |
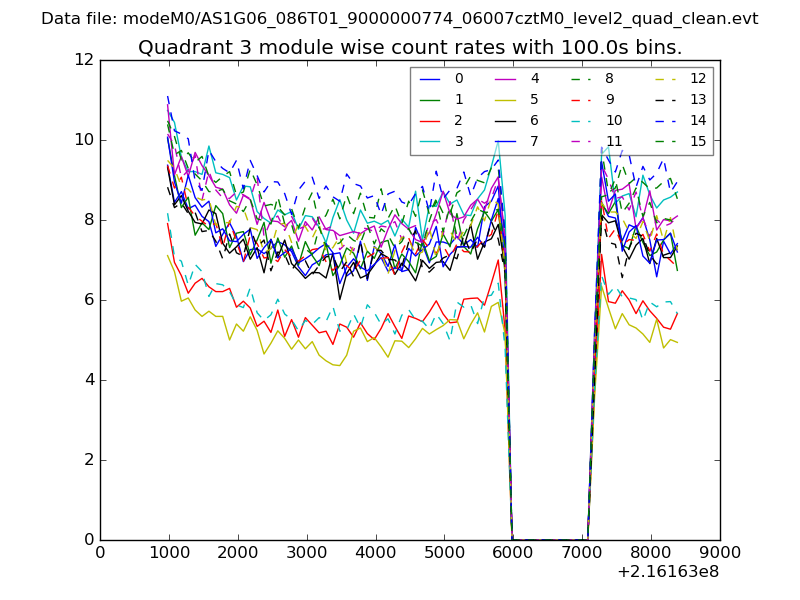
| Quadrant-wise count rates Data is divided into 100 sec bins |
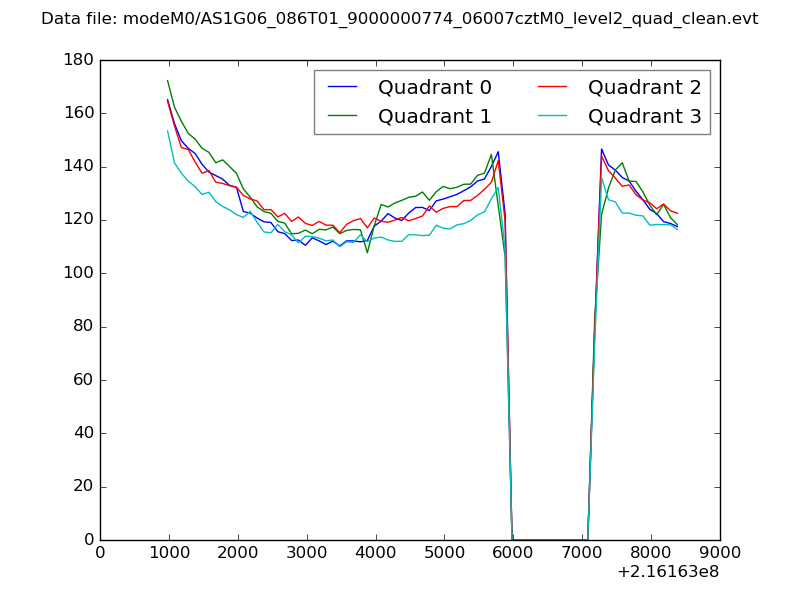 |
|
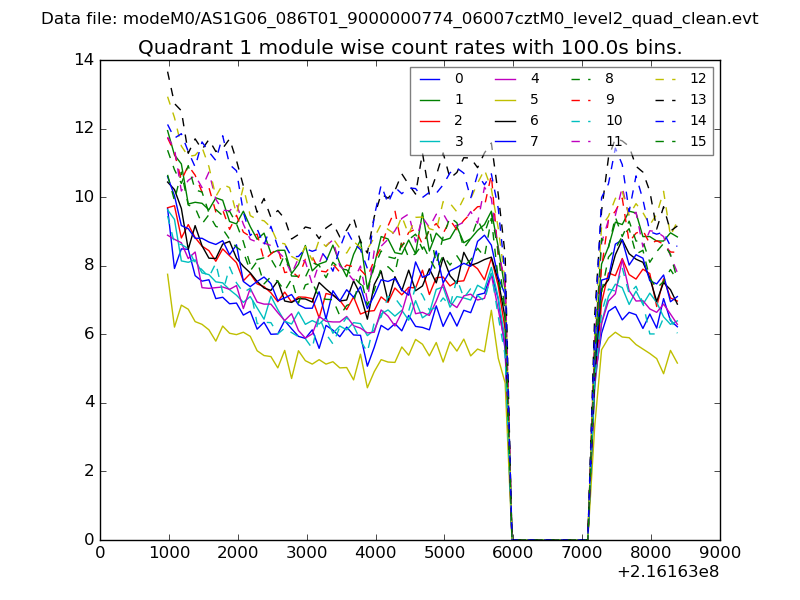
| Module-wise count rates for Quadrant A Data is divided into 100 sec bins |
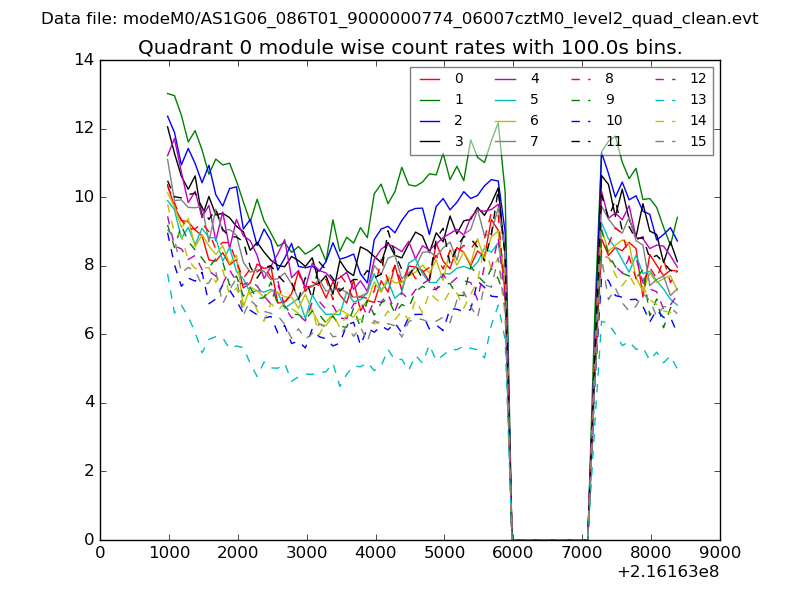 |
 |
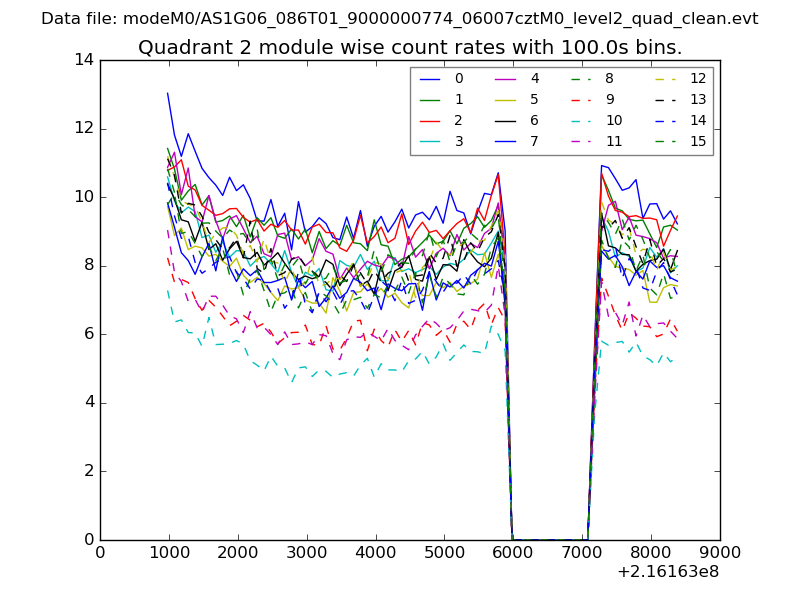
| Module-wise count rates for Quadrant B Data is divided into 100 sec bins |
 |
 |
| Module-wise count rates for Quadrant C Data is divided into 100 sec bins |
 |
 |
| Module-wise count rates for Quadrant D Data is divided into 100 sec bins |
 |
 |
| Parameter | Plot |
|---|---|
| CZT HV Monitor | 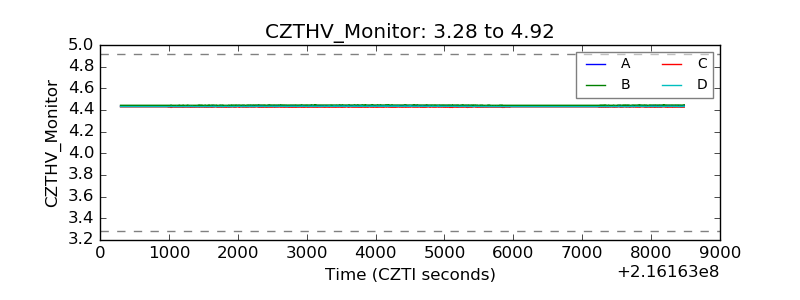 |
| D_VDD | 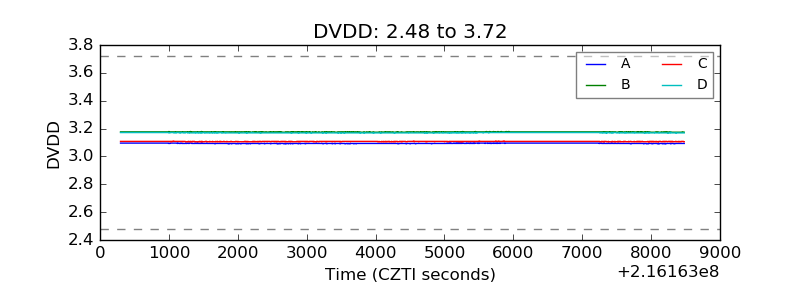 |
| Temperature 1 | 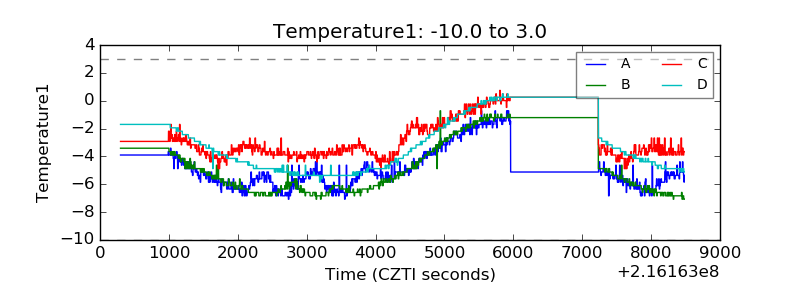 |
| Veto HV Monitor | 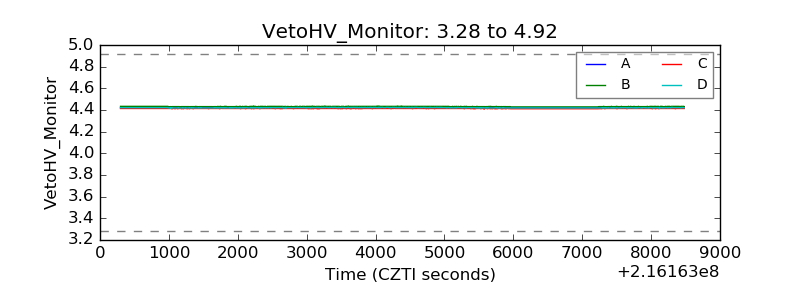 |
| Veto LLD | 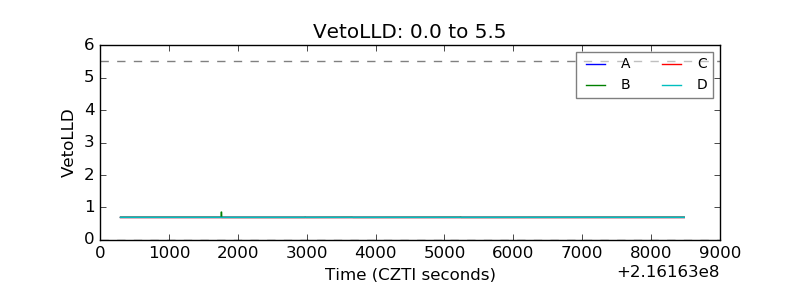 |
| Alpha Counter | 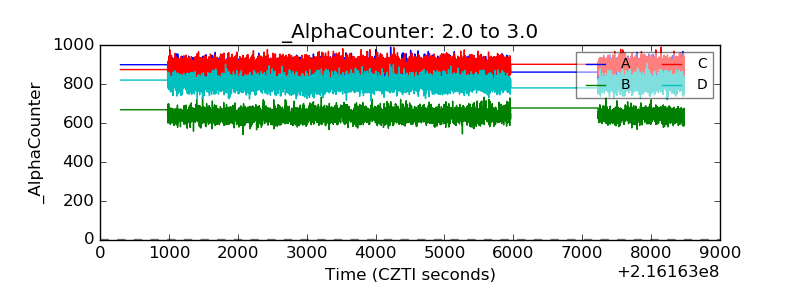 |
| _CPM_Rate | 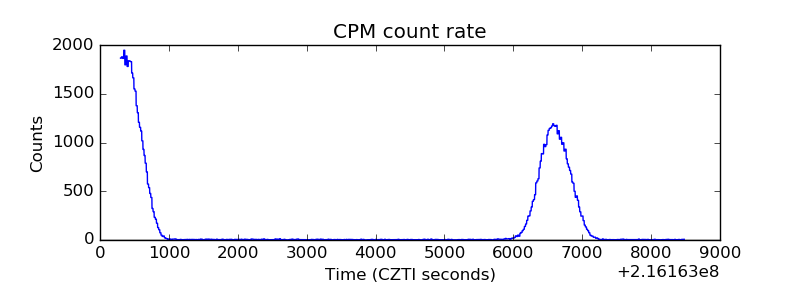 |
| CZT Counter | 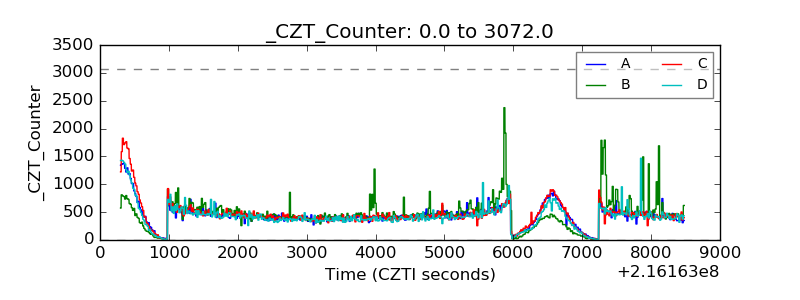 |
| +2.5 Volts monitor | 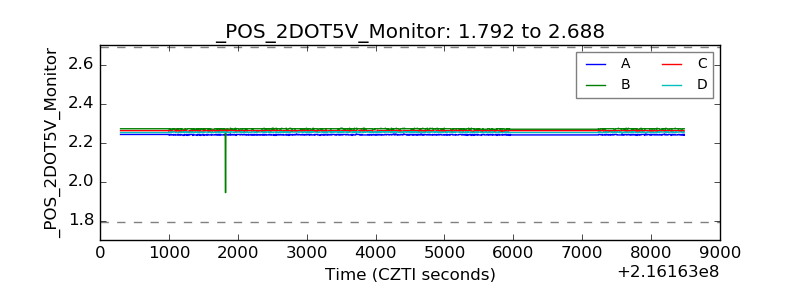 |
| +5 Volts monitor |  |
| _ROLL_ROT | 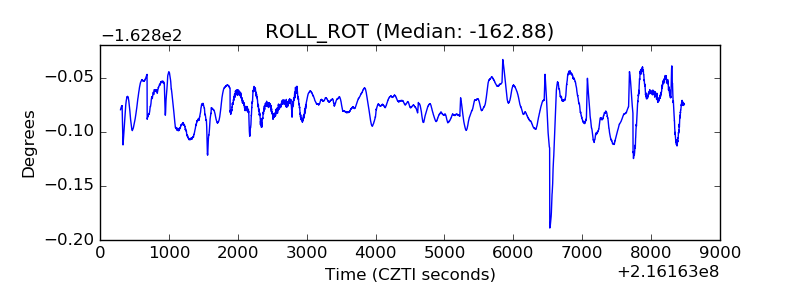 |
| _Roll_DEC | 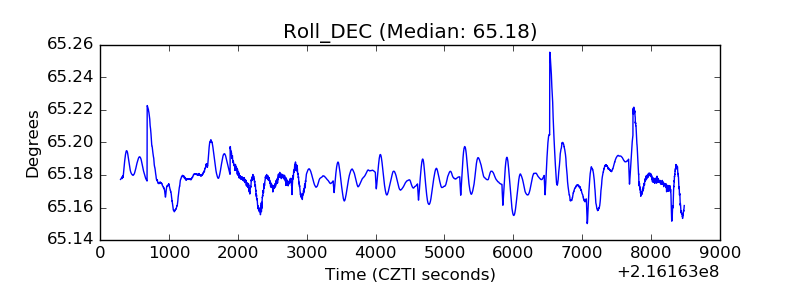 |
| _Roll_RA | 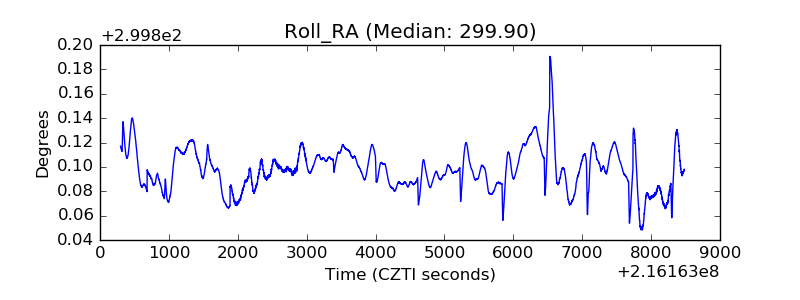 |
| Veto Counter | 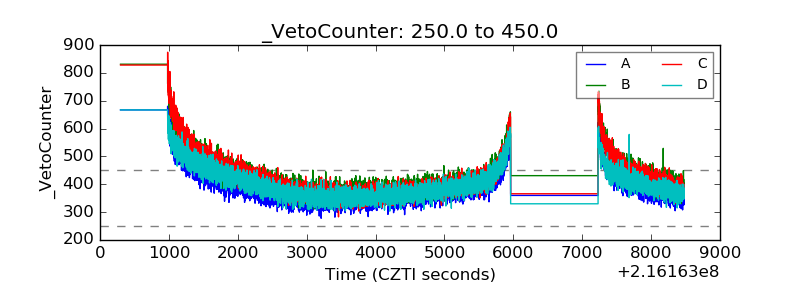 |