| Param | Original file | Final file |
|---|---|---|
| Filename | modeM0/AS1G06_086T01_9000000774_06008cztM0_level2.evt | modeM0/AS1G06_086T01_9000000774_06008cztM0_level2_quad_clean.evt |
| Size (bytes) | 599,768,640 | 123,975,360 |
| Size | 572.0 MB | 118.2 MB |
| Events in quadrant A | 3,169,099 | 869,465 |
| Events in quadrant B | 4,333,425 | 873,021 |
| Events in quadrant C | 7,084,157 | 693,655 |
| Events in quadrant D | 3,096,747 | 824,762 |
| Mode SS | |||
|---|---|---|---|
| Quadrant | BADHDUFLAG | Total packets | Discarded packets |
| A | 0 | 146 | 0 |
| B | 0 | 146 | 0 |
| C | 0 | 146 | 0 |
| D | 0 | 146 | 0 |
| Mode M9 | |||
|---|---|---|---|
| Quadrant | BADHDUFLAG | Total packets | Discarded packets |
| A | 0 | 24 | 0 |
| B | 0 | 24 | 0 |
| C | 0 | 24 | 0 |
| D | 0 | 24 | 0 |
| Mode M0 | |||
|---|---|---|---|
| Quadrant | BADHDUFLAG | Total packets | Discarded packets |
| A | 0 | 14649 | 3 |
| B | 0 | 17814 | 2 |
| C | 0 | 26088 | 2 |
| D | 0 | 14720 | 2 |
| Quadrant | Total seconds | Saturated seconds | Saturation percentage |
|---|---|---|---|
| A | 7080 | 57 | 0.805085% |
| B | 7080 | 378 | 5.338983% |
| C | 7080 | 1708 | 24.124294% |
| D | 7080 | 47 | 0.663842% |
Noise dominated data is calculated using 1-second bins in cleaned event files. If a bin has >2000 counts, and if more than 50% of those come from <1% of pixels, then it is considered to be noise-dominated and hence unusable.
| Quadrant | # 1 sec bins | Bins with >0 counts | Bins with >2000 counts | High rate bins dominated by noise | Noise dominated (total time) | Noise dominated (detector-on time) | Marked lightcurve |
|---|---|---|---|---|---|---|---|
| A | 9465 | 7082 | 0 | 0 | 0.00% | 0.00% | 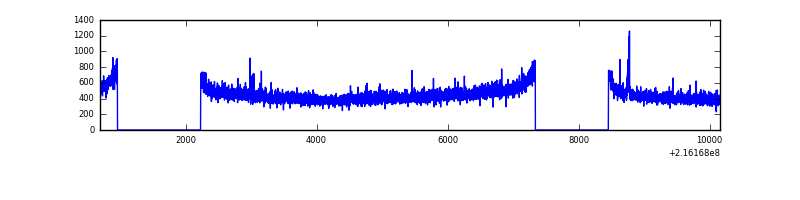 |
| B | 9465 | 7081 | 156 | 156 | 1.65% | 2.20% | 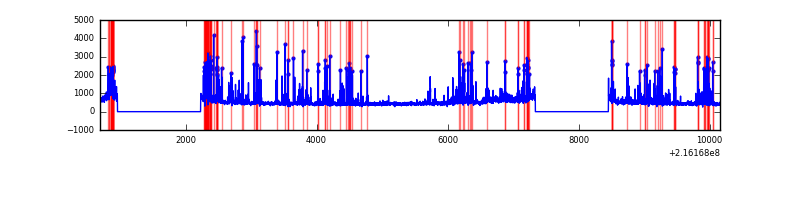 |
| C | 9465 | 7081 | 1636 | 1636 | 17.28% | 23.10% |  |
| D | 9465 | 7082 | 11 | 11 | 0.12% | 0.16% | 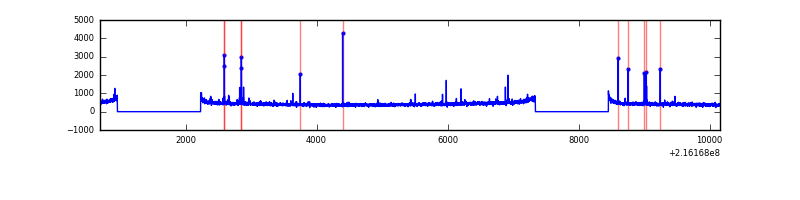 |
Top three noisy pixels from each quadrant. If the there are fewer than three noisy pixels in the level2.evt file, extra rows are filled as -1
| Pixel properties | Quadrant properties | ||||||
|---|---|---|---|---|---|---|---|
| Quadrant | DetID | PixID | Counts | Sigma | Mean | Median | Sigma |
| A | 15 | 234 | 20202 | 117.75 | 814 | 795 | 164.8 |
| A | 0 | 226 | 7906 | 43.14 | 814 | 795 | 164.8 |
| A | 12 | 194 | 7866 | 42.9 | 814 | 795 | 164.8 |
| B | 3 | 64 | 888044 | 5718.41 | 816 | 794 | 155.2 |
| B | 15 | 204 | 94446 | 603.59 | 816 | 794 | 155.2 |
| B | 0 | 214 | 88600 | 565.91 | 816 | 794 | 155.2 |
| C | 1 | 241 | 4529455 | 30401.08 | 645 | 650 | 149.0 |
| C | 1 | 16 | 21896 | 142.62 | 645 | 650 | 149.0 |
| C | 14 | 206 | 9791 | 61.36 | 645 | 650 | 149.0 |
| D | 2 | 14 | 34623 | 174.73 | 788 | 762 | 193.8 |
| D | 8 | 195 | 19770 | 98.08 | 788 | 762 | 193.8 |
| D | 2 | 206 | 15996 | 78.61 | 788 | 762 | 193.8 |
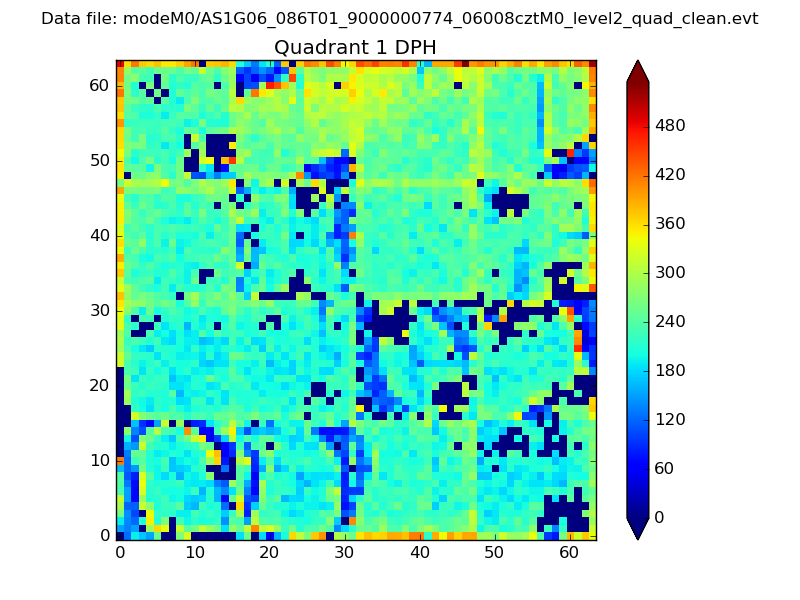
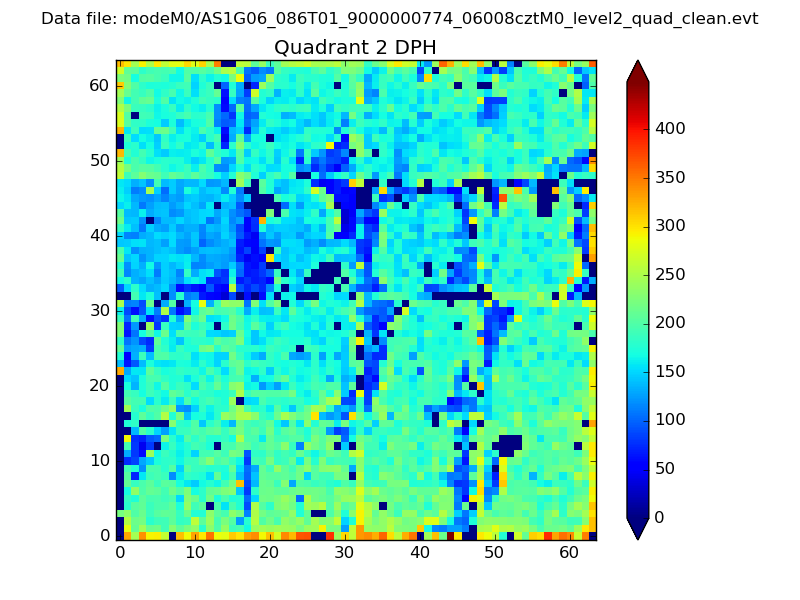
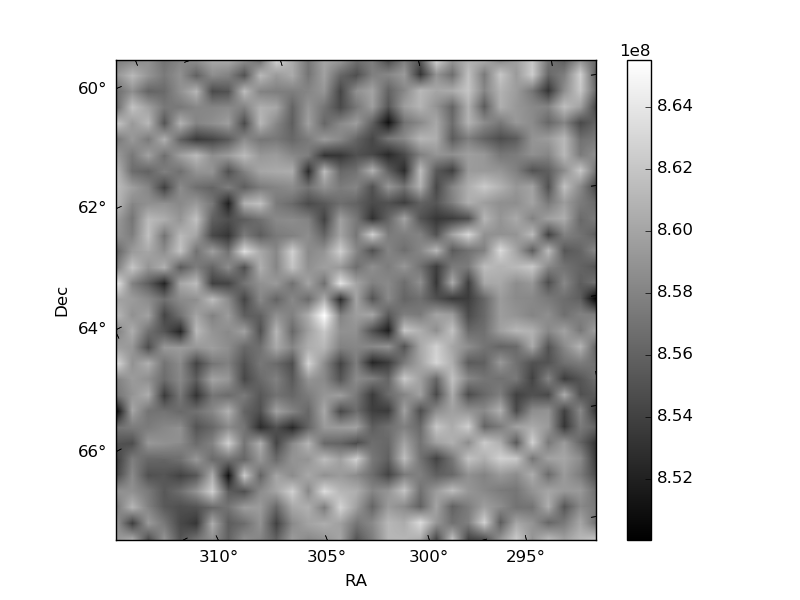
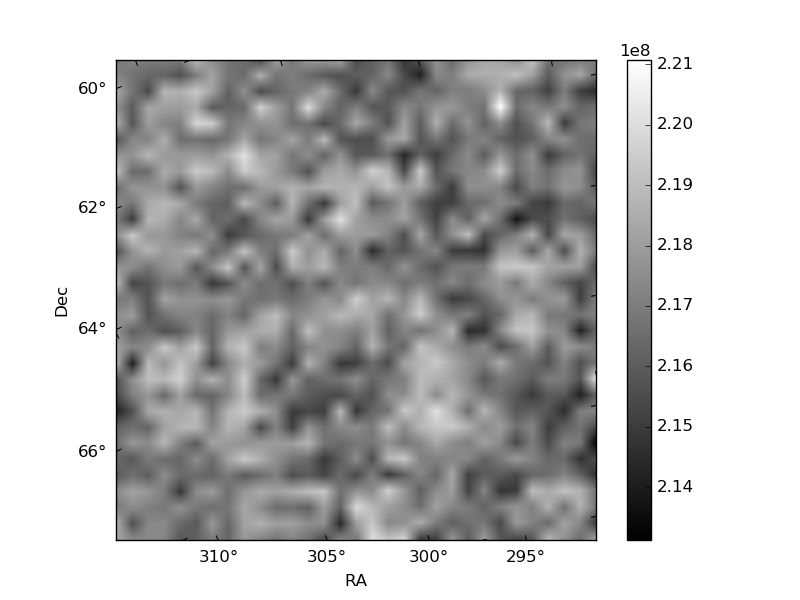
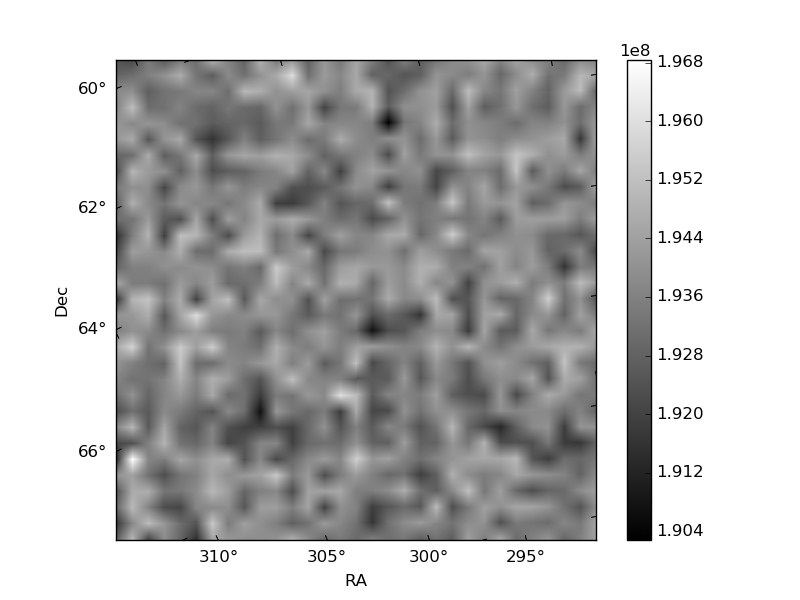
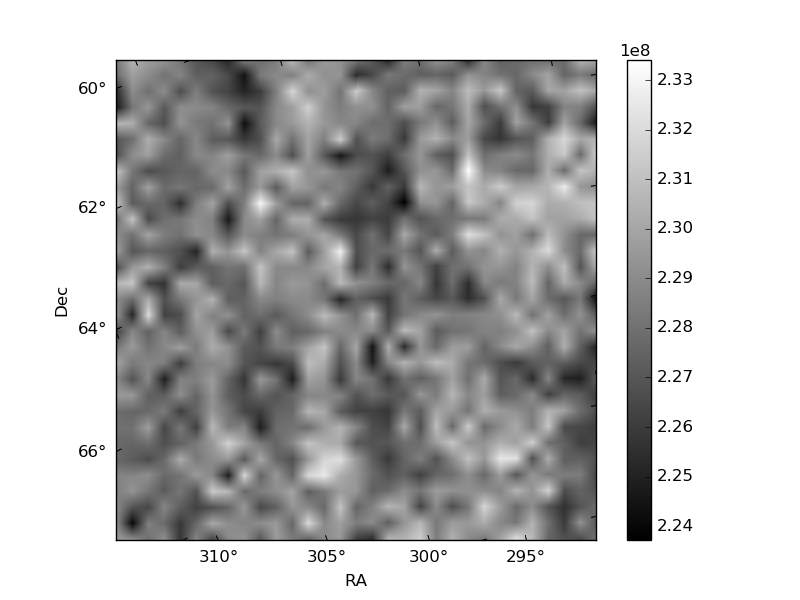
Histogram calculated using DETX and DETY for each event in the final _common_clean file
| Quadrant A | 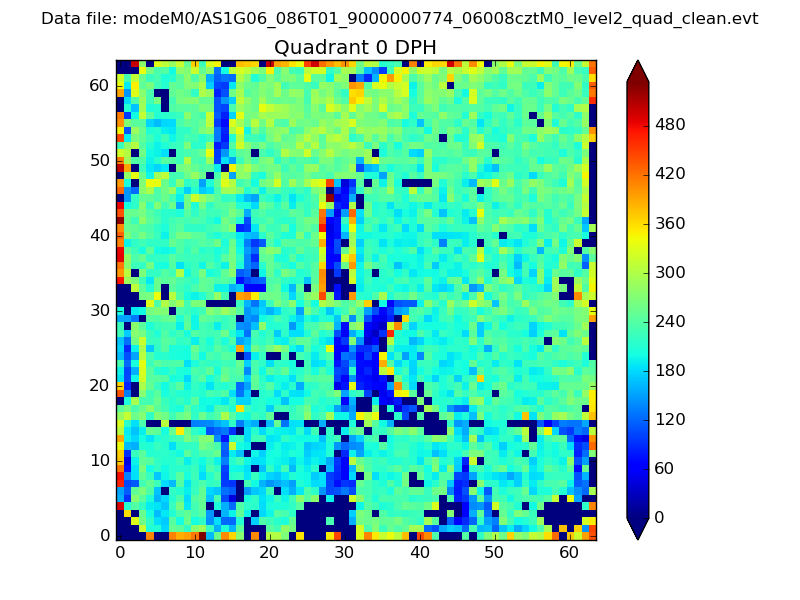 |
 |
Quadrant B |
|---|---|---|---|
| Quadrant D | 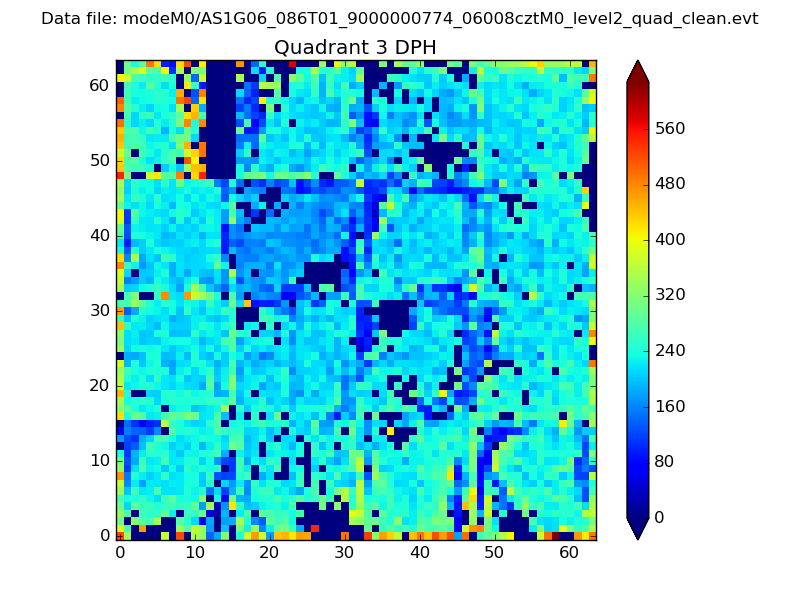 |
 |
Quadrant C |
| Plot type | Count rate plots | Images |
|---|---|---|
| Comparison with Poisson distribution Blue bars denote a histogram of data divided into 1 sec bins. Red curve is a Poisson curve with rate = median count rate of data. |
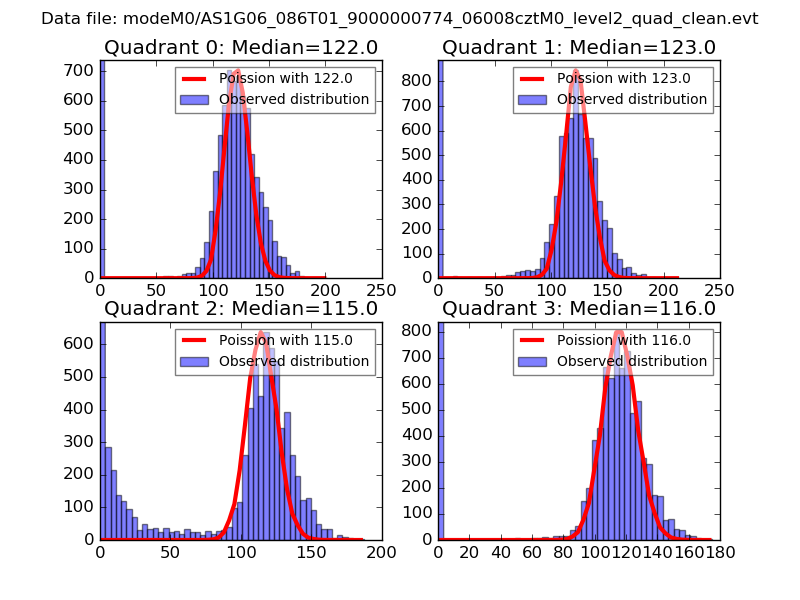 |
 |
| Quadrant-wise count rates Data is divided into 100 sec bins |
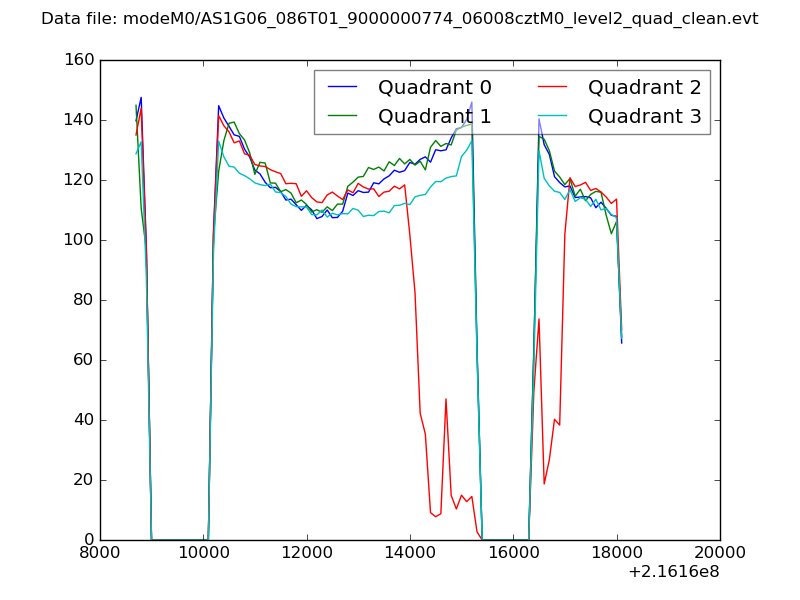 |
|
| Module-wise count rates for Quadrant A Data is divided into 100 sec bins |
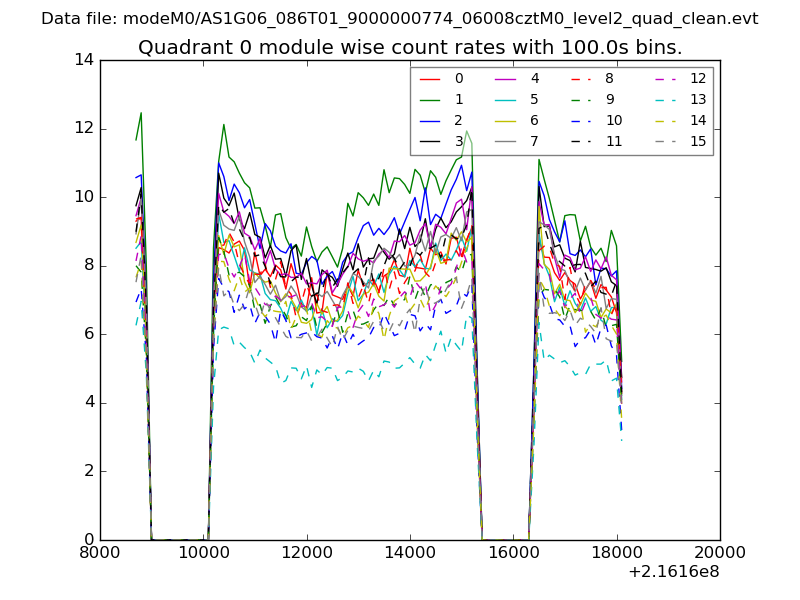 |
 |
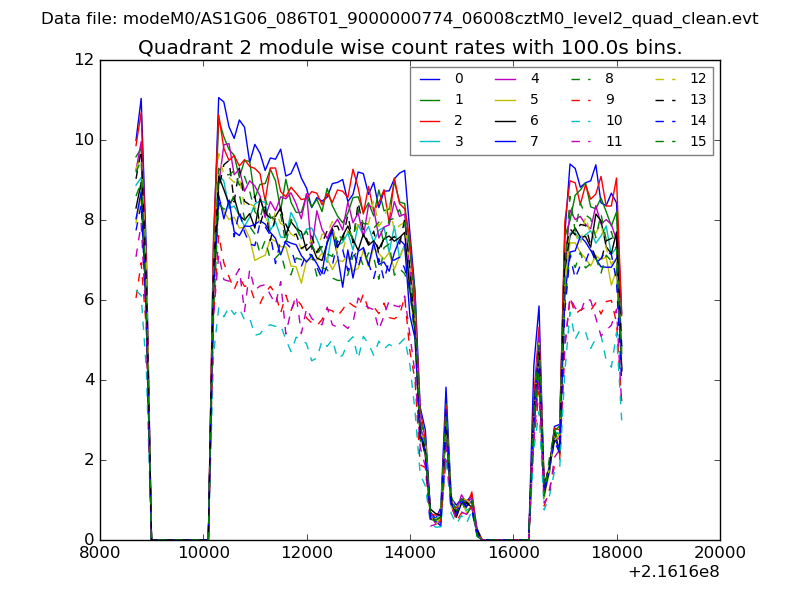
| Module-wise count rates for Quadrant B Data is divided into 100 sec bins |
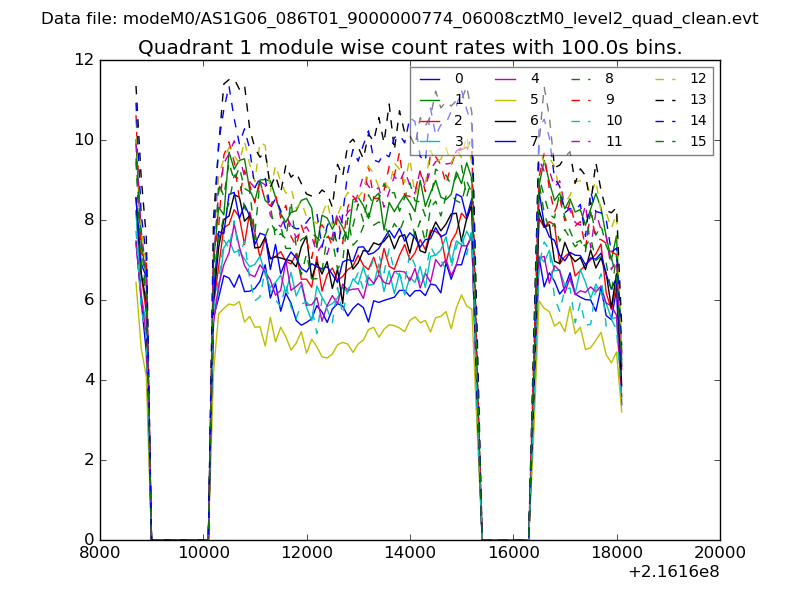 |
 |
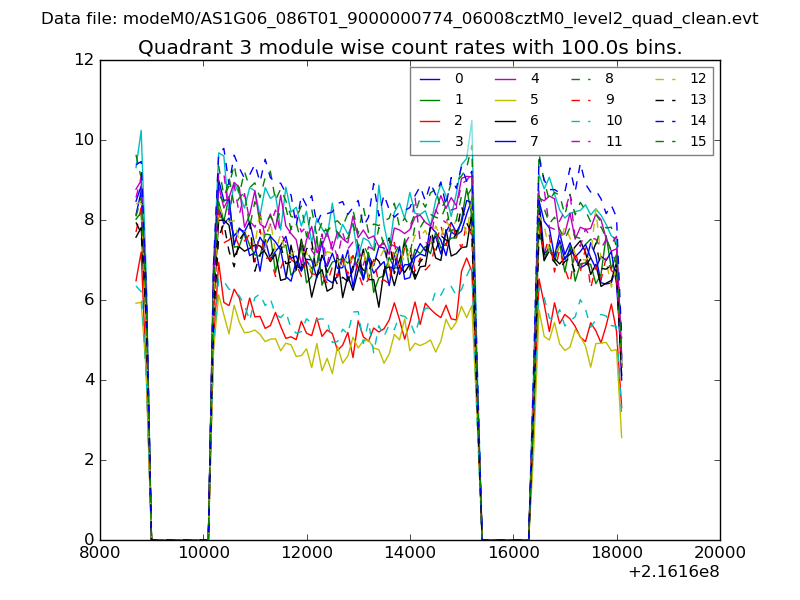
| Module-wise count rates for Quadrant C Data is divided into 100 sec bins |
 |
 |
| Module-wise count rates for Quadrant D Data is divided into 100 sec bins |
 |
 |
| Parameter | Plot |
|---|---|
| CZT HV Monitor | 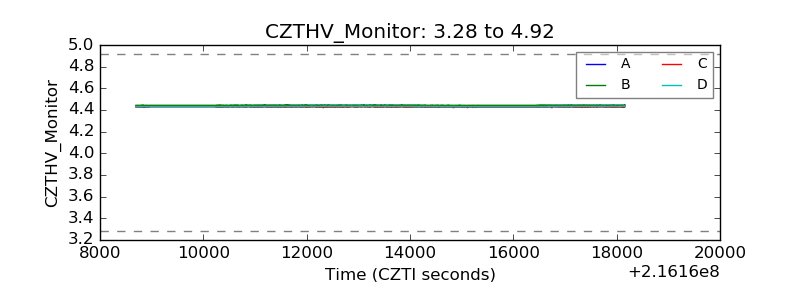 |
| D_VDD | 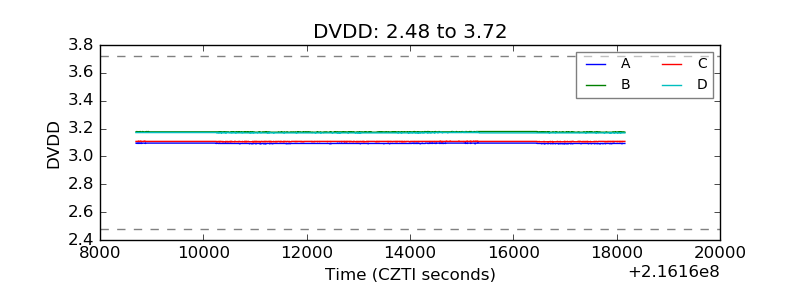 |
| Temperature 1 | 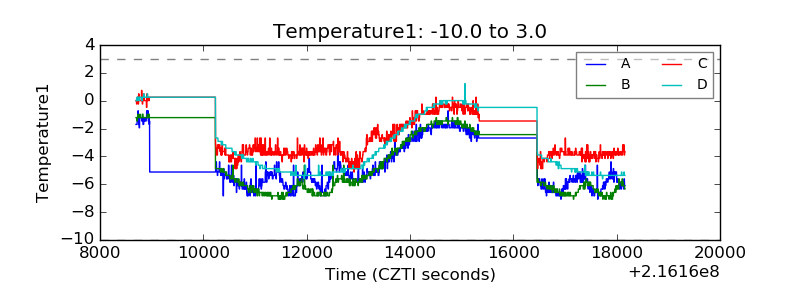 |
| Veto HV Monitor | 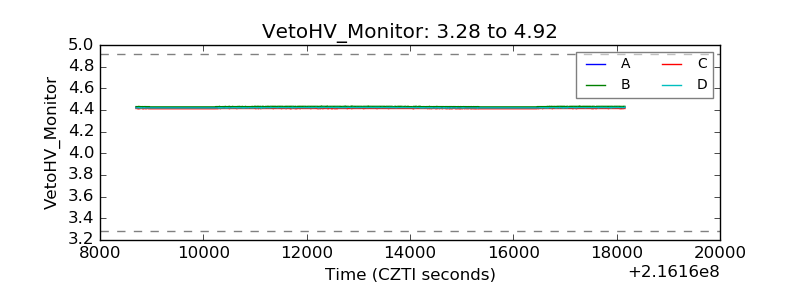 |
| Veto LLD | 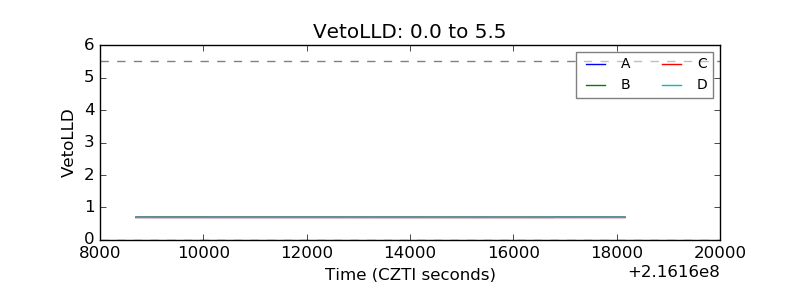 |
| Alpha Counter | 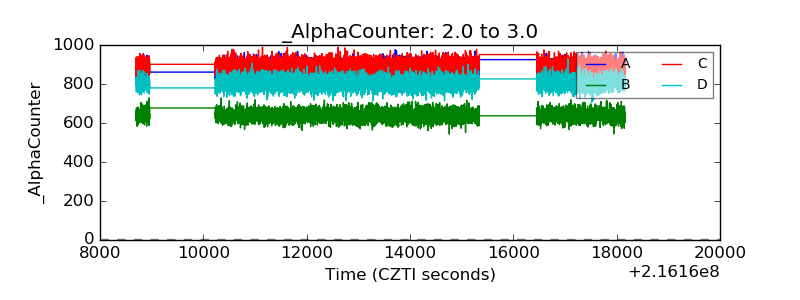 |
| _CPM_Rate | 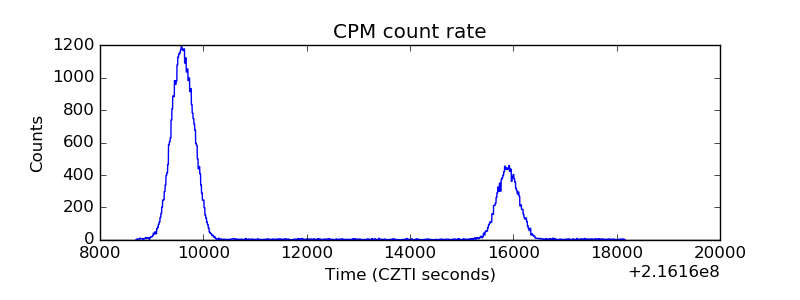 |
| CZT Counter | 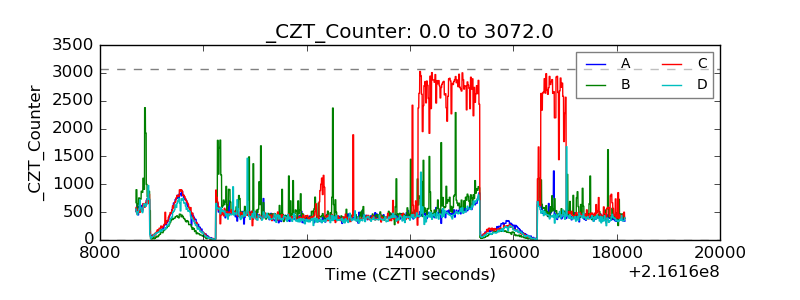 |
| +2.5 Volts monitor | 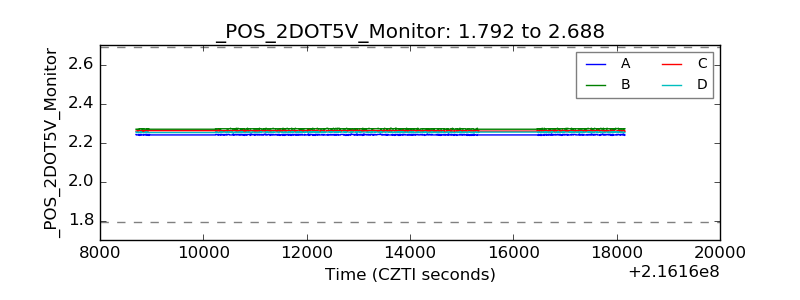 |
| +5 Volts monitor |  |
| _ROLL_ROT | 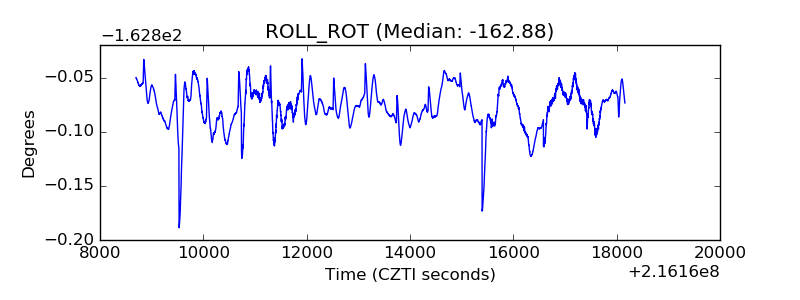 |
| _Roll_DEC | 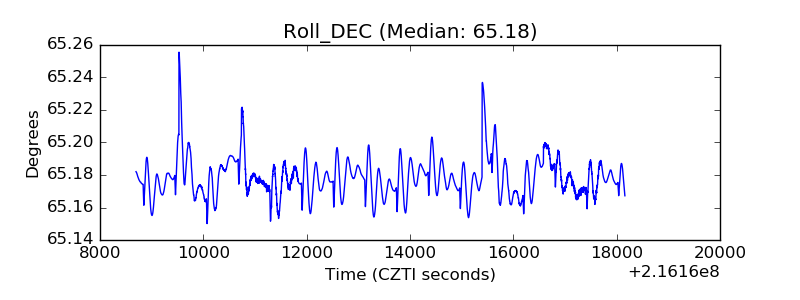 |
| _Roll_RA | 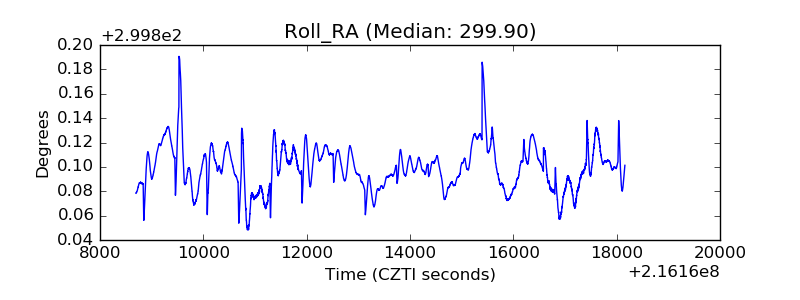 |
| Veto Counter | 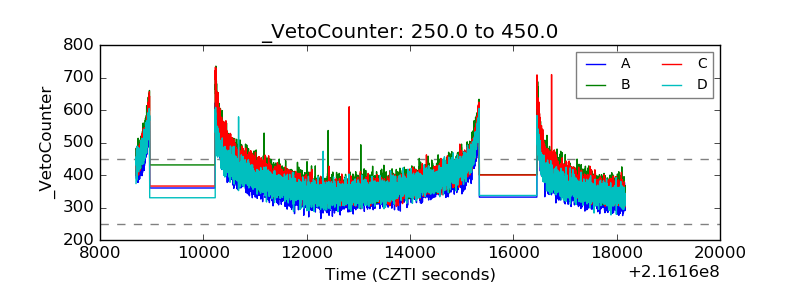 |