| Param | Original file | Final file |
|---|---|---|
| Filename | modeM0/AS1G06_086T01_9000000774_06009cztM0_level2.evt | modeM0/AS1G06_086T01_9000000774_06009cztM0_level2_quad_clean.evt |
| Size (bytes) | 498,853,440 | 123,312,960 |
| Size | 475.7 MB | 117.6 MB |
| Events in quadrant A | 3,146,800 | 831,146 |
| Events in quadrant B | 4,006,198 | 839,156 |
| Events in quadrant C | 4,444,885 | 782,644 |
| Events in quadrant D | 3,032,245 | 792,093 |
| Mode SS | |||
|---|---|---|---|
| Quadrant | BADHDUFLAG | Total packets | Discarded packets |
| A | 0 | 142 | 0 |
| B | 0 | 142 | 0 |
| C | 0 | 142 | 0 |
| D | 0 | 142 | 0 |
| Mode M9 | |||
|---|---|---|---|
| Quadrant | BADHDUFLAG | Total packets | Discarded packets |
| A | 0 | 10 | 0 |
| B | 0 | 10 | 0 |
| C | 0 | 10 | 0 |
| D | 0 | 11 | 0 |
| Mode M0 | |||
|---|---|---|---|
| Quadrant | BADHDUFLAG | Total packets | Discarded packets |
| A | 0 | 14558 | 3 |
| B | 0 | 16738 | 2 |
| C | 0 | 18293 | 2 |
| D | 0 | 14538 | 2 |
| Quadrant | Total seconds | Saturated seconds | Saturation percentage |
|---|---|---|---|
| A | 7030 | 44 | 0.625889% |
| B | 7030 | 207 | 2.944523% |
| C | 7030 | 557 | 7.923186% |
| D | 7030 | 35 | 0.497866% |
Noise dominated data is calculated using 1-second bins in cleaned event files. If a bin has >2000 counts, and if more than 50% of those come from <1% of pixels, then it is considered to be noise-dominated and hence unusable.
| Quadrant | # 1 sec bins | Bins with >0 counts | Bins with >2000 counts | High rate bins dominated by noise | Noise dominated (total time) | Noise dominated (detector-on time) | Marked lightcurve |
|---|---|---|---|---|---|---|---|
| A | 7835 | 7031 | 5 | 5 | 0.06% | 0.07% | 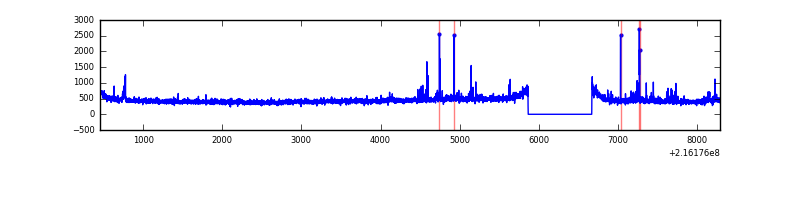 |
| B | 7835 | 7030 | 97 | 97 | 1.24% | 1.38% | 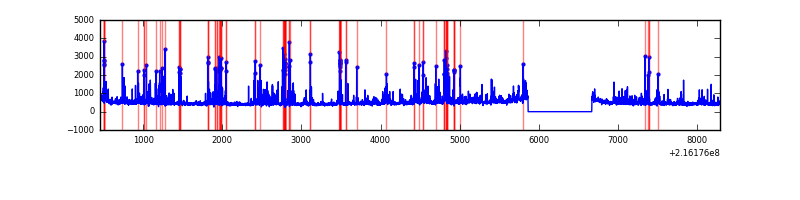 |
| C | 7835 | 7031 | 507 | 507 | 6.47% | 7.21% | 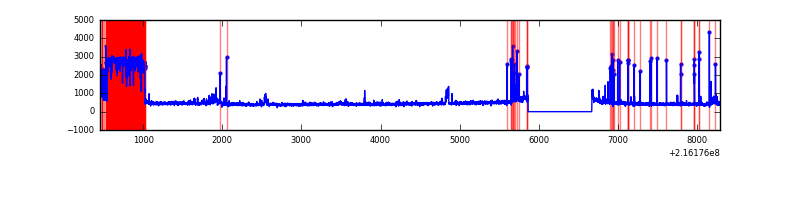 |
| D | 7835 | 7031 | 18 | 18 | 0.23% | 0.26% | 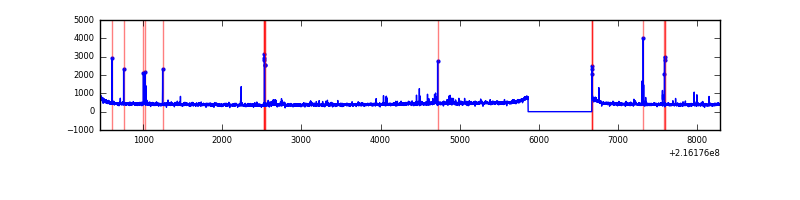 |
Top three noisy pixels from each quadrant. If the there are fewer than three noisy pixels in the level2.evt file, extra rows are filled as -1
| Pixel properties | Quadrant properties | ||||||
|---|---|---|---|---|---|---|---|
| Quadrant | DetID | PixID | Counts | Sigma | Mean | Median | Sigma |
| A | 7 | 16 | 88637 | 549.5 | 784 | 765 | 159.9 |
| A | 15 | 234 | 28377 | 172.67 | 784 | 765 | 159.9 |
| A | 12 | 194 | 7559 | 42.48 | 784 | 765 | 159.9 |
| B | 3 | 64 | 639676 | 4259.46 | 793 | 775 | 150.0 |
| B | 4 | 81 | 144454 | 957.89 | 793 | 775 | 150.0 |
| B | 15 | 204 | 54626 | 359.02 | 793 | 775 | 150.0 |
| C | 1 | 241 | 1543813 | 9100.56 | 731 | 734 | 169.6 |
| C | 1 | 16 | 20476 | 116.43 | 731 | 734 | 169.6 |
| C | 12 | 4 | 16158 | 90.97 | 731 | 734 | 169.6 |
| D | 2 | 14 | 40322 | 212.32 | 761 | 737 | 186.4 |
| D | 12 | 110 | 35912 | 188.66 | 761 | 737 | 186.4 |
| D | 8 | 195 | 22338 | 115.86 | 761 | 737 | 186.4 |
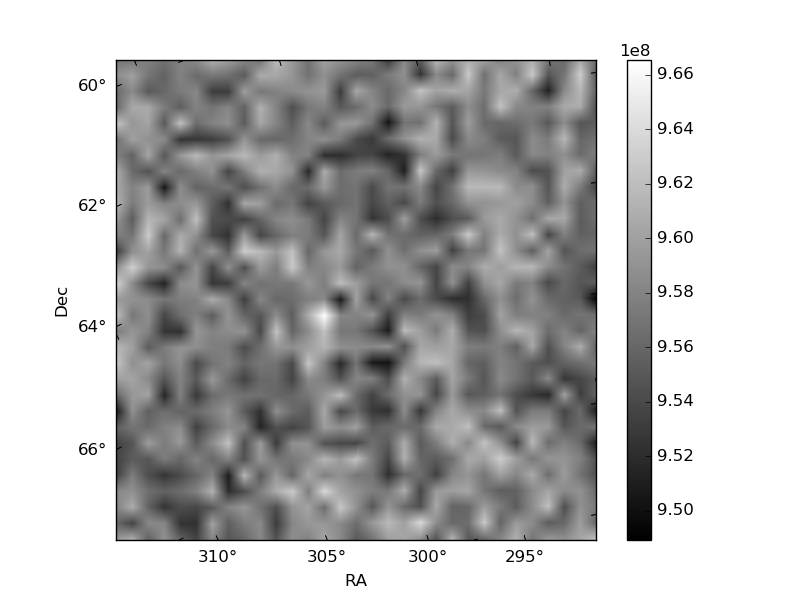
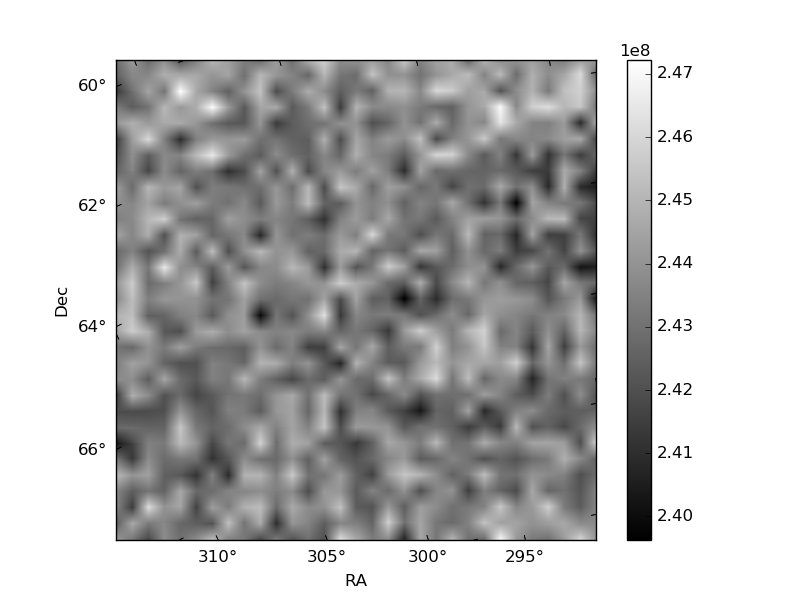
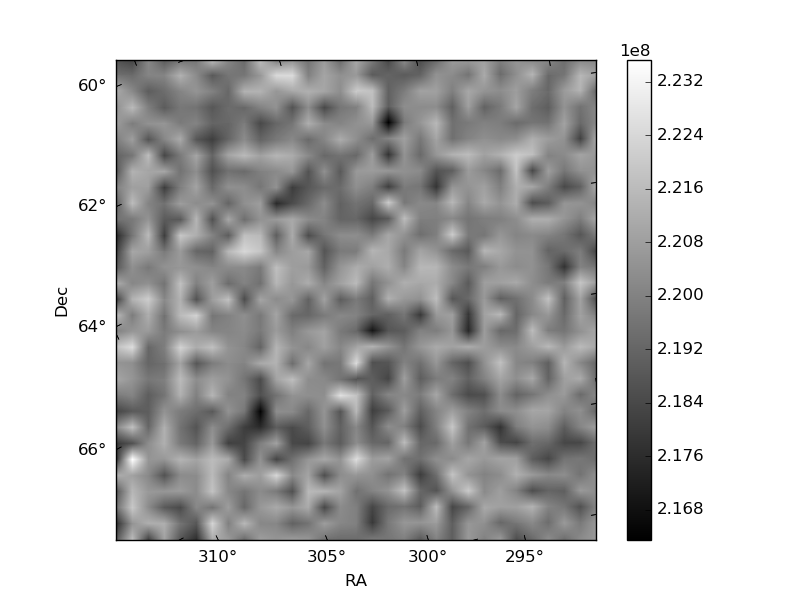
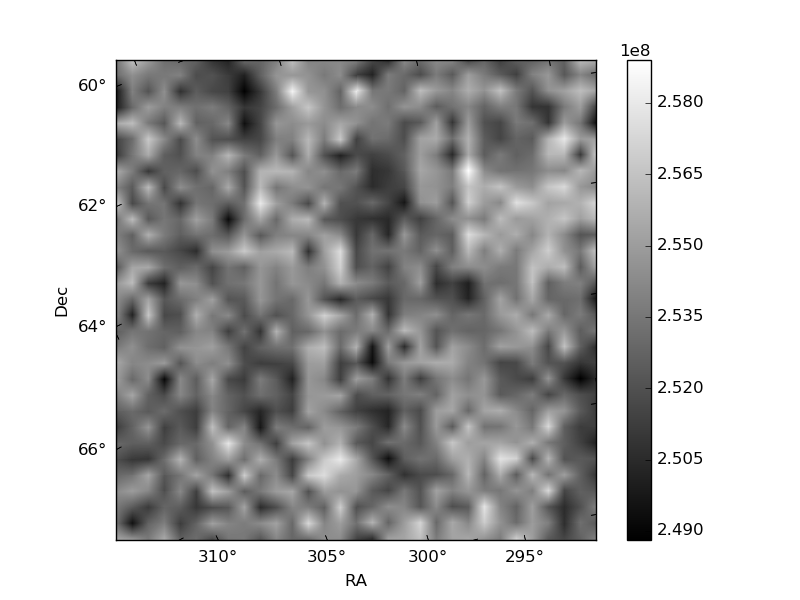
Histogram calculated using DETX and DETY for each event in the final _common_clean file
| Quadrant A | 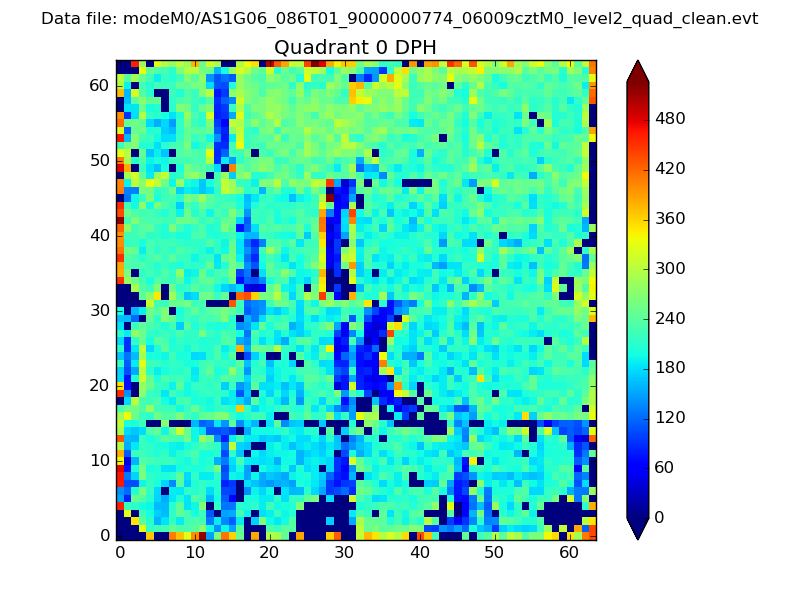 |
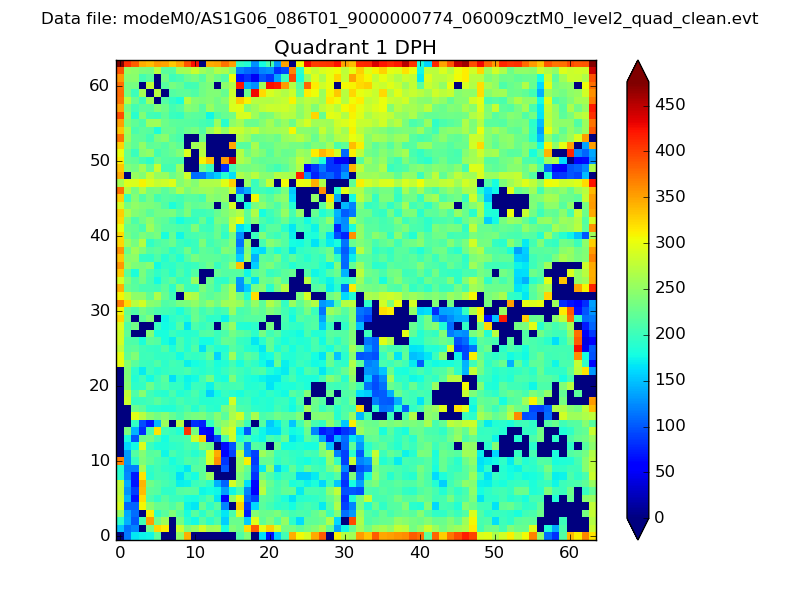 |
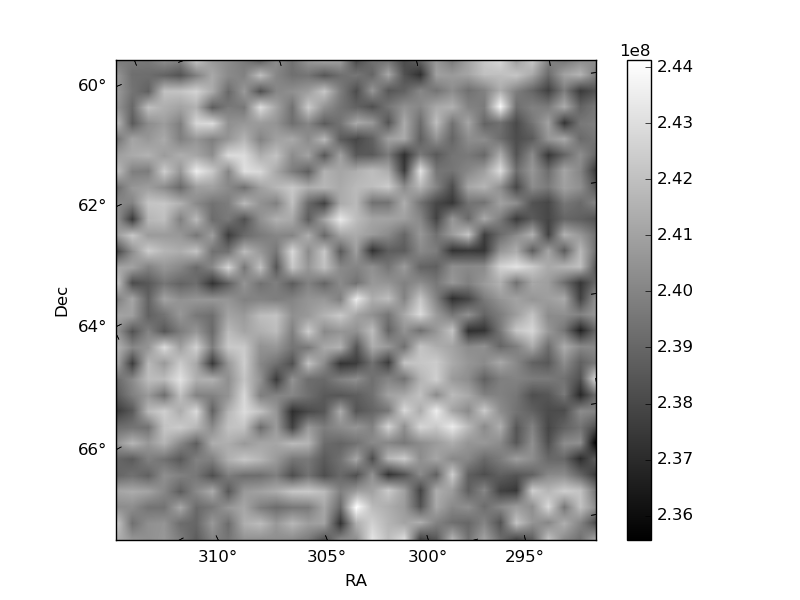
Quadrant B |
|---|---|---|---|
| Quadrant D | 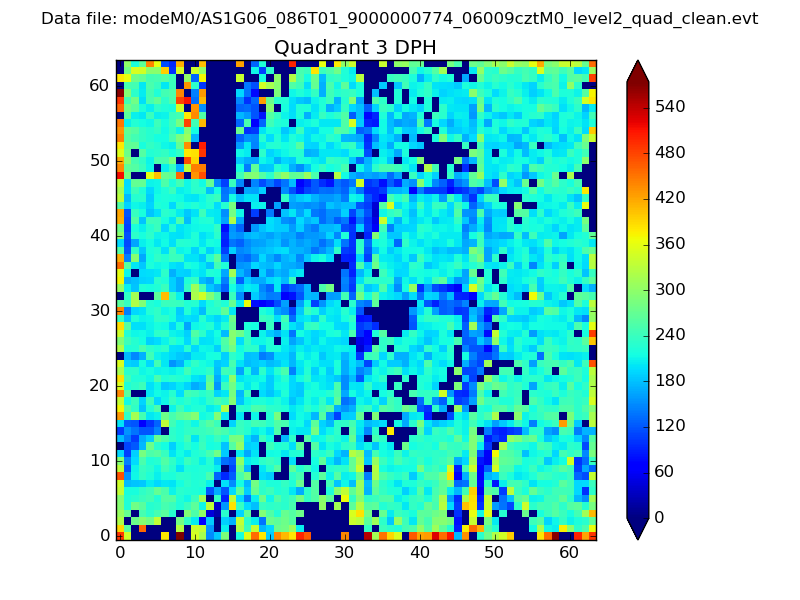 |
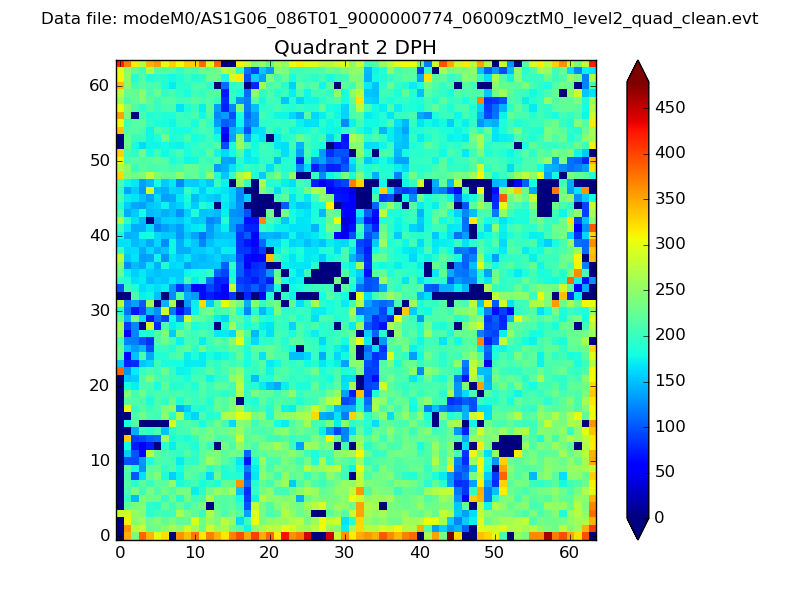 |
Quadrant C |
| Plot type | Count rate plots | Images |
|---|---|---|
| Comparison with Poisson distribution Blue bars denote a histogram of data divided into 1 sec bins. Red curve is a Poisson curve with rate = median count rate of data. |
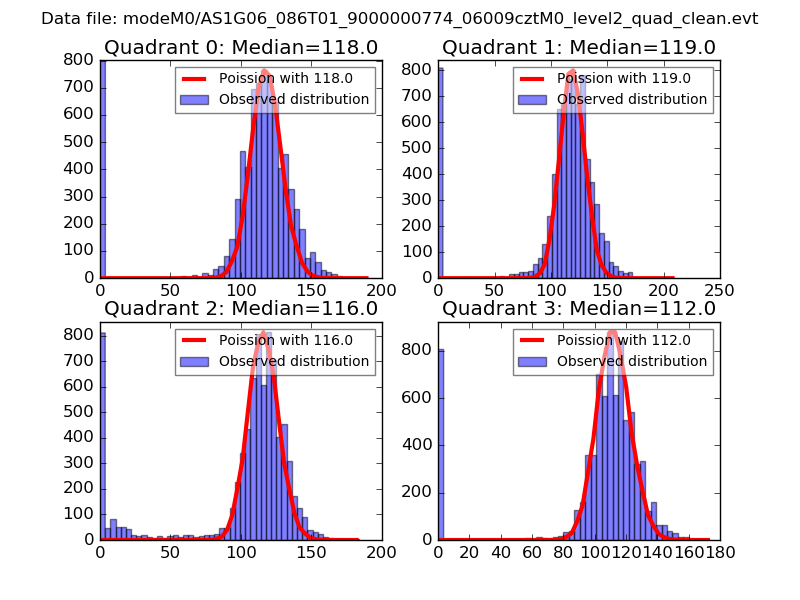 |
 |
| Quadrant-wise count rates Data is divided into 100 sec bins |
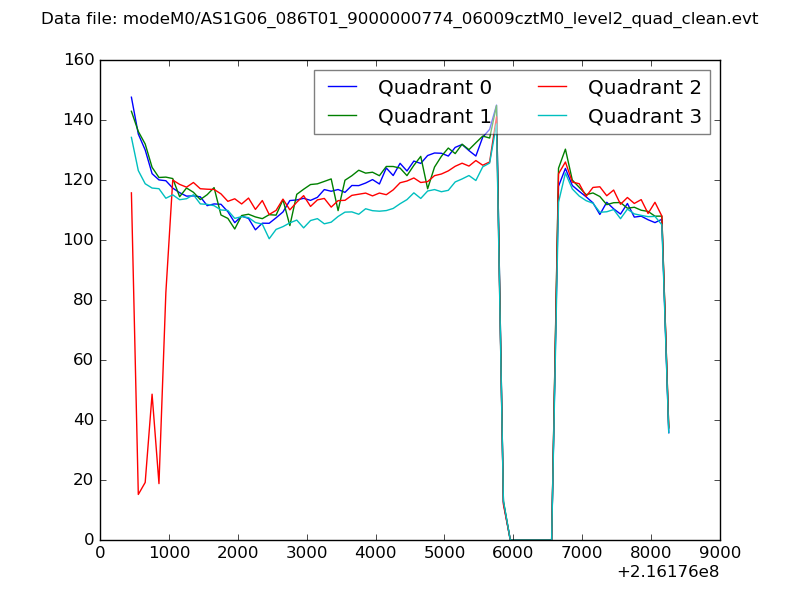 |
|
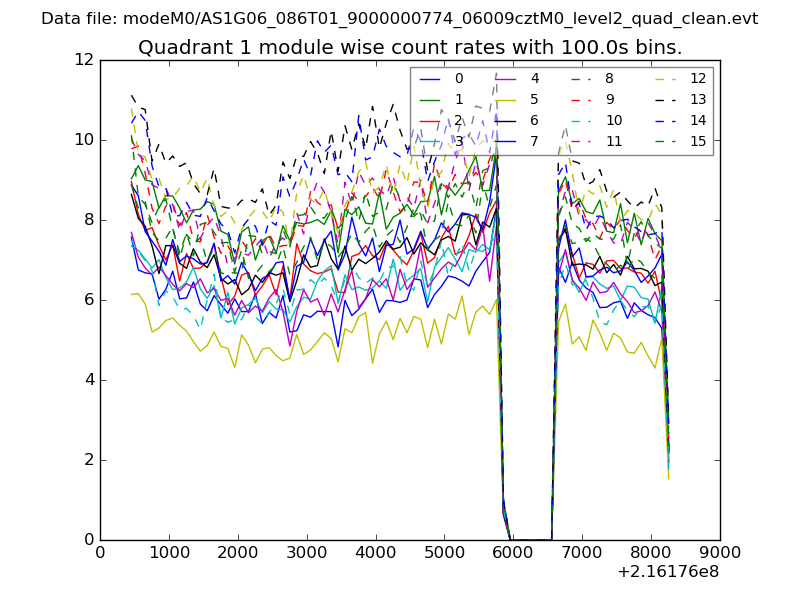
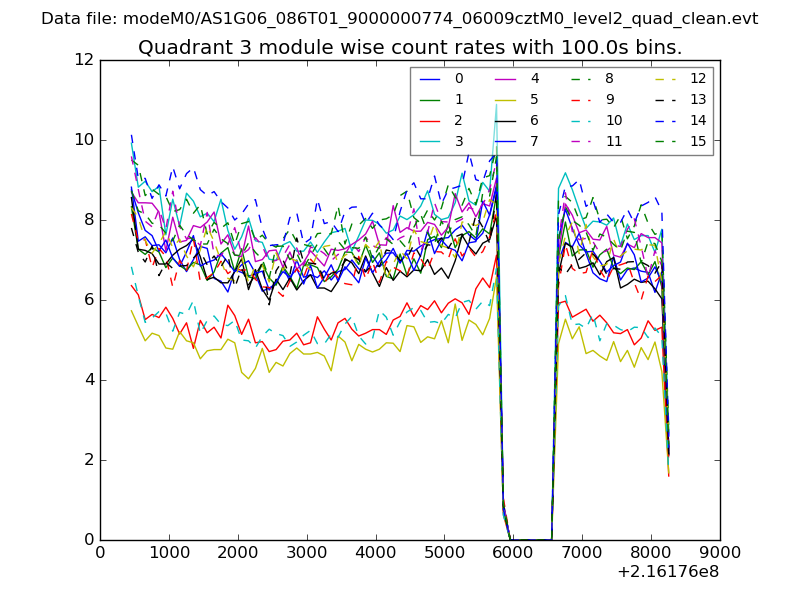
| Module-wise count rates for Quadrant A Data is divided into 100 sec bins |
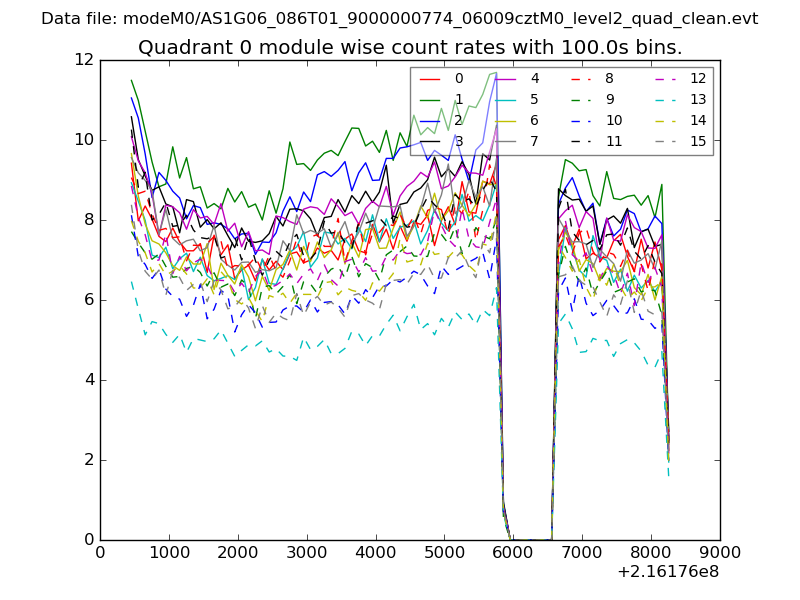 |
 |
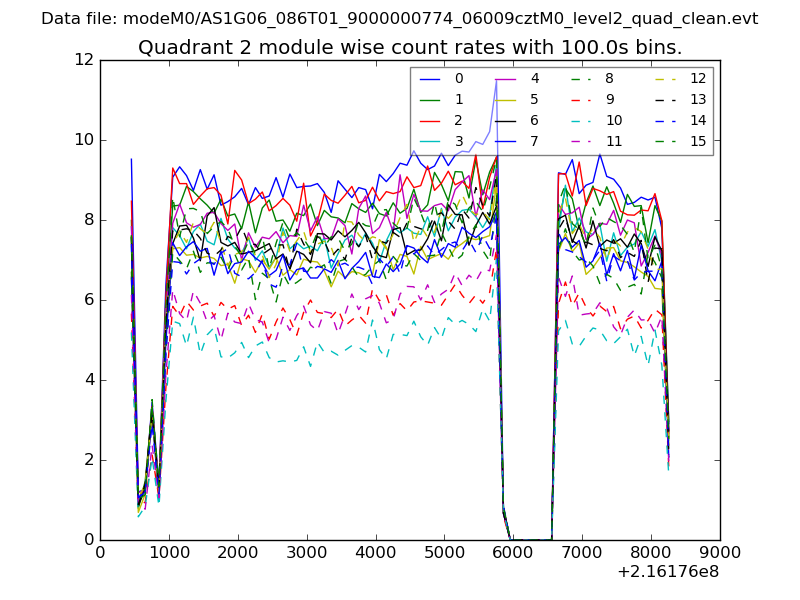
| Module-wise count rates for Quadrant B Data is divided into 100 sec bins |
 |
 |
| Module-wise count rates for Quadrant C Data is divided into 100 sec bins |
 |
 |
| Module-wise count rates for Quadrant D Data is divided into 100 sec bins |
 |
 |
| Parameter | Plot |
|---|---|
| CZT HV Monitor | 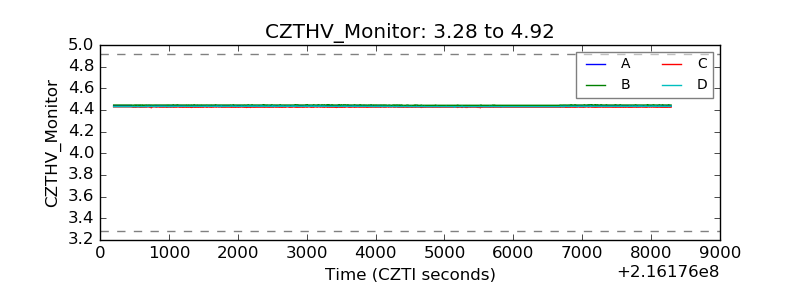 |
| D_VDD | 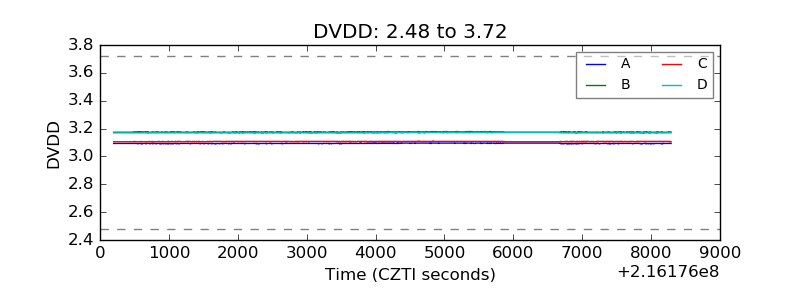 |
| Temperature 1 | 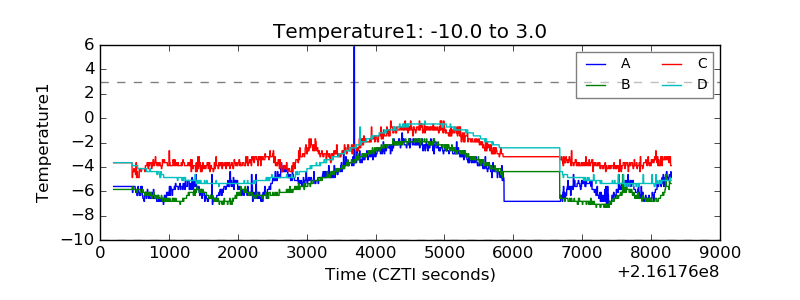 |
| Veto HV Monitor | 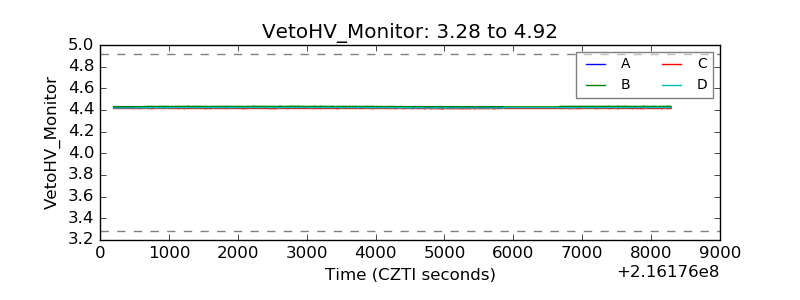 |
| Veto LLD | 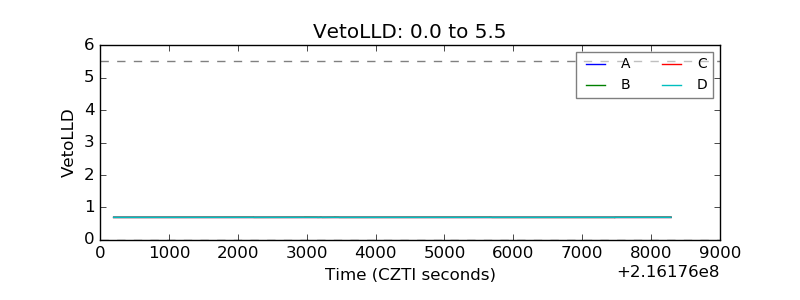 |
| Alpha Counter | 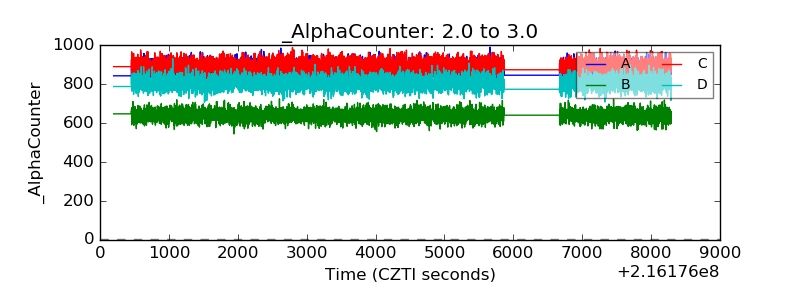 |
| _CPM_Rate | 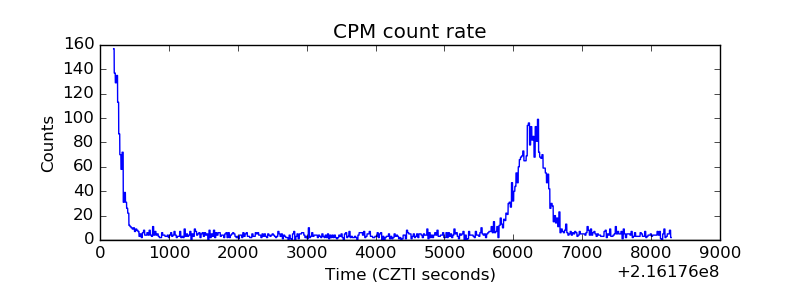 |
| CZT Counter | 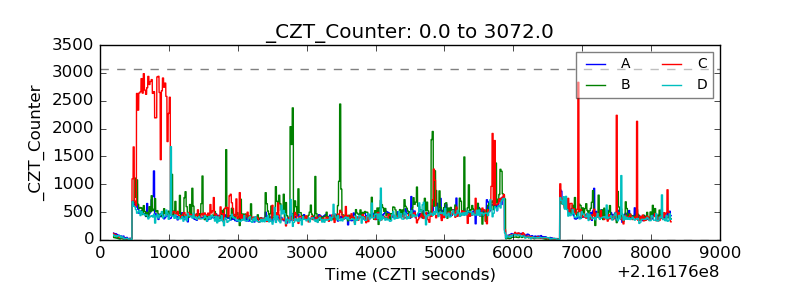 |
| +2.5 Volts monitor | 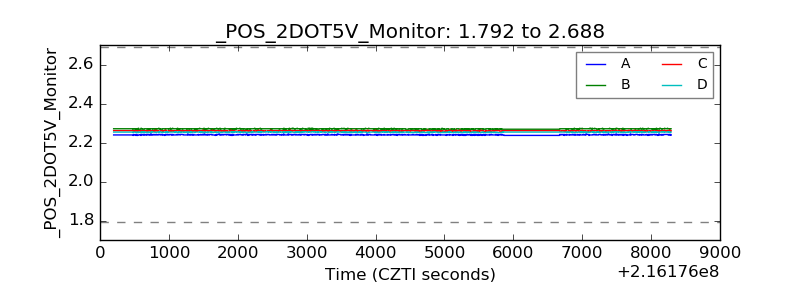 |
| +5 Volts monitor | 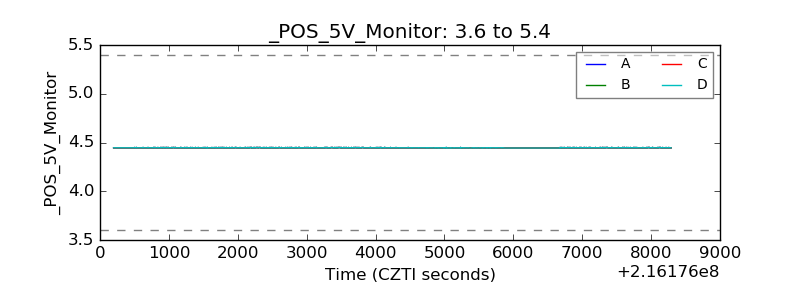 |
| _ROLL_ROT | 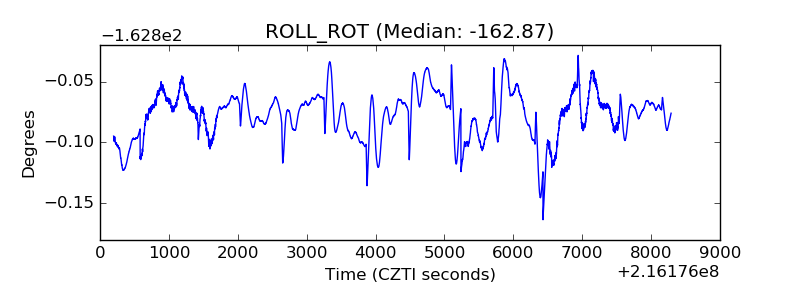 |
| _Roll_DEC | 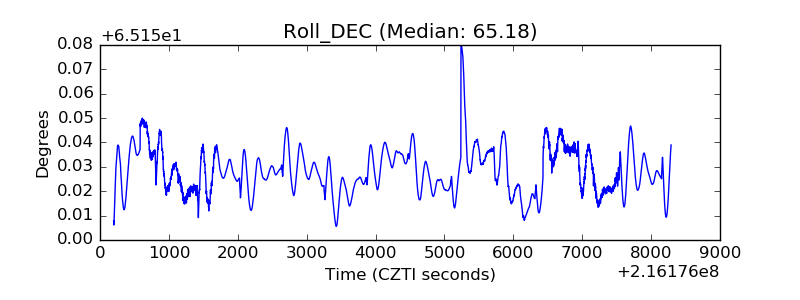 |
| _Roll_RA | 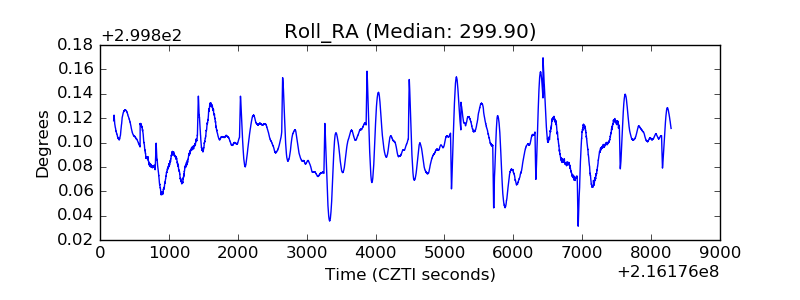 |
| Veto Counter | 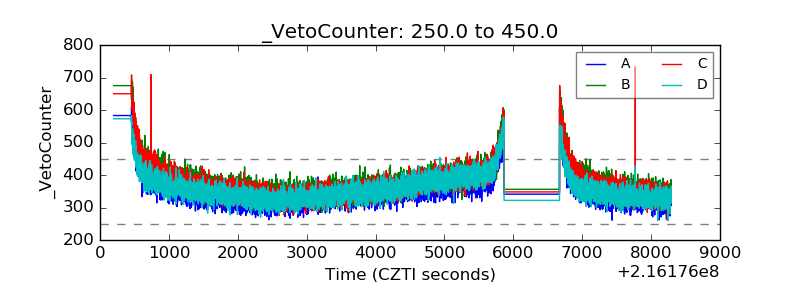 |