| Param | Original file | Final file |
|---|---|---|
| Filename | modeM0/AS1G06_086T01_9000000774_06011cztM0_level2.evt | modeM0/AS1G06_086T01_9000000774_06011cztM0_level2_quad_clean.evt |
| Size (bytes) | 577,287,360 | 125,890,560 |
| Size | 550.5 MB | 120.1 MB |
| Events in quadrant A | 4,582,521 | 834,113 |
| Events in quadrant B | 5,015,086 | 841,363 |
| Events in quadrant C | 3,149,881 | 842,782 |
| Events in quadrant D | 4,240,343 | 785,995 |
| Mode SS | |||
|---|---|---|---|
| Quadrant | BADHDUFLAG | Total packets | Discarded packets |
| A | 0 | 148 | 4 |
| B | 0 | 148 | 0 |
| C | 0 | 148 | 0 |
| D | 0 | 148 | 2 |
| Mode M0 | |||
|---|---|---|---|
| Quadrant | BADHDUFLAG | Total packets | Discarded packets |
| A | 0 | 18648 | 232 |
| B | 0 | 20211 | 374 |
| C | 0 | 15102 | 188 |
| D | 0 | 18379 | 203 |
| Quadrant | Total seconds | Saturated seconds | Saturation percentage |
|---|---|---|---|
| A | 7297 | 196 | 2.686035% |
| B | 7289 | 467 | 6.406915% |
| C | 7304 | 31 | 0.424425% |
| D | 7309 | 390 | 5.335887% |
Noise dominated data is calculated using 1-second bins in cleaned event files. If a bin has >2000 counts, and if more than 50% of those come from <1% of pixels, then it is considered to be noise-dominated and hence unusable.
| Quadrant | # 1 sec bins | Bins with >0 counts | Bins with >2000 counts | High rate bins dominated by noise | Noise dominated (total time) | Noise dominated (detector-on time) | Marked lightcurve |
|---|---|---|---|---|---|---|---|
| A | 7457 | 7380 | 15 | 15 | 0.20% | 0.20% | 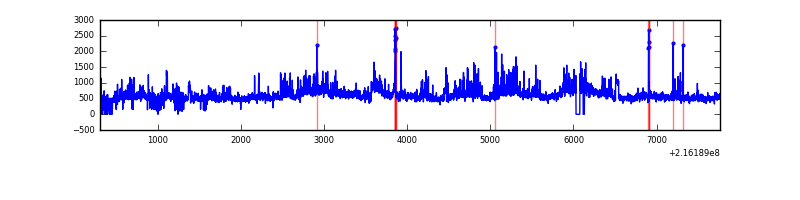 |
| B | 7457 | 7364 | 271 | 271 | 3.63% | 3.68% | 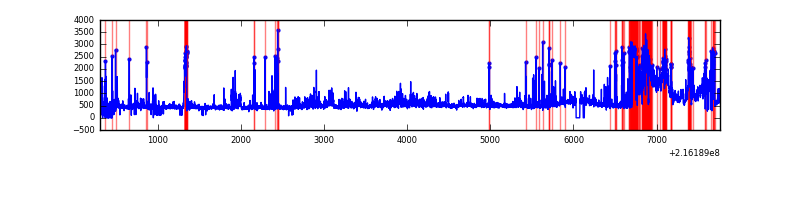 |
| C | 7457 | 7379 | 0 | 0 | 0.00% | 0.00% | 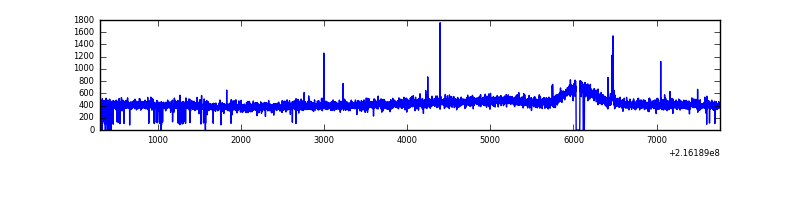 |
| D | 7457 | 7376 | 326 | 326 | 4.37% | 4.42% | 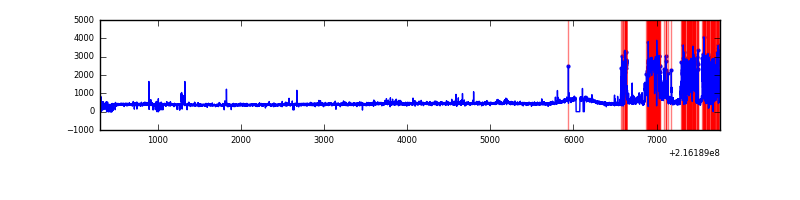 |
Top three noisy pixels from each quadrant. If the there are fewer than three noisy pixels in the level2.evt file, extra rows are filled as -1
| Pixel properties | Quadrant properties | ||||||
|---|---|---|---|---|---|---|---|
| Quadrant | DetID | PixID | Counts | Sigma | Mean | Median | Sigma |
| A | 13 | 34 | 1245171 | 7468.23 | 815 | 794 | 166.6 |
| A | 7 | 16 | 144374 | 861.71 | 815 | 794 | 166.6 |
| A | 15 | 234 | 47546 | 280.59 | 815 | 794 | 166.6 |
| B | 3 | 64 | 1466229 | 9359.04 | 817 | 796 | 156.6 |
| B | 15 | 204 | 124382 | 789.29 | 817 | 796 | 156.6 |
| B | 4 | 81 | 113731 | 721.26 | 817 | 796 | 156.6 |
| C | 9 | 54 | 16865 | 87.19 | 798 | 800 | 184.2 |
| C | 1 | 16 | 11138 | 56.11 | 798 | 800 | 184.2 |
| C | 13 | 61 | 6226 | 29.45 | 798 | 800 | 184.2 |
| D | 12 | 110 | 1172913 | 6048.97 | 780 | 753 | 193.8 |
| D | 12 | 221 | 69132 | 352.87 | 780 | 753 | 193.8 |
| D | 8 | 195 | 22736 | 113.44 | 780 | 753 | 193.8 |
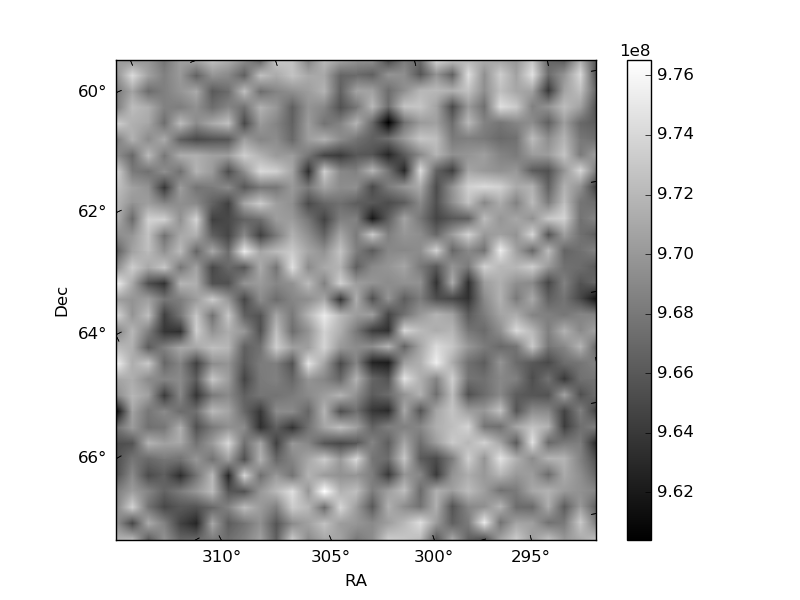
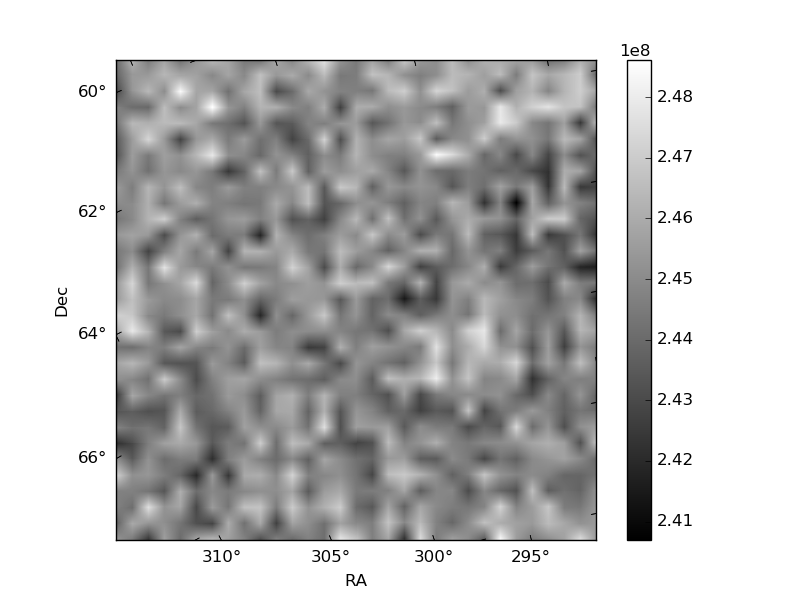
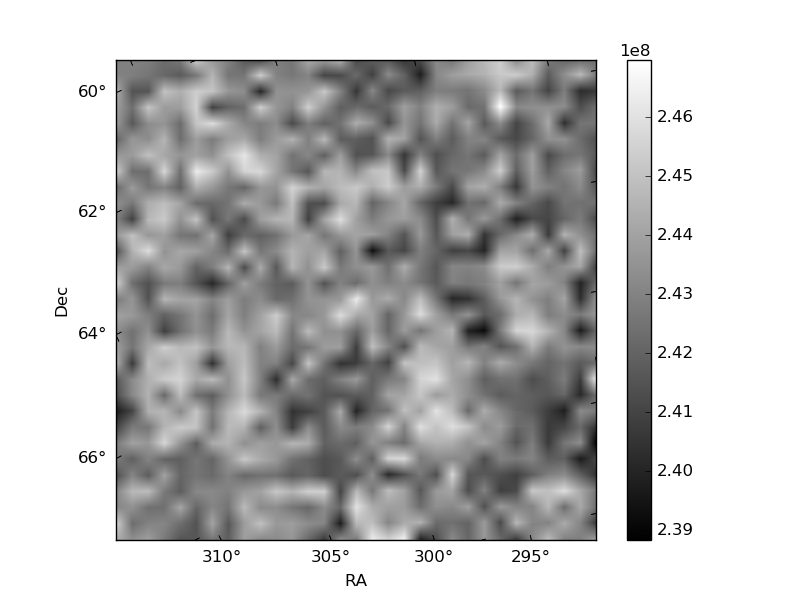
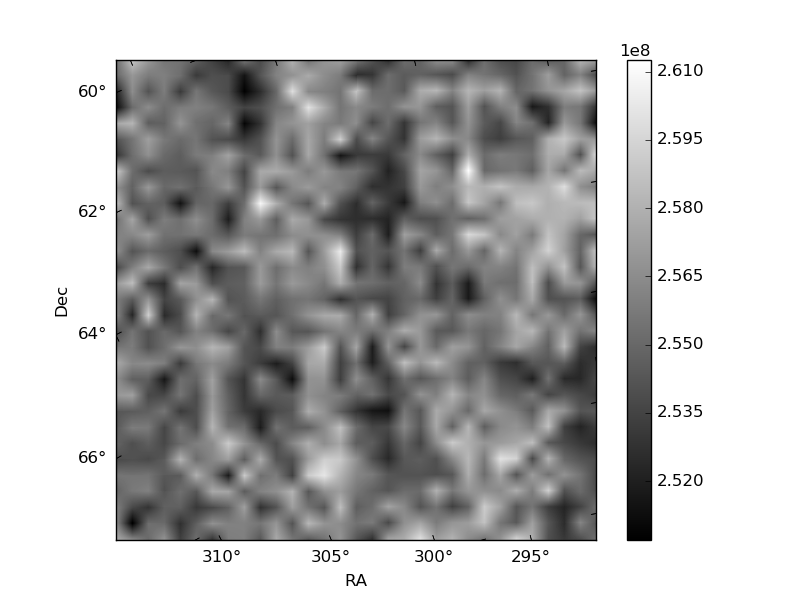
Histogram calculated using DETX and DETY for each event in the final _common_clean file
| Quadrant A | 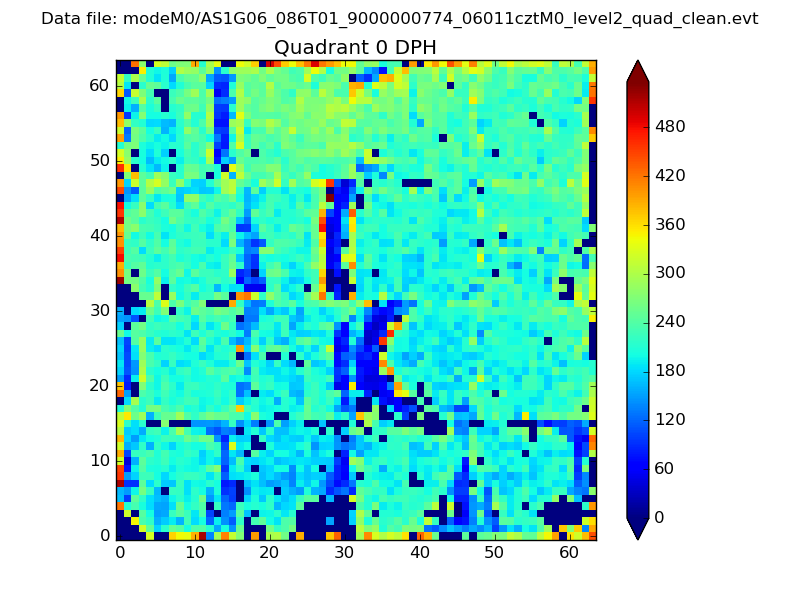 |
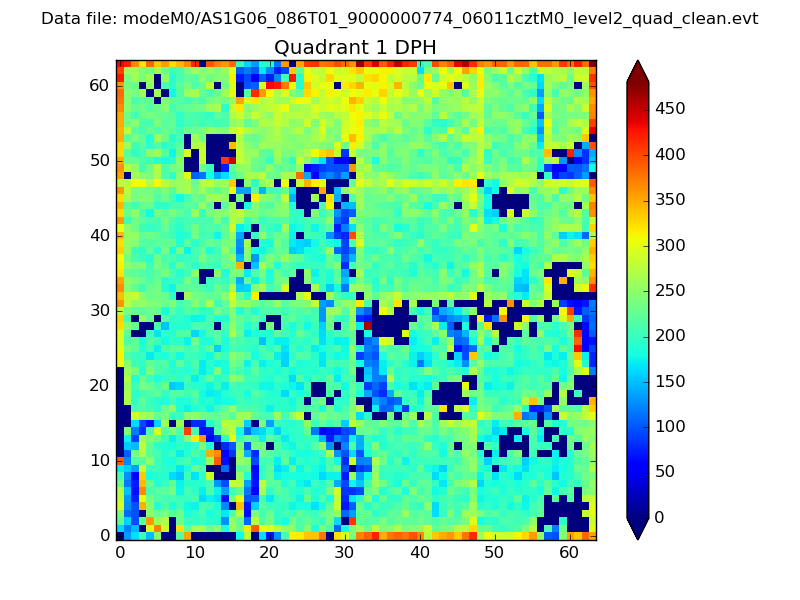 |
Quadrant B |
|---|---|---|---|
| Quadrant D | 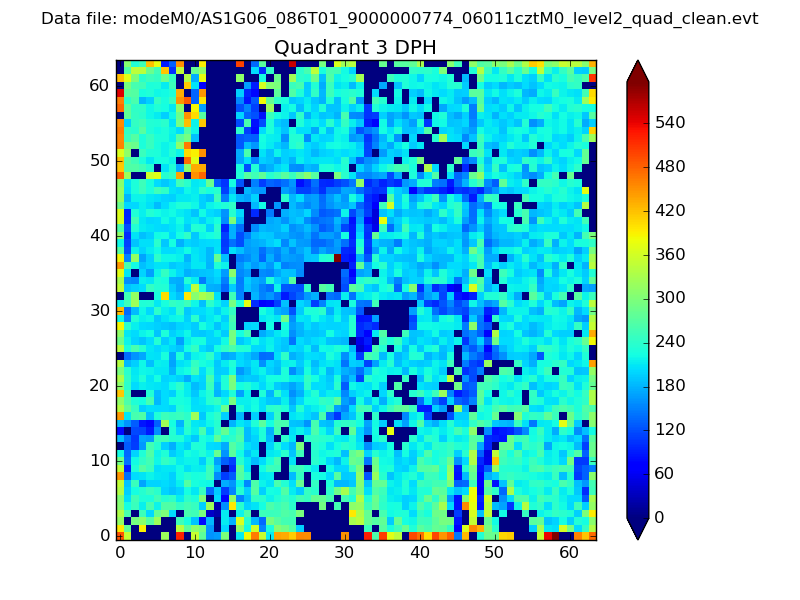 |
 |
Quadrant C |
| Plot type | Count rate plots | Images |
|---|---|---|
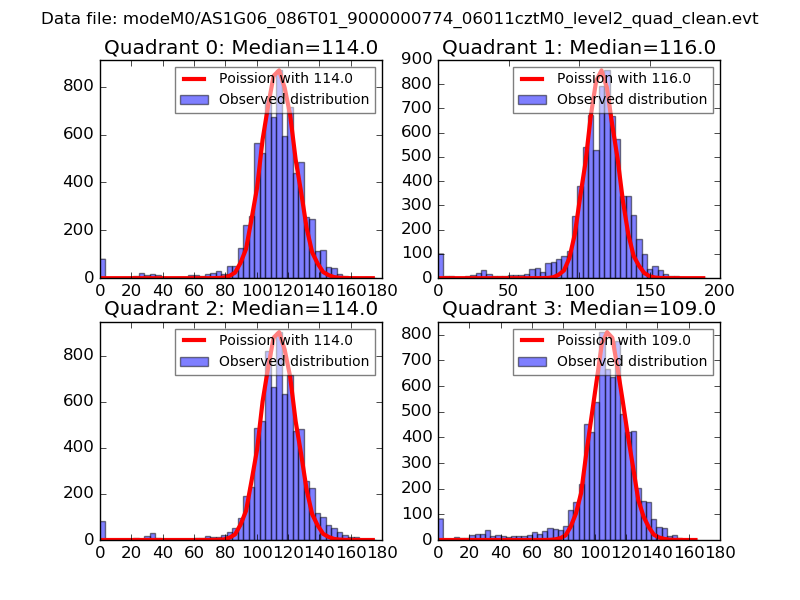
| Comparison with Poisson distribution Blue bars denote a histogram of data divided into 1 sec bins. Red curve is a Poisson curve with rate = median count rate of data. |
 |
 |
| Quadrant-wise count rates Data is divided into 100 sec bins |
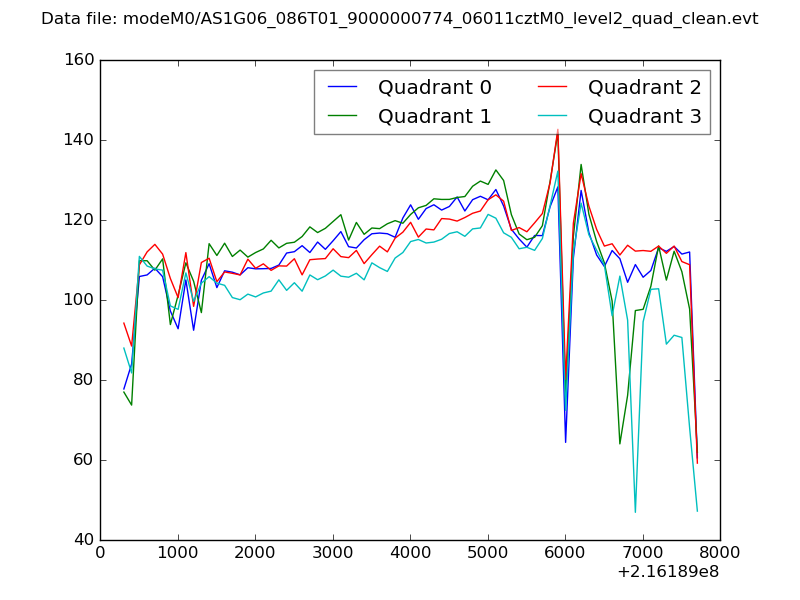 |
|
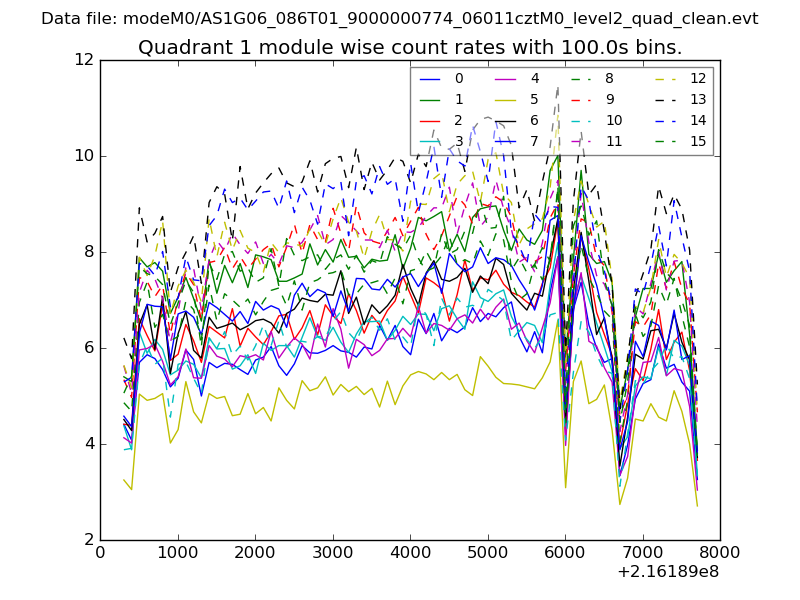
| Module-wise count rates for Quadrant A Data is divided into 100 sec bins |
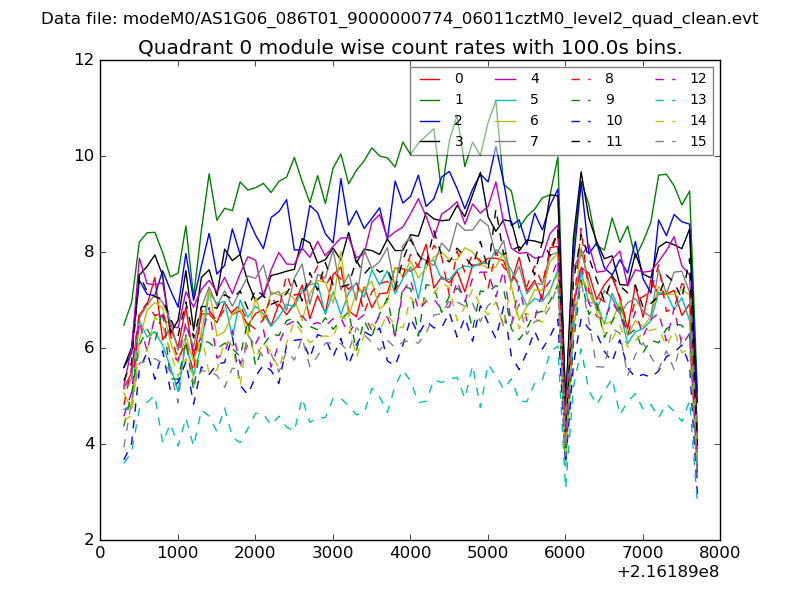 |
 |
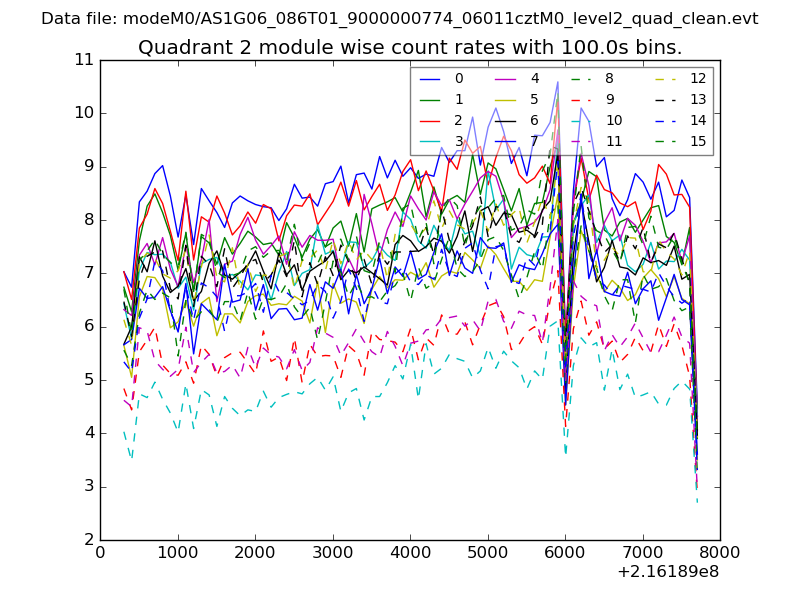
| Module-wise count rates for Quadrant B Data is divided into 100 sec bins |
 |
 |
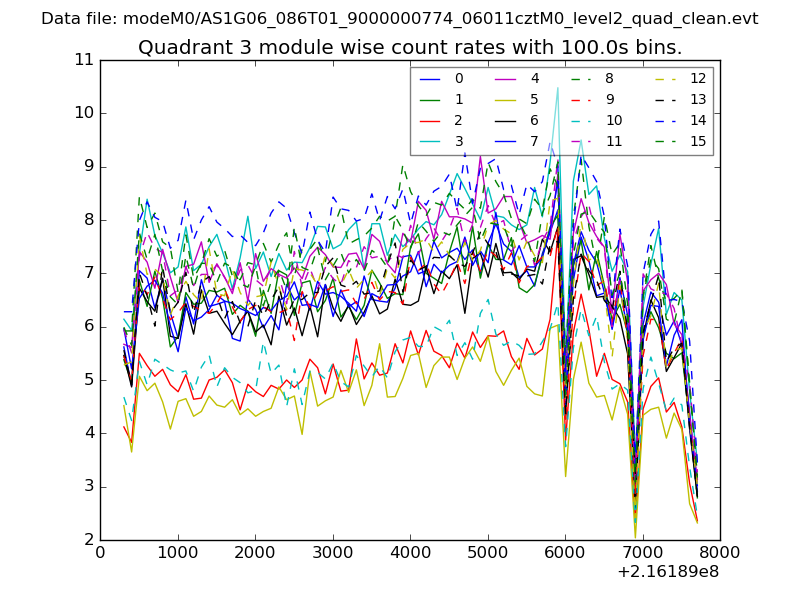
| Module-wise count rates for Quadrant C Data is divided into 100 sec bins |
 |
 |
| Module-wise count rates for Quadrant D Data is divided into 100 sec bins |
 |
 |
| Parameter | Plot |
|---|---|
| CZT HV Monitor | 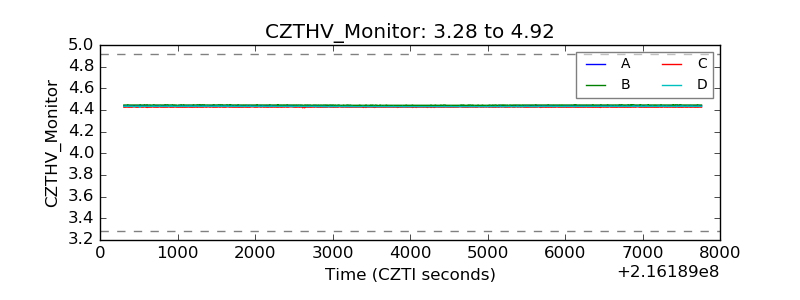 |
| D_VDD | 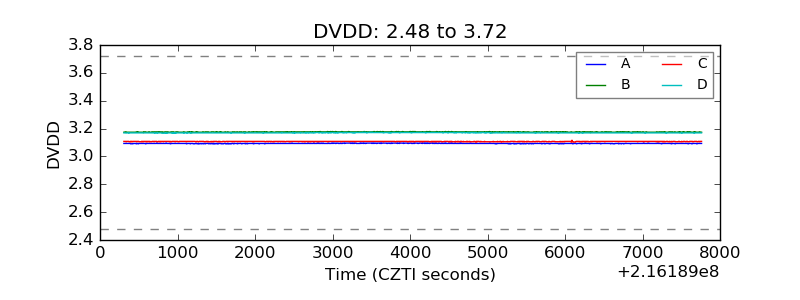 |
| Temperature 1 | 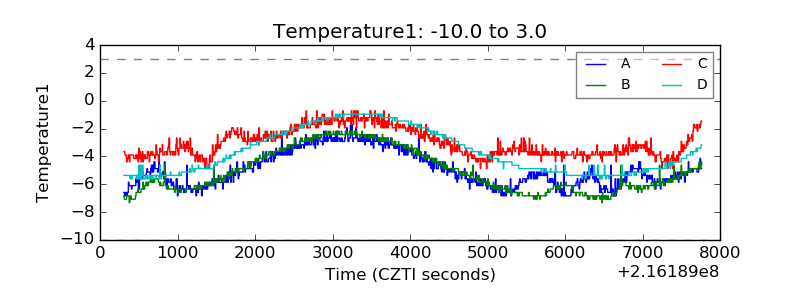 |
| Veto HV Monitor | 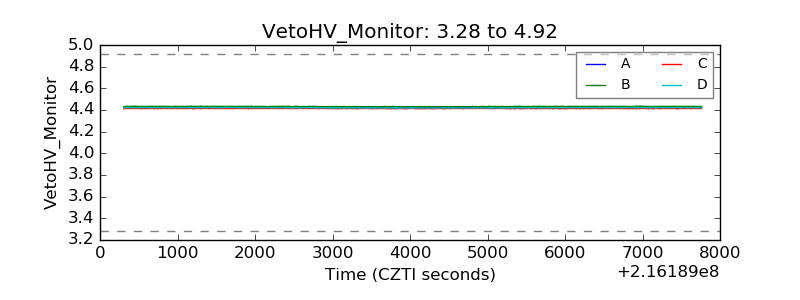 |
| Veto LLD | 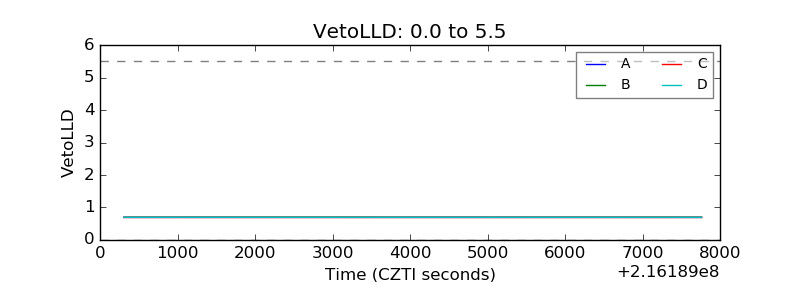 |
| Alpha Counter | 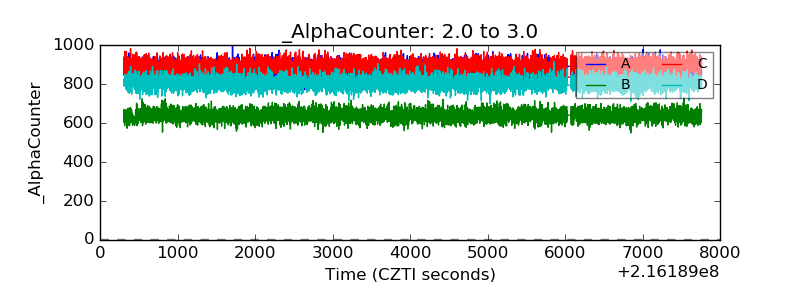 |
| _CPM_Rate | 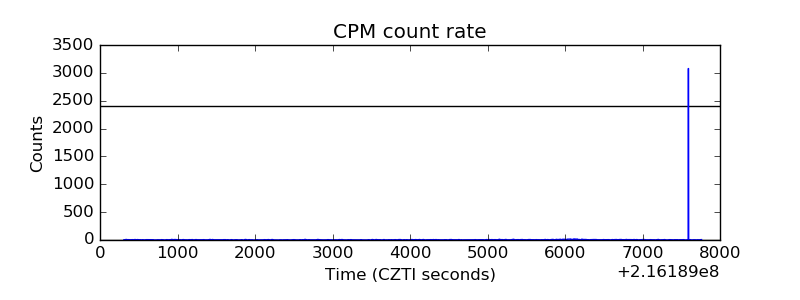 |
| CZT Counter |  |
| +2.5 Volts monitor |  |
| +5 Volts monitor |  |
| _ROLL_ROT | 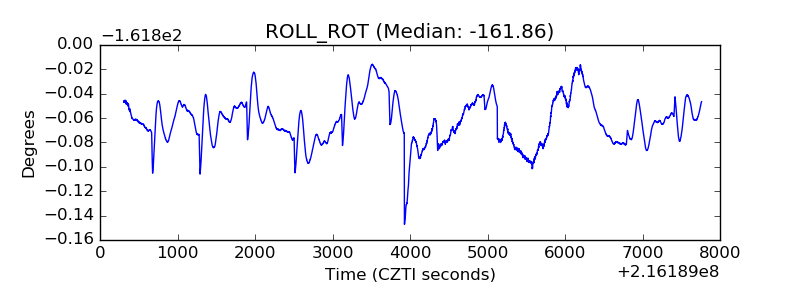 |
| _Roll_DEC | 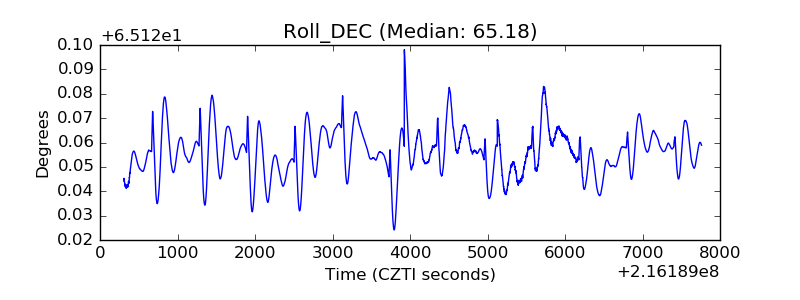 |
| _Roll_RA | 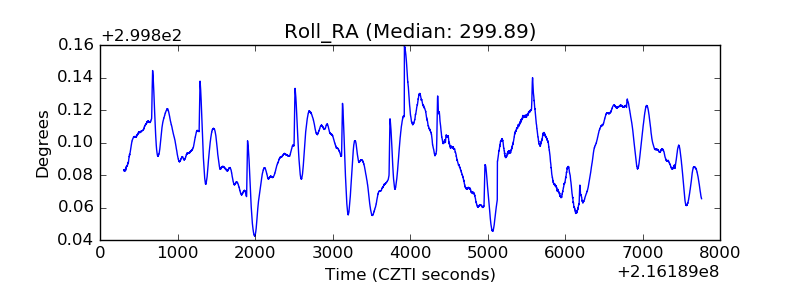 |
| Veto Counter | 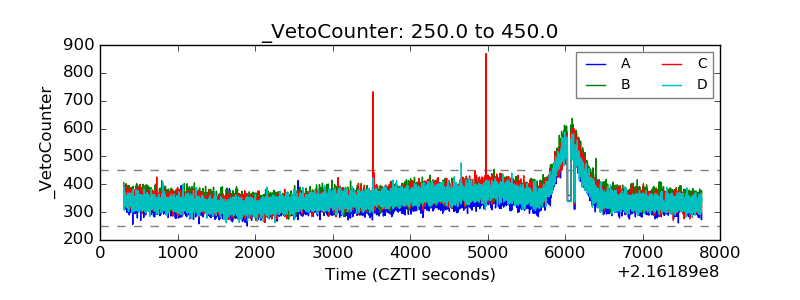 |