| Param | Original file | Final file |
|---|---|---|
| Filename | modeM0/AS1G06_086T01_9000000774_06012cztM0_level2.evt | modeM0/AS1G06_086T01_9000000774_06012cztM0_level2_quad_clean.evt |
| Size (bytes) | 377,758,080 | 85,461,120 |
| Size | 360.3 MB | 81.5 MB |
| Events in quadrant A | 3,175,989 | 549,707 |
| Events in quadrant B | 3,142,444 | 565,203 |
| Events in quadrant C | 2,174,123 | 583,880 |
| Events in quadrant D | 2,608,470 | 539,738 |
| Mode SS | |||
|---|---|---|---|
| Quadrant | BADHDUFLAG | Total packets | Discarded packets |
| A | 0 | 139 | 29 |
| B | 0 | 138 | 32 |
| C | 0 | 139 | 33 |
| D | 0 | 139 | 41 |
| Mode M9 | |||
|---|---|---|---|
| Quadrant | BADHDUFLAG | Total packets | Discarded packets |
| A | 0 | 2 | 0 |
| B | 0 | 2 | 0 |
| C | 0 | 2 | 0 |
| D | 0 | 2 | 0 |
| Mode M0 | |||
|---|---|---|---|
| Quadrant | BADHDUFLAG | Total packets | Discarded packets |
| A | 0 | 18383 | 5598 |
| B | 0 | 17835 | 5282 |
| C | 0 | 13875 | 3565 |
| D | 0 | 15983 | 4419 |
| Quadrant | Total seconds | Saturated seconds | Saturation percentage |
|---|---|---|---|
| A | 4816 | 78 | 1.619601% |
| B | 4862 | 191 | 3.928425% |
| C | 5114 | 14 | 0.273758% |
| D | 5016 | 158 | 3.149920% |
Noise dominated data is calculated using 1-second bins in cleaned event files. If a bin has >2000 counts, and if more than 50% of those come from <1% of pixels, then it is considered to be noise-dominated and hence unusable.
| Quadrant | # 1 sec bins | Bins with >0 counts | Bins with >2000 counts | High rate bins dominated by noise | Noise dominated (total time) | Noise dominated (detector-on time) | Marked lightcurve |
|---|---|---|---|---|---|---|---|
| A | 7075 | 5503 | 8 | 8 | 0.11% | 0.15% | 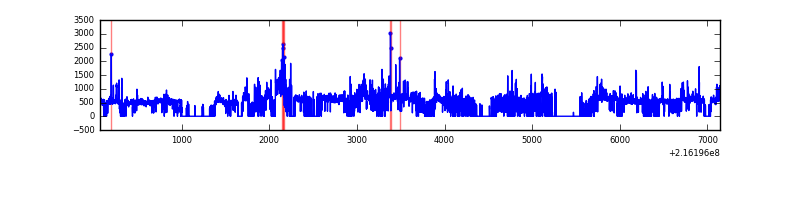 |
| B | 7075 | 5542 | 118 | 118 | 1.67% | 2.13% |  |
| C | 7075 | 5775 | 0 | 0 | 0.00% | 0.00% |  |
| D | 7075 | 5702 | 116 | 116 | 1.64% | 2.03% | 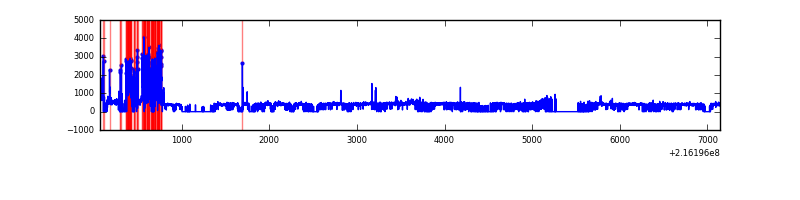 |
Top three noisy pixels from each quadrant. If the there are fewer than three noisy pixels in the level2.evt file, extra rows are filled as -1
| Pixel properties | Quadrant properties | ||||||
|---|---|---|---|---|---|---|---|
| Quadrant | DetID | PixID | Counts | Sigma | Mean | Median | Sigma |
| A | 13 | 34 | 1035342 | 9375.01 | 534 | 521 | 110.4 |
| A | 7 | 16 | 74862 | 673.5 | 534 | 521 | 110.4 |
| A | 8 | 15 | 6530 | 54.44 | 534 | 521 | 110.4 |
| B | 3 | 64 | 786155 | 7356.58 | 543 | 530 | 106.8 |
| B | 15 | 204 | 77299 | 718.86 | 543 | 530 | 106.8 |
| B | 7 | 221 | 67610 | 628.14 | 543 | 530 | 106.8 |
| C | 1 | 16 | 12762 | 95.33 | 551 | 554 | 128.1 |
| C | 12 | 4 | 4772 | 32.94 | 551 | 554 | 128.1 |
| C | 13 | 61 | 4407 | 30.09 | 551 | 554 | 128.1 |
| D | 12 | 110 | 478449 | 3602.49 | 534 | 517 | 132.7 |
| D | 12 | 221 | 62597 | 467.94 | 534 | 517 | 132.7 |
| D | 8 | 195 | 17381 | 127.12 | 534 | 517 | 132.7 |
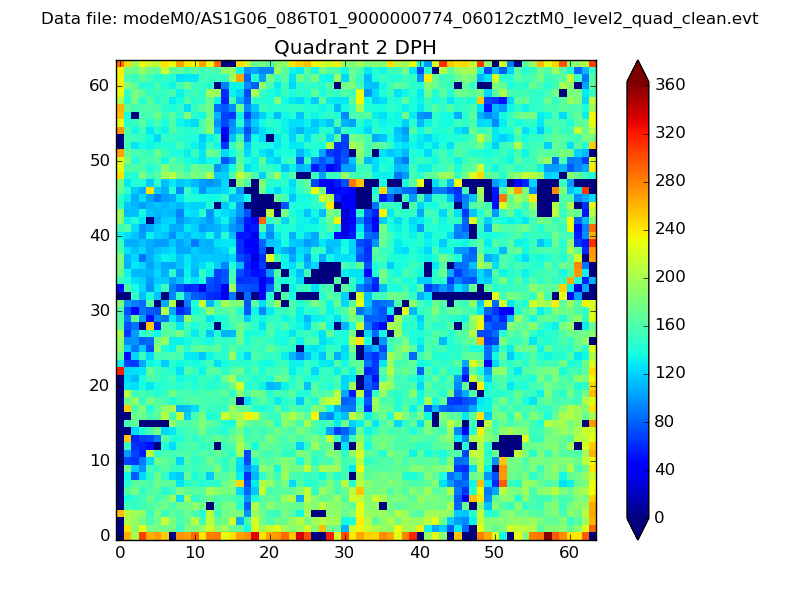
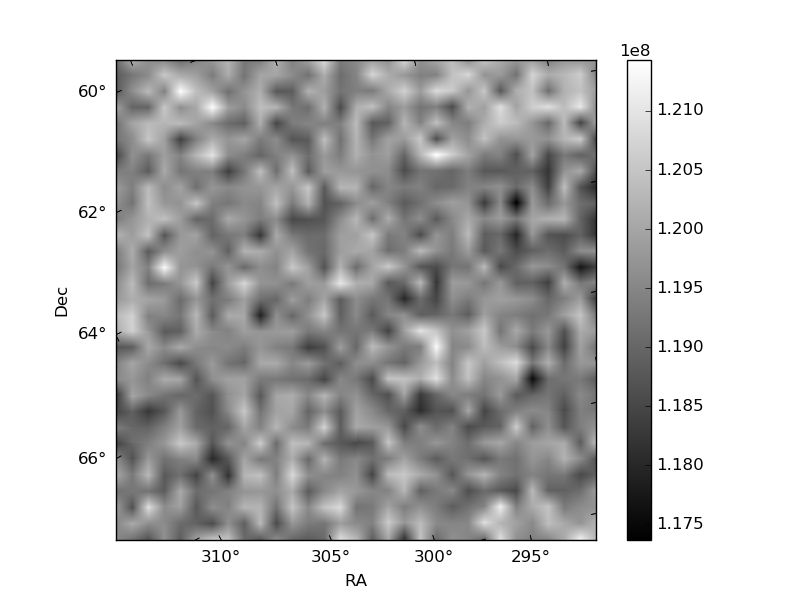
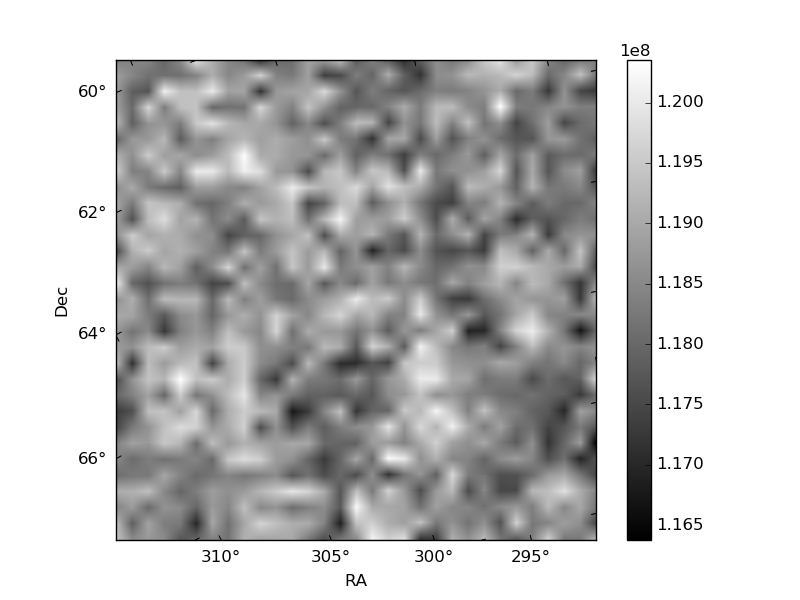
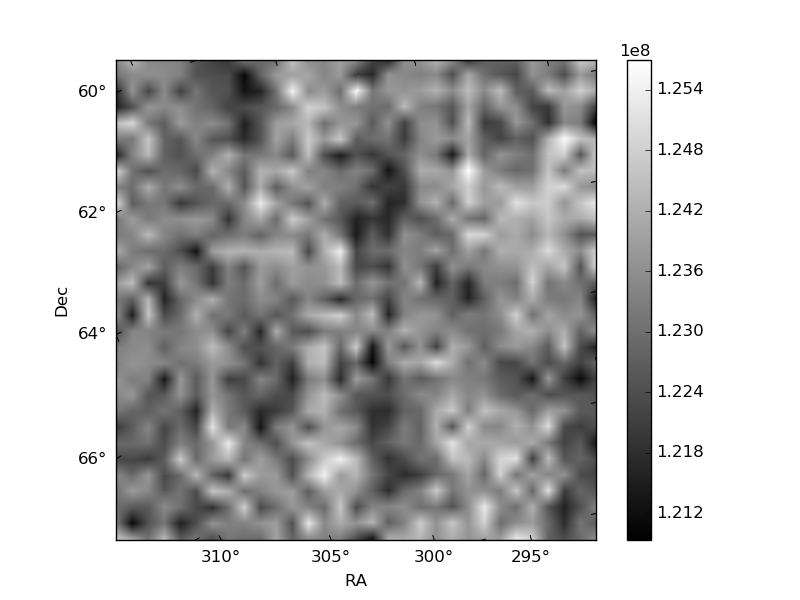
Histogram calculated using DETX and DETY for each event in the final _common_clean file
| Quadrant A | 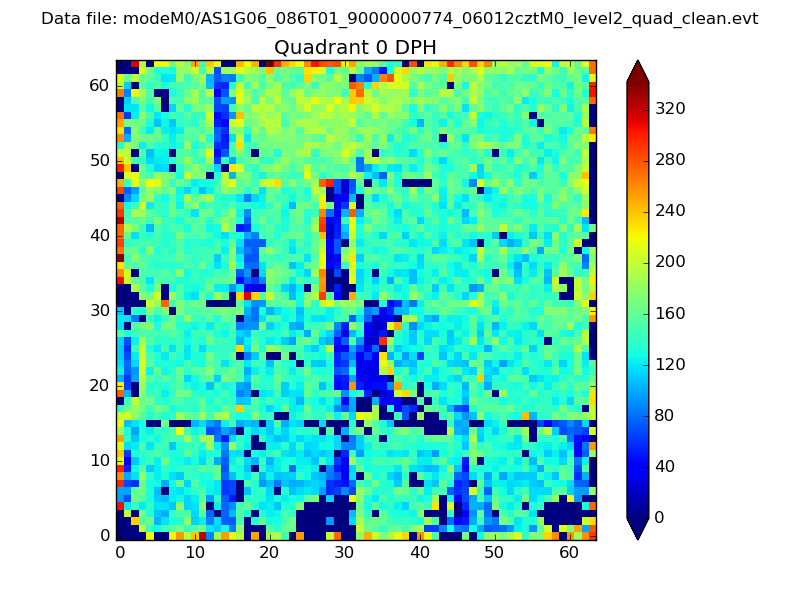 |
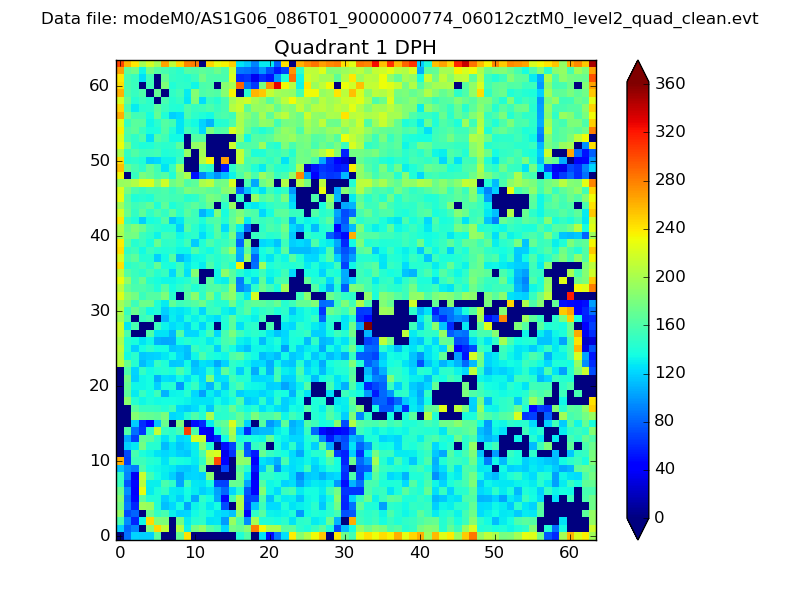 |
Quadrant B |
|---|---|---|---|
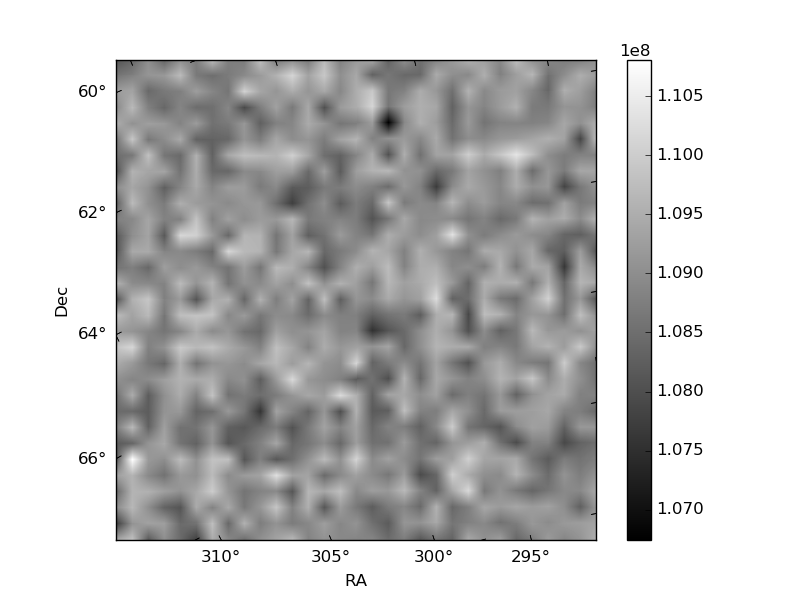
| Quadrant D | 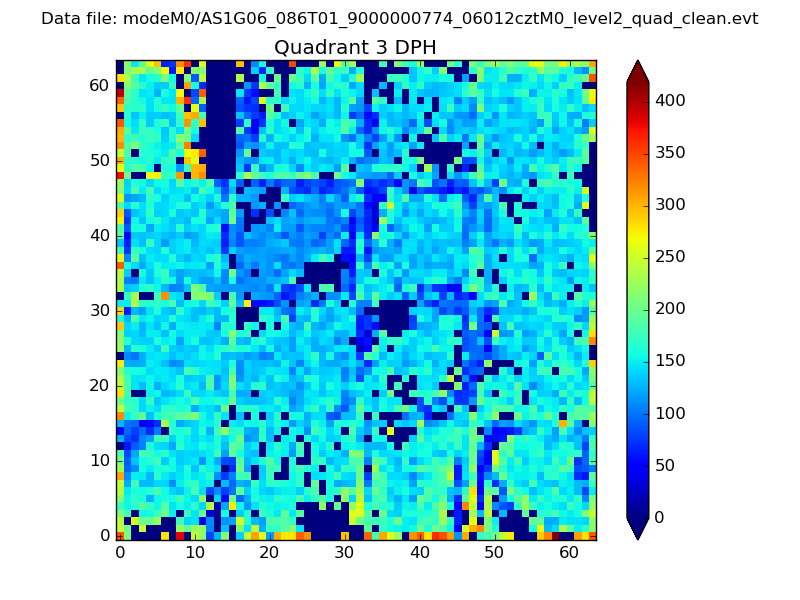 |
 |
Quadrant C |
| Plot type | Count rate plots | Images |
|---|---|---|
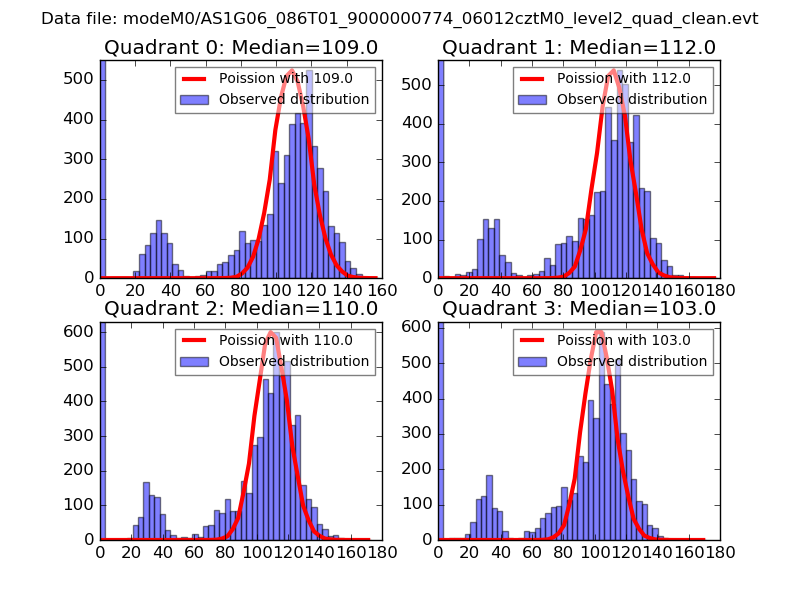
| Comparison with Poisson distribution Blue bars denote a histogram of data divided into 1 sec bins. Red curve is a Poisson curve with rate = median count rate of data. |
 |
 |
| Quadrant-wise count rates Data is divided into 100 sec bins |
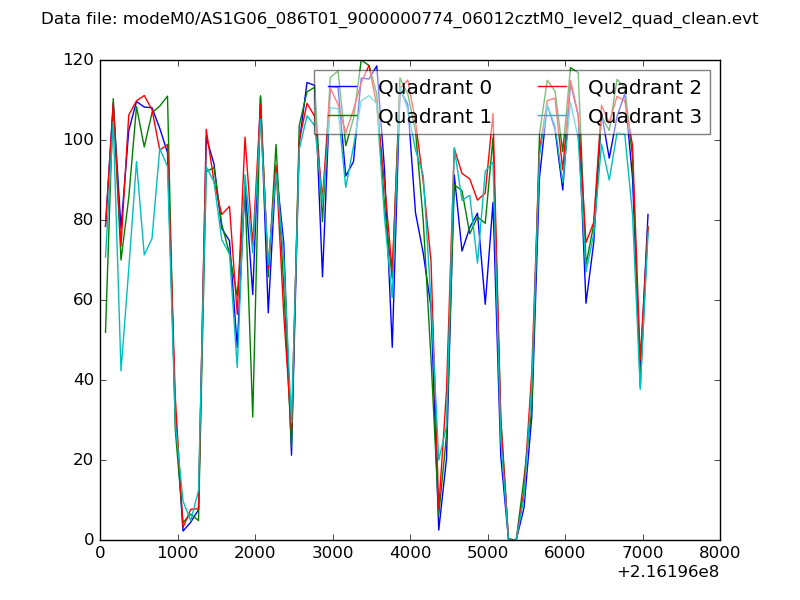 |
|
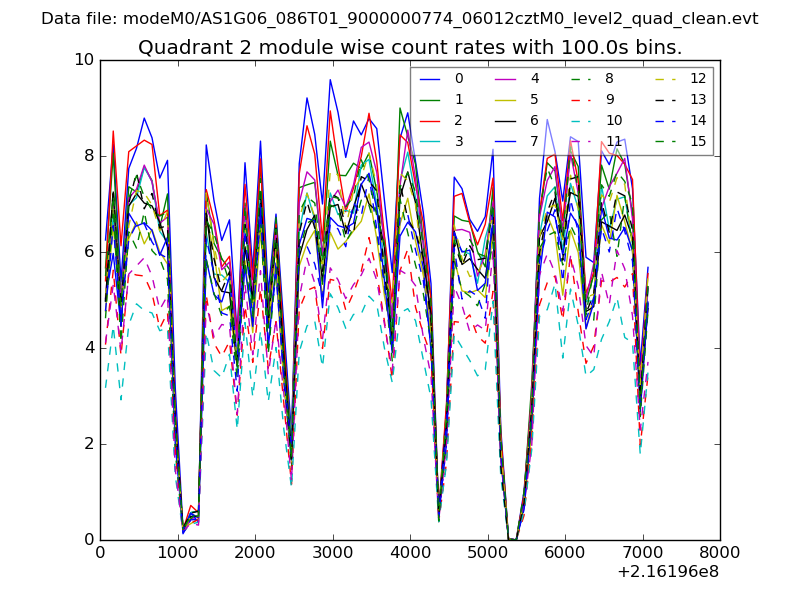
| Module-wise count rates for Quadrant A Data is divided into 100 sec bins |
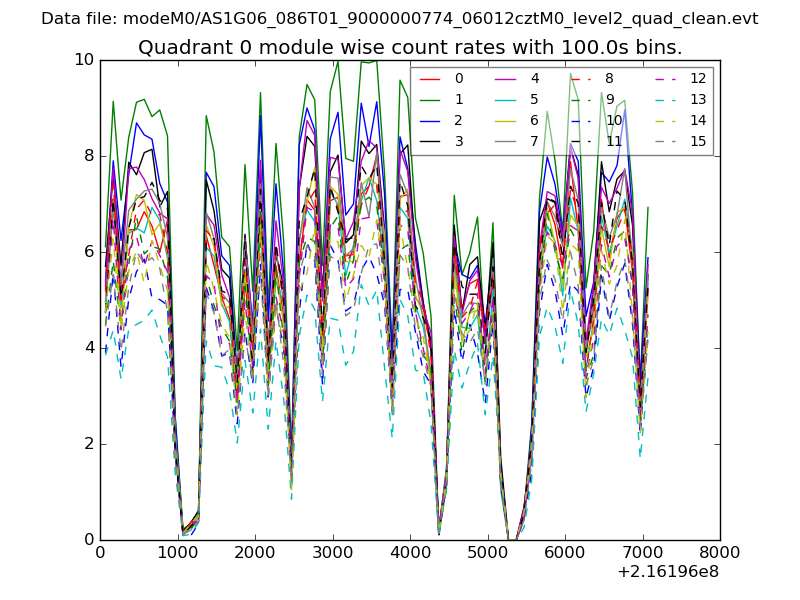 |
 |
| Module-wise count rates for Quadrant B Data is divided into 100 sec bins |
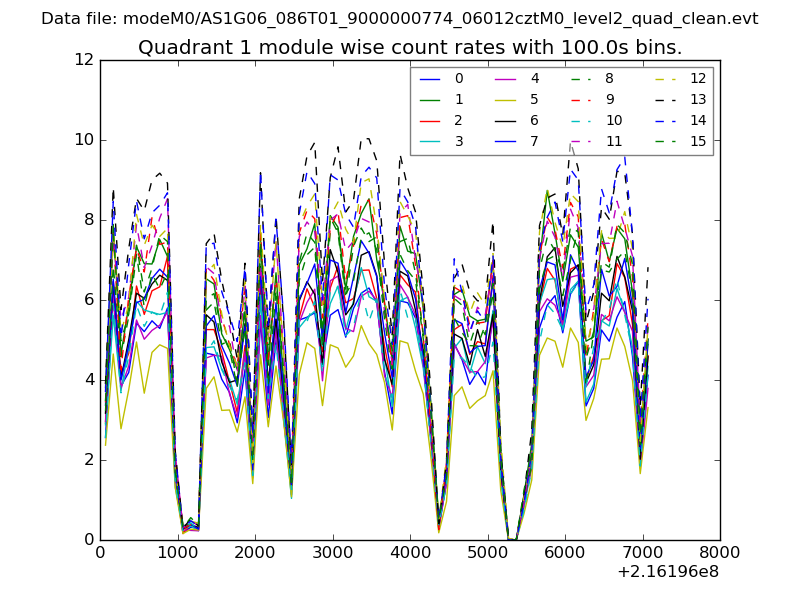 |
 |
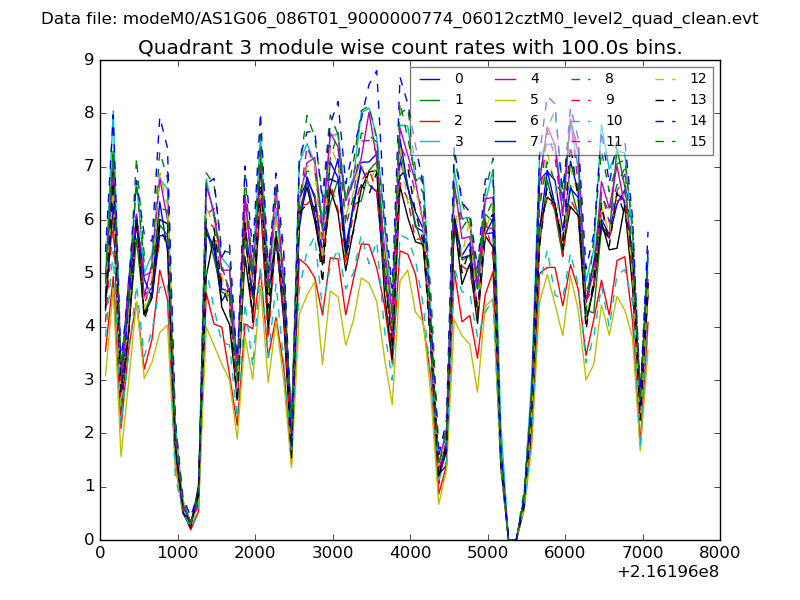
| Module-wise count rates for Quadrant C Data is divided into 100 sec bins |
 |
 |
| Module-wise count rates for Quadrant D Data is divided into 100 sec bins |
 |
 |
| Parameter | Plot |
|---|---|
| CZT HV Monitor | 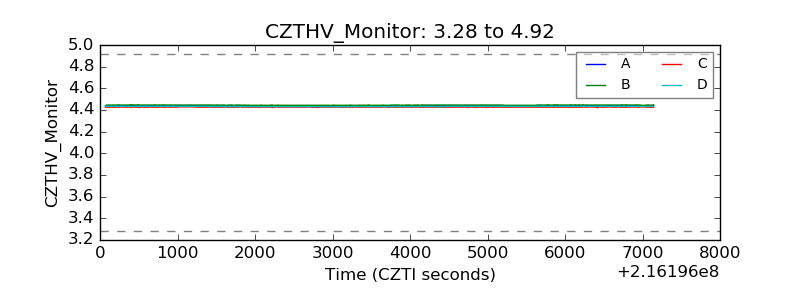 |
| D_VDD | 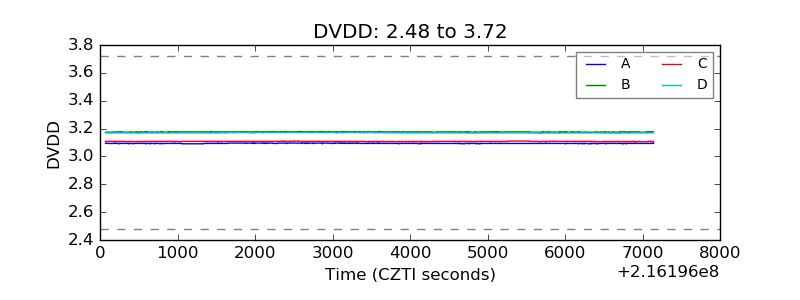 |
| Temperature 1 | 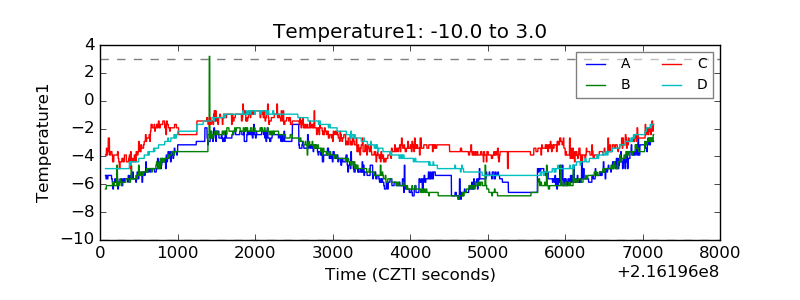 |
| Veto HV Monitor | 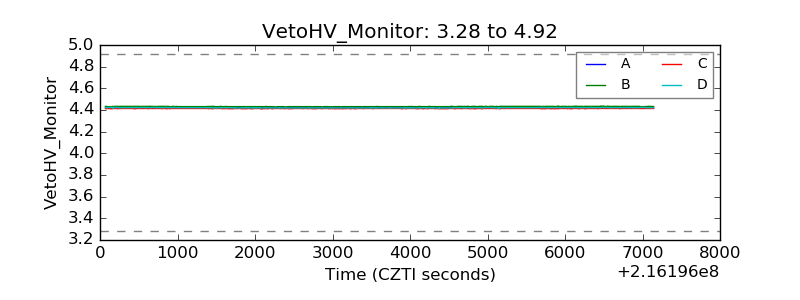 |
| Veto LLD | 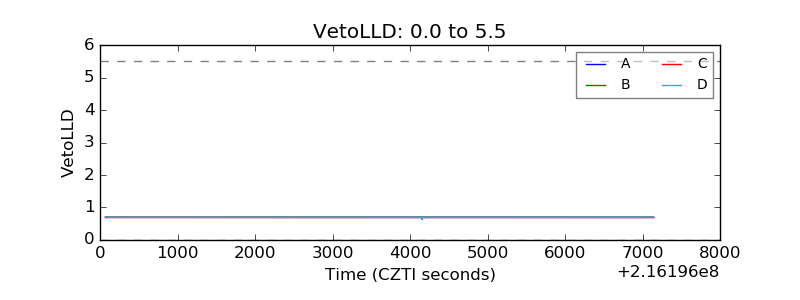 |
| Alpha Counter | 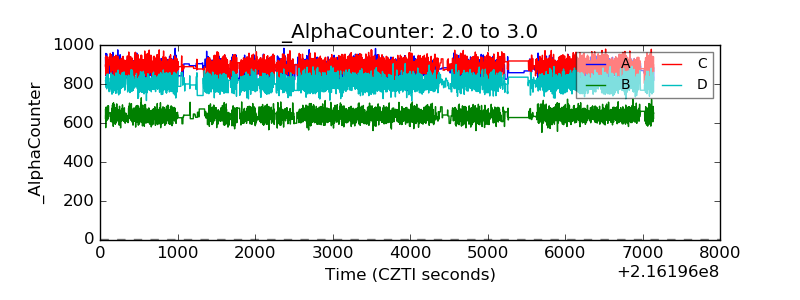 |
| _CPM_Rate | 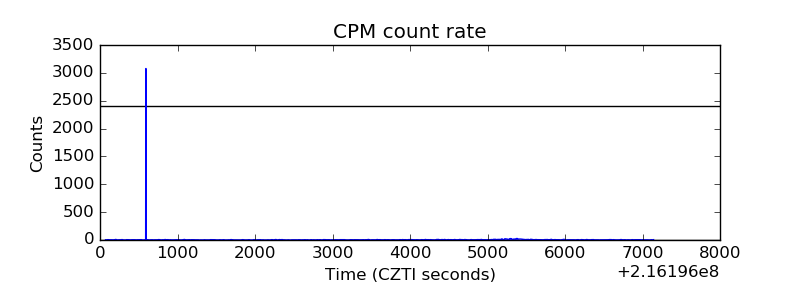 |
| CZT Counter | 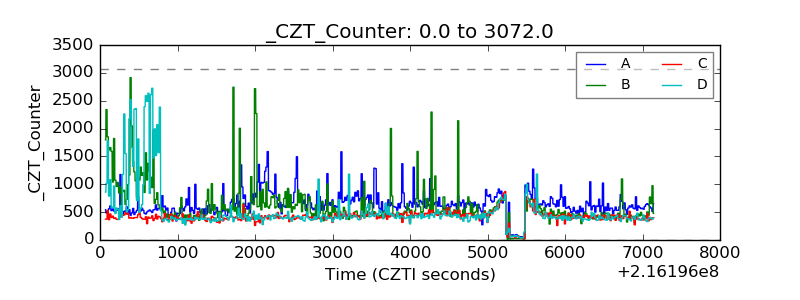 |
| +2.5 Volts monitor |  |
| +5 Volts monitor |  |
| _ROLL_ROT | 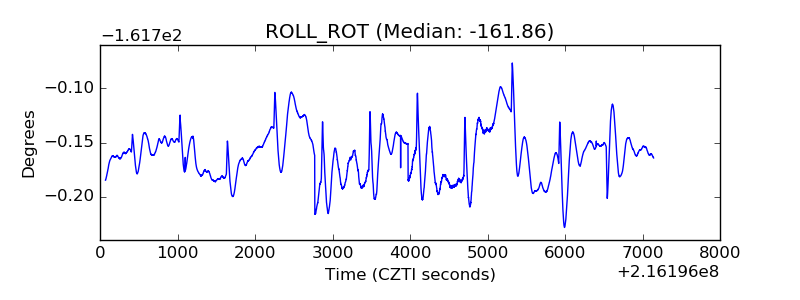 |
| _Roll_DEC | 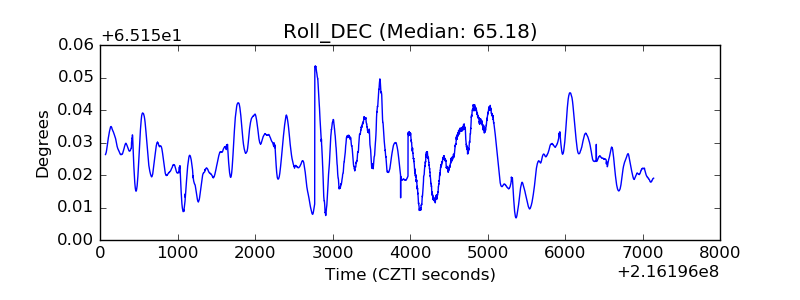 |
| _Roll_RA | 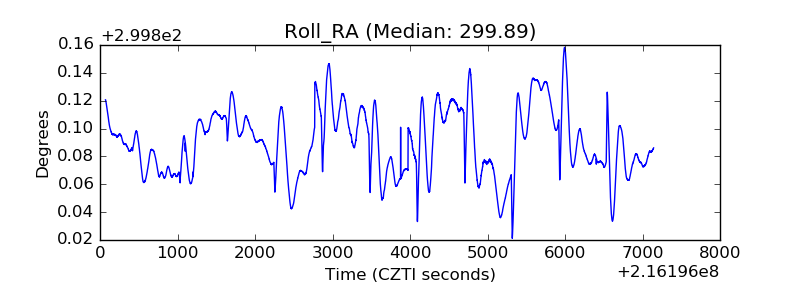 |
| Veto Counter | 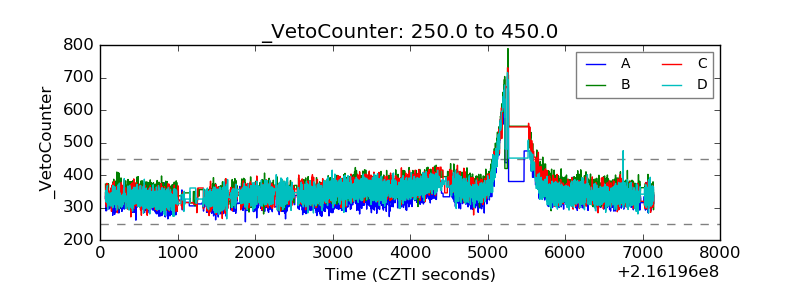 |