| Param | Original file | Final file |
|---|---|---|
| Filename | modeM0/AS1G06_086T01_9000000774_06019cztM0_level2.evt | modeM0/AS1G06_086T01_9000000774_06019cztM0_level2_quad_clean.evt |
| Size (bytes) | 704,445,120 | 127,975,680 |
| Size | 671.8 MB | 122.0 MB |
| Events in quadrant A | 6,917,762 | 844,409 |
| Events in quadrant B | 7,390,404 | 821,625 |
| Events in quadrant C | 3,307,683 | 859,234 |
| Events in quadrant D | 3,205,446 | 822,960 |
| Mode SS | |||
|---|---|---|---|
| Quadrant | BADHDUFLAG | Total packets | Discarded packets |
| A | 0 | 152 | 0 |
| B | 0 | 152 | 0 |
| C | 0 | 152 | 0 |
| D | 0 | 152 | 0 |
| Mode M9 | |||
|---|---|---|---|
| Quadrant | BADHDUFLAG | Total packets | Discarded packets |
| A | 0 | 5 | 0 |
| B | 0 | 5 | 0 |
| C | 0 | 5 | 0 |
| D | 0 | 5 | 0 |
| Mode M0 | |||
|---|---|---|---|
| Quadrant | BADHDUFLAG | Total packets | Discarded packets |
| A | 0 | 26036 | 1 |
| B | 0 | 26967 | 1 |
| C | 0 | 15410 | 1 |
| D | 0 | 15494 | 1 |
| Quadrant | Total seconds | Saturated seconds | Saturation percentage |
|---|---|---|---|
| A | 7579 | 790 | 10.423539% |
| B | 7579 | 1388 | 18.313762% |
| C | 7579 | 37 | 0.488191% |
| D | 7579 | 67 | 0.884022% |
Noise dominated data is calculated using 1-second bins in cleaned event files. If a bin has >2000 counts, and if more than 50% of those come from <1% of pixels, then it is considered to be noise-dominated and hence unusable.
| Quadrant | # 1 sec bins | Bins with >0 counts | Bins with >2000 counts | High rate bins dominated by noise | Noise dominated (total time) | Noise dominated (detector-on time) | Marked lightcurve |
|---|---|---|---|---|---|---|---|
| A | 8029 | 7579 | 594 | 594 | 7.40% | 7.84% | 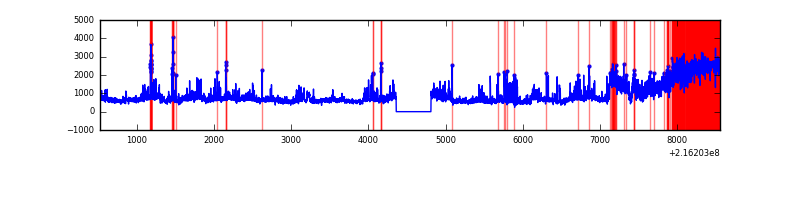 |
| B | 8029 | 7580 | 1102 | 1102 | 13.73% | 14.54% | 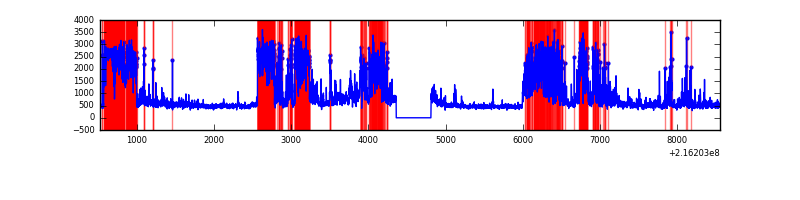 |
| C | 8029 | 7580 | 2 | 2 | 0.02% | 0.03% | 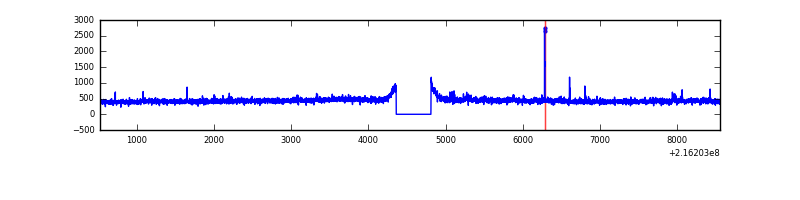 |
| D | 8029 | 7579 | 2 | 2 | 0.02% | 0.03% | 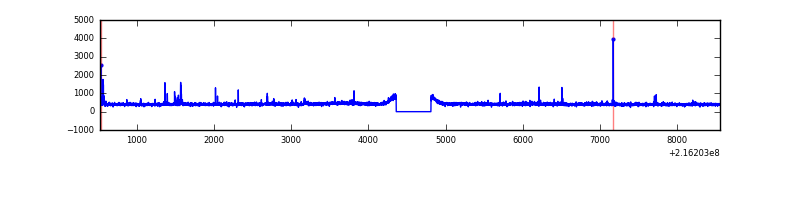 |
Top three noisy pixels from each quadrant. If the there are fewer than three noisy pixels in the level2.evt file, extra rows are filled as -1
| Pixel properties | Quadrant properties | ||||||
|---|---|---|---|---|---|---|---|
| Quadrant | DetID | PixID | Counts | Sigma | Mean | Median | Sigma |
| A | 15 | 234 | 1909551 | 11464.04 | 820 | 802 | 166.5 |
| A | 13 | 34 | 1483727 | 8906.52 | 820 | 802 | 166.5 |
| A | 7 | 16 | 226558 | 1355.9 | 820 | 802 | 166.5 |
| B | 3 | 64 | 3720671 | 24318.33 | 799 | 779 | 153.0 |
| B | 7 | 221 | 162413 | 1056.66 | 799 | 779 | 153.0 |
| B | 0 | 214 | 113116 | 734.39 | 799 | 779 | 153.0 |
| C | 1 | 241 | 71684 | 374.41 | 817 | 819 | 189.3 |
| C | 1 | 16 | 17978 | 90.66 | 817 | 819 | 189.3 |
| C | 8 | 128 | 11062 | 54.12 | 817 | 819 | 189.3 |
| D | 2 | 14 | 40176 | 195.08 | 821 | 794 | 201.9 |
| D | 12 | 221 | 22903 | 109.52 | 821 | 794 | 201.9 |
| D | 7 | 55 | 18299 | 86.71 | 821 | 794 | 201.9 |
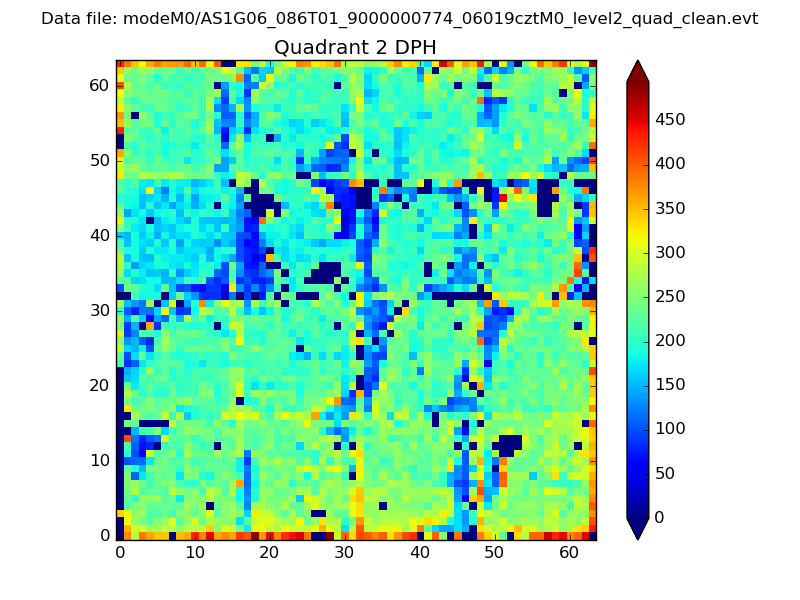
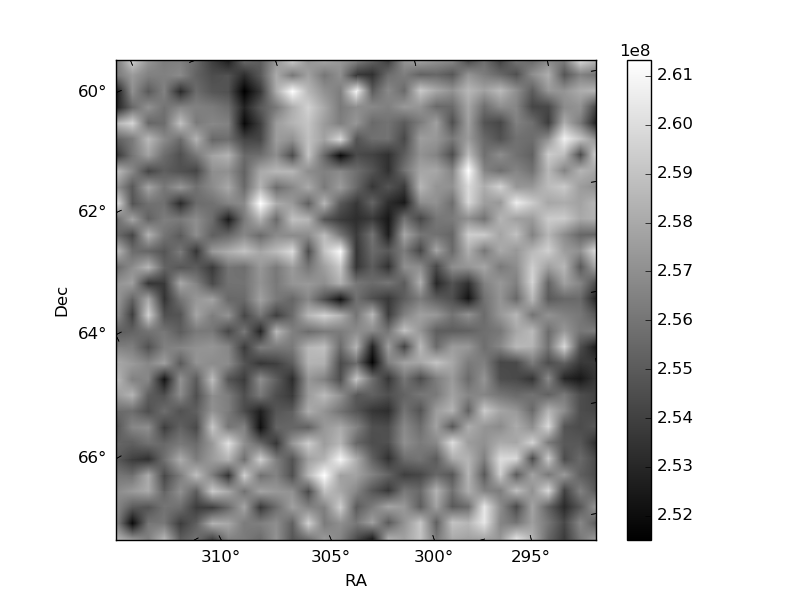
Histogram calculated using DETX and DETY for each event in the final _common_clean file
| Quadrant A | 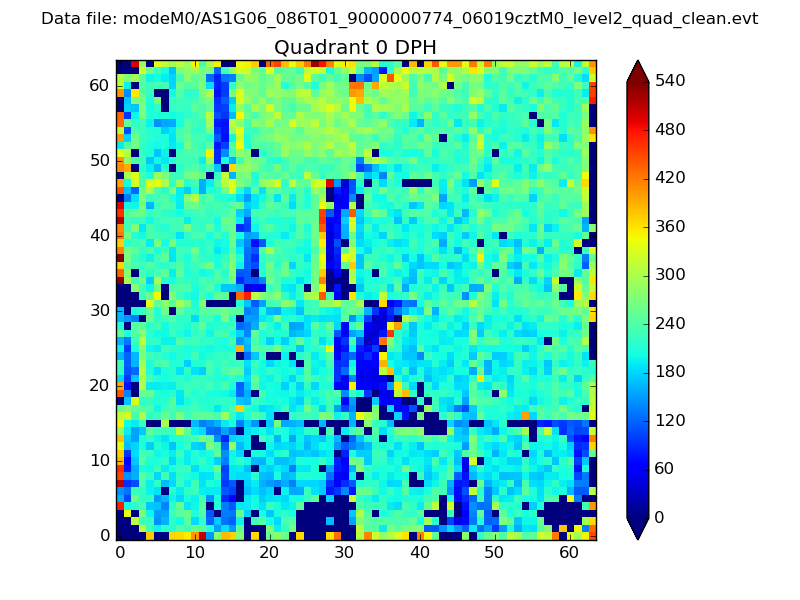 |
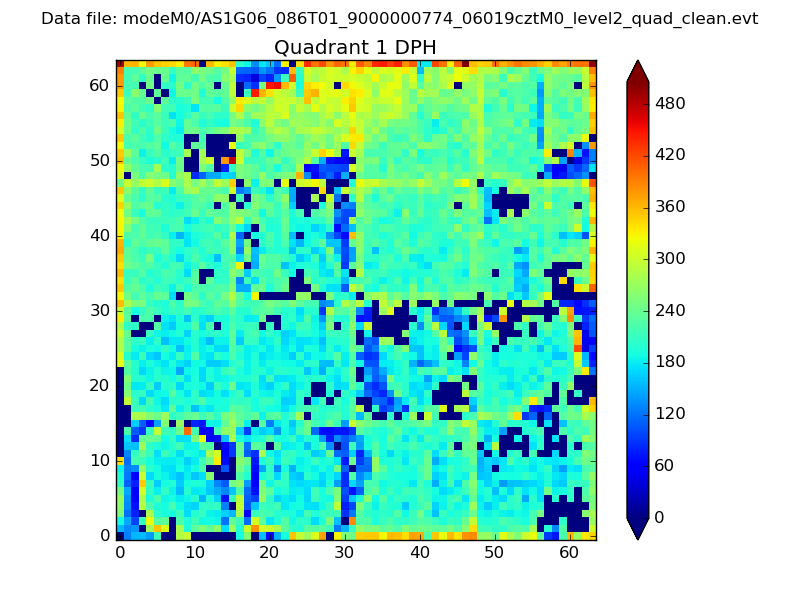 |
Quadrant B |
|---|---|---|---|
| Quadrant D | 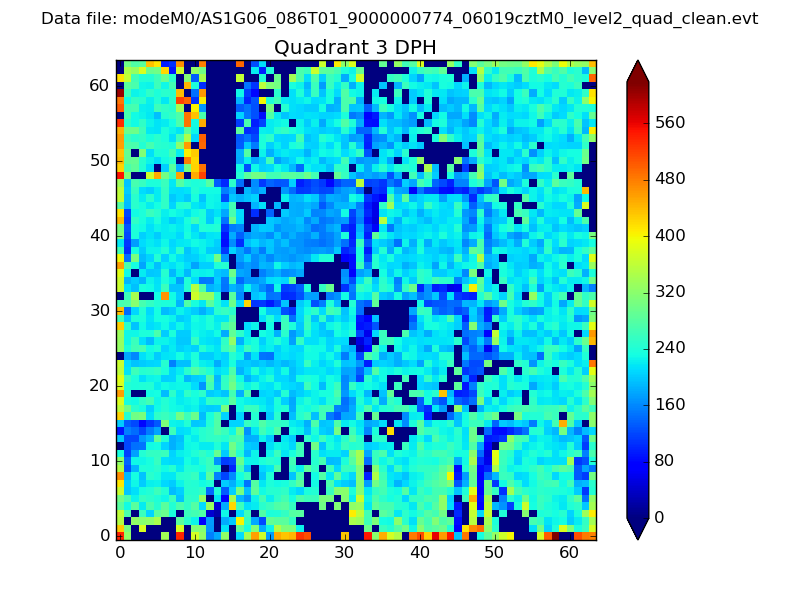 |
 |
Quadrant C |
| Plot type | Count rate plots | Images |
|---|---|---|
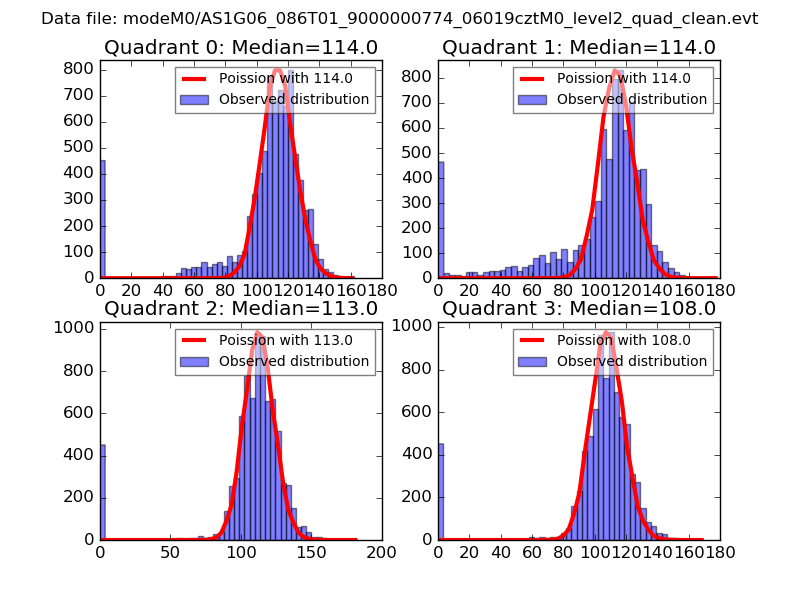
| Comparison with Poisson distribution Blue bars denote a histogram of data divided into 1 sec bins. Red curve is a Poisson curve with rate = median count rate of data. |
 |
 |
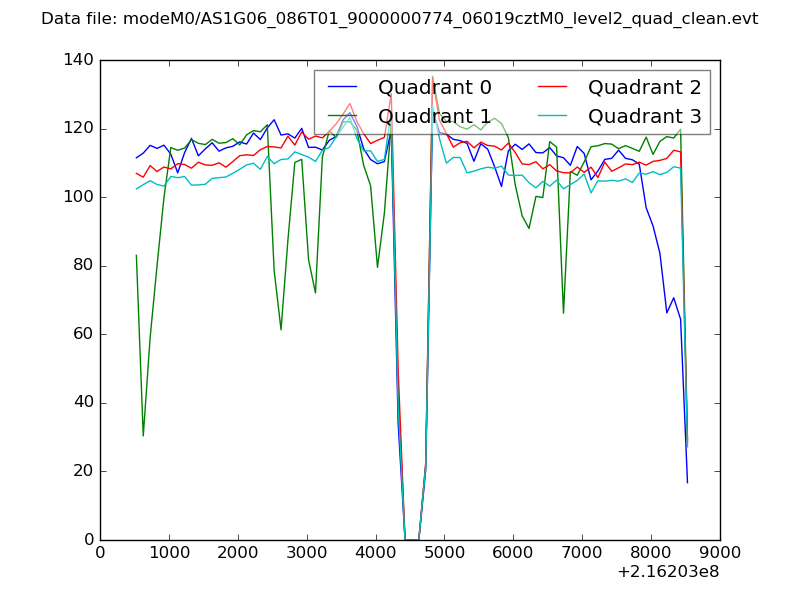
| Quadrant-wise count rates Data is divided into 100 sec bins |
 |
|
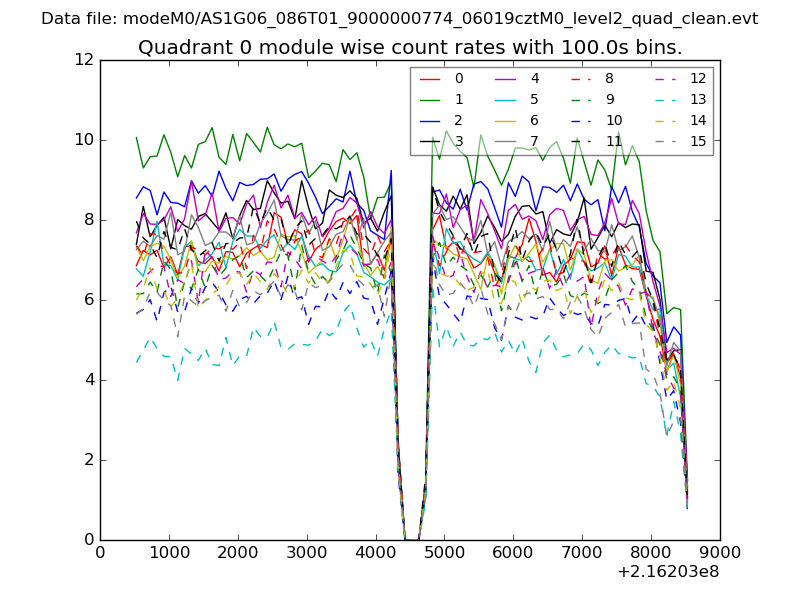
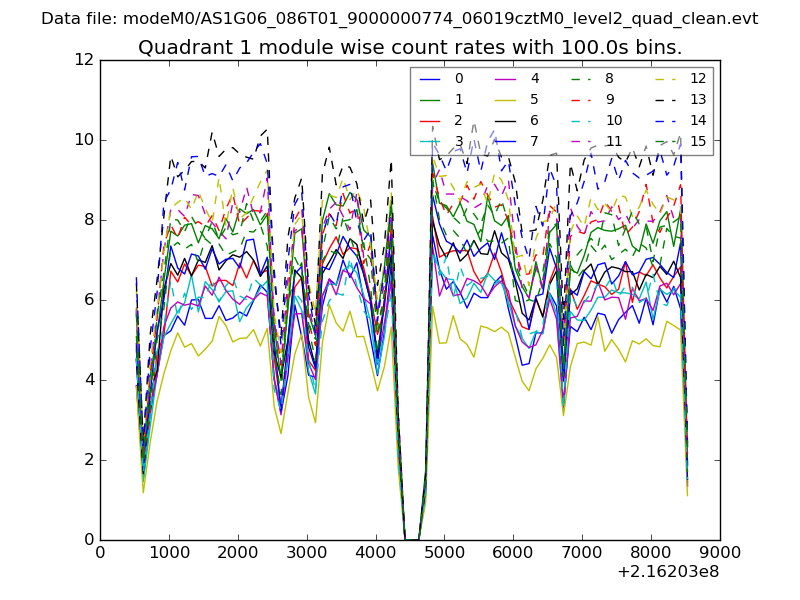
| Module-wise count rates for Quadrant A Data is divided into 100 sec bins |
 |
 |
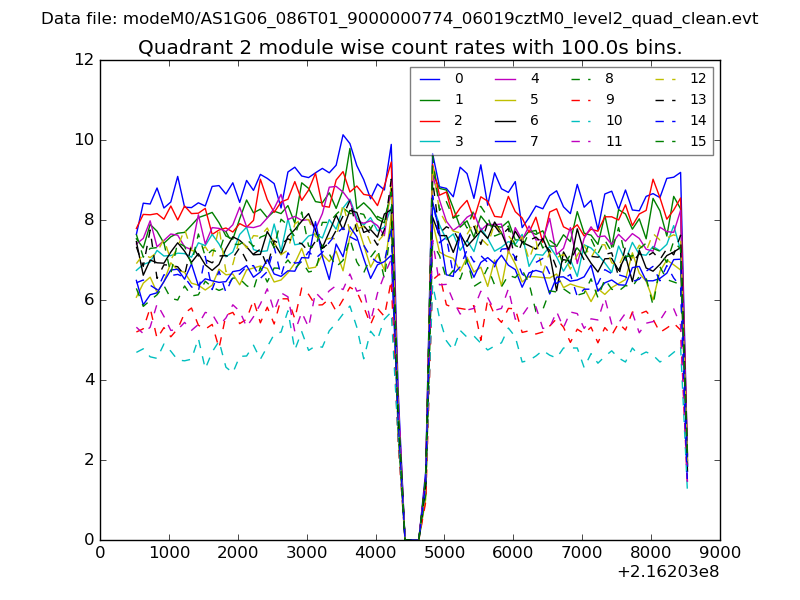
| Module-wise count rates for Quadrant B Data is divided into 100 sec bins |
 |
 |
| Module-wise count rates for Quadrant C Data is divided into 100 sec bins |
 |
 |
| Module-wise count rates for Quadrant D Data is divided into 100 sec bins |
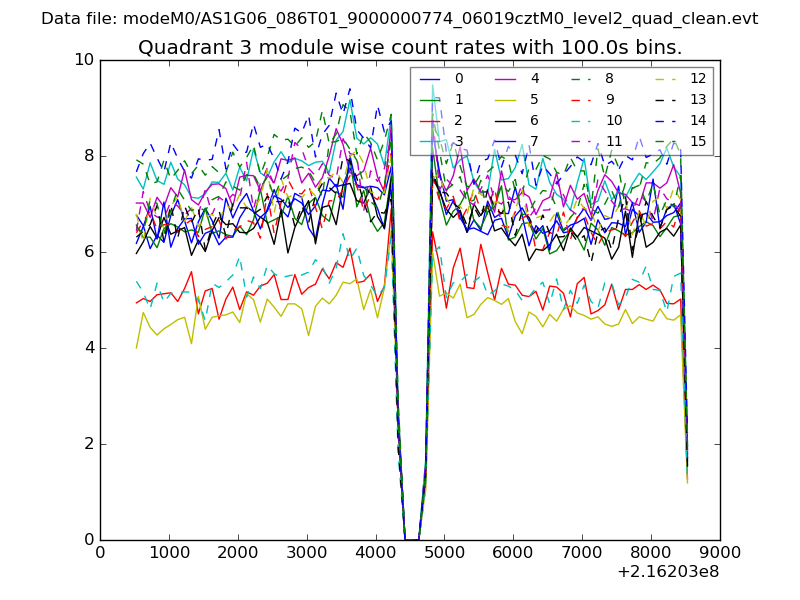 |
 |
| Parameter | Plot |
|---|---|
| CZT HV Monitor | 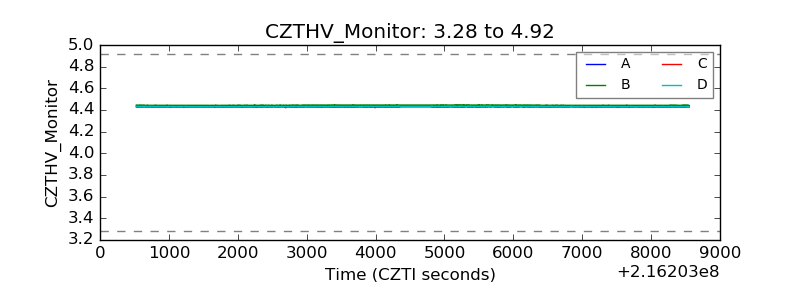 |
| D_VDD | 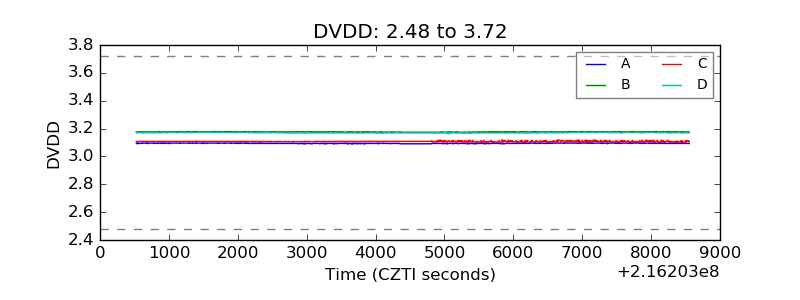 |
| Temperature 1 | 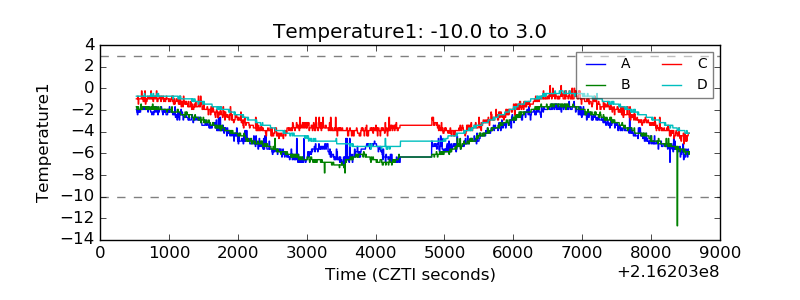 |
| Veto HV Monitor | 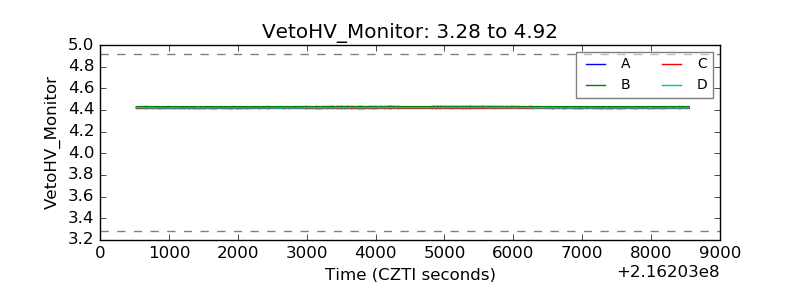 |
| Veto LLD | 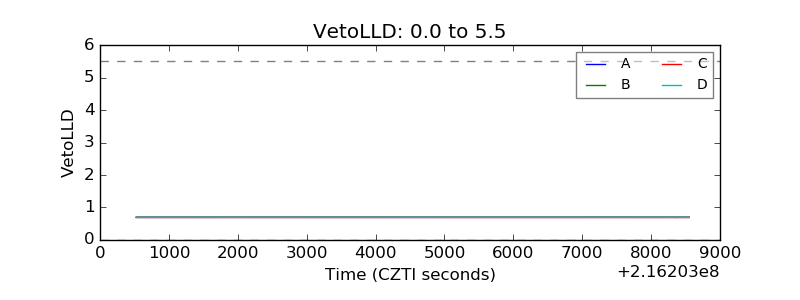 |
| Alpha Counter | 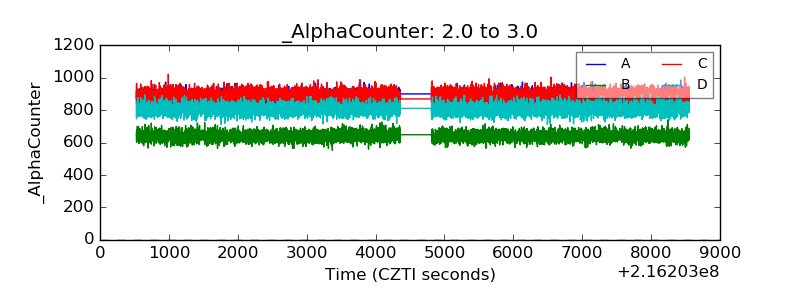 |
| _CPM_Rate | 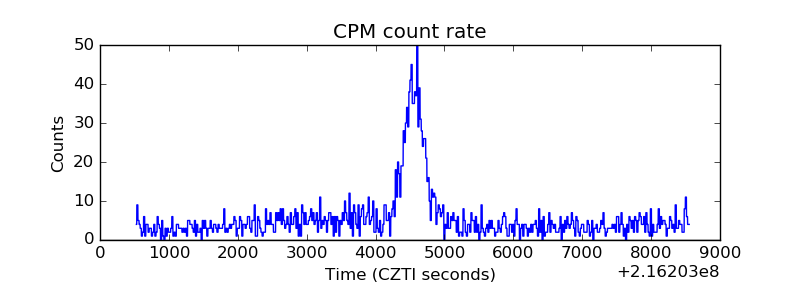 |
| CZT Counter | 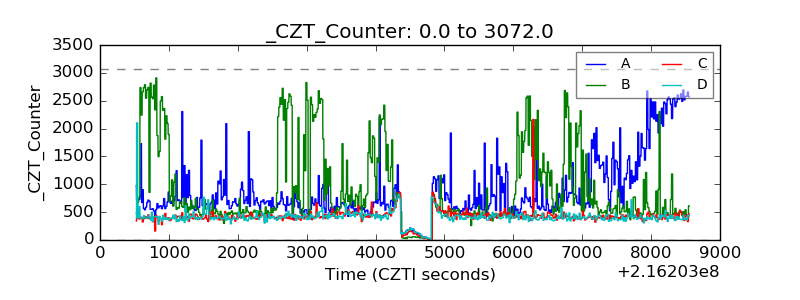 |
| +2.5 Volts monitor | 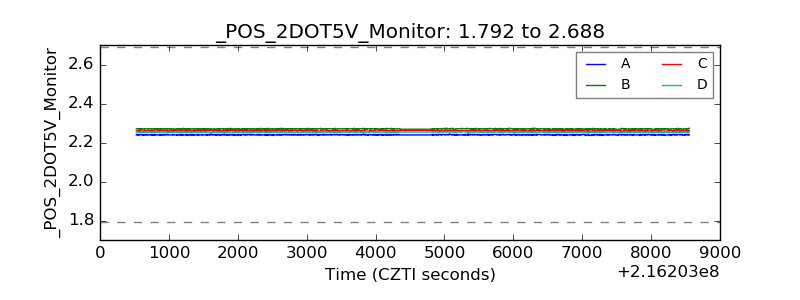 |
| +5 Volts monitor | 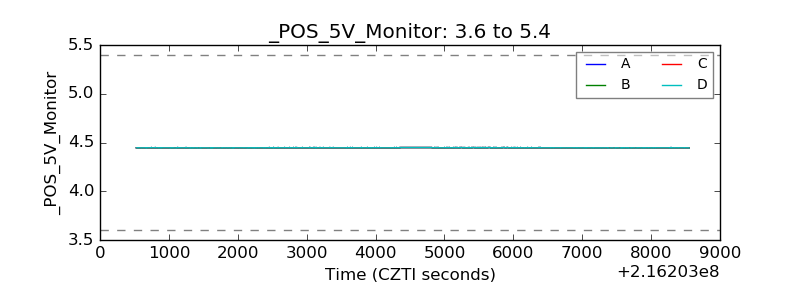 |
| _ROLL_ROT | 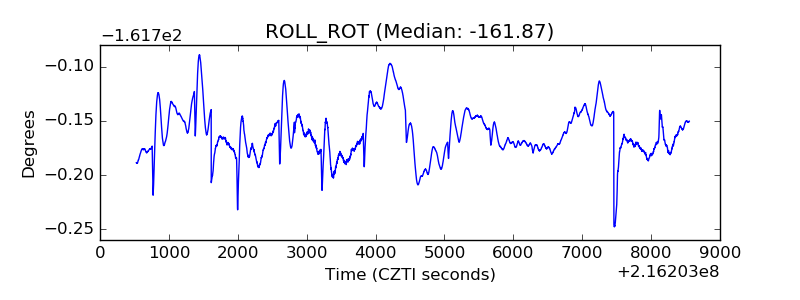 |
| _Roll_DEC | 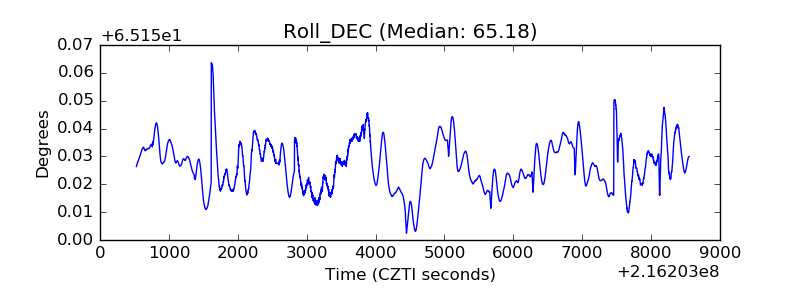 |
| _Roll_RA | 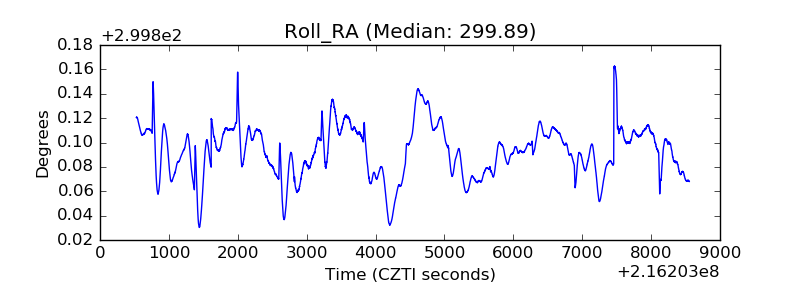 |
| Veto Counter | 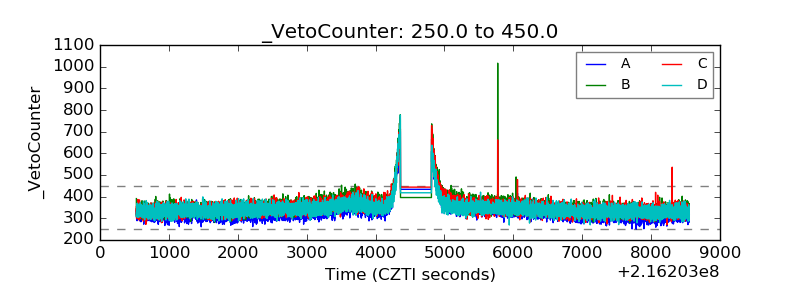 |