| Param | Original file | Final file |
|---|---|---|
| Filename | modeM0/AS1A02_006T01_9000000776cztM0_level2.fits | modeM0/AS1A02_006T01_9000000776cztM0_level2_quad_clean.evt |
| Size (bytes) | 622,422,720 | 604,166,400 |
| Size | 593.6 MB | 576.2 MB |
| Events in quadrant A | 3,681,607 | 3,528,144 |
| Events in quadrant B | 3,625,008 | 3,571,530 |
| Events in quadrant C | 3,668,174 | 3,366,667 |
| Events in quadrant D | 3,187,738 | 3,146,099 |
| Mode M9 | |||
|---|---|---|---|
| Quadrant | BADHDUFLAG | Total packets | Discarded packets |
| A | 0 | 108 | 0 |
| B | 0 | 106 | 0 |
| C | 0 | 108 | 0 |
| D | 0 | 106 | 0 |
| Mode SS | |||
|---|---|---|---|
| Quadrant | BADHDUFLAG | Total packets | Discarded packets |
| A | 0 | 1392 | 0 |
| B | 0 | 1406 | 0 |
| C | 0 | 1390 | 0 |
| D | 0 | 1389 | 0 |
| Mode M0 | |||
|---|---|---|---|
| Quadrant | BADHDUFLAG | Total packets | Discarded packets |
| A | 0 | 163629 | 0 |
| B | 0 | 150971 | 0 |
| C | 0 | 142970 | 0 |
| D | 0 | 143567 | 0 |
| Quadrant | Total seconds | Saturated seconds | Saturation percentage |
|---|---|---|---|
| A | 68105 | 1293 | 1.898539% |
| B | 68269 | 1562 | 2.288008% |
| C | 68276 | 1102 | 1.614037% |
| D | 68452 | 872 | 1.273885% |
Noise dominated data is calculated using 1-second bins in cleaned event files. If a bin has >2000 counts, and if more than 50% of those come from <1% of pixels, then it is considered to be noise-dominated and hence unusable.
| Quadrant | # 1 sec bins | Bins with >0 counts | Bins with >2000 counts | High rate bins dominated by noise | Noise dominated (total time) | Noise dominated (detector-on time) | Marked lightcurve |
|---|---|---|---|---|---|---|---|
| A | 80759 | 69688 | 0 | 0 | 0.00% | 0.00% |  |
| B | 80759 | 69717 | 0 | 0 | 0.00% | 0.00% |  |
| C | 80759 | 69660 | 0 | 0 | 0.00% | 0.00% |  |
| D | 80759 | 69806 | 0 | 0 | 0.00% | 0.00% |  |
Top three noisy pixels from each quadrant. If the there are fewer than three noisy pixels in the level2.evt file, extra rows are filled as -1
| Pixel properties | Quadrant properties | ||||||
|---|---|---|---|---|---|---|---|
| Quadrant | DetID | PixID | Counts | Sigma | Mean | Median | Sigma |
| A | 0 | 29 | 3608 | 11.09 | 954 | 885 | 245.5 |
| A | 14 | 188 | 3533 | 10.78 | 954 | 885 | 245.5 |
| A | 14 | 204 | 3126 | 9.13 | 954 | 885 | 245.5 |
| B | 2 | 9 | 3079 | 11.22 | 954 | 904 | 193.8 |
| B | 14 | 254 | 2510 | 8.29 | 954 | 904 | 193.8 |
| B | 12 | 226 | 2478 | 8.12 | 954 | 904 | 193.8 |
| C | 1 | 80 | 2668 | 6.92 | 969 | 894 | 256.4 |
| C | 1 | 81 | 2611 | 6.7 | 969 | 894 | 256.4 |
| C | 12 | 241 | 2597 | 6.64 | 969 | 894 | 256.4 |
| D | 3 | 14 | 2392 | 6.48 | 907 | 823 | 242.2 |
| D | 1 | 19 | 2364 | 6.36 | 907 | 823 | 242.2 |
| D | 3 | 31 | 2297 | 6.09 | 907 | 823 | 242.2 |
Histogram calculated using DETX and DETY for each event in the final _common_clean file
| Quadrant A | 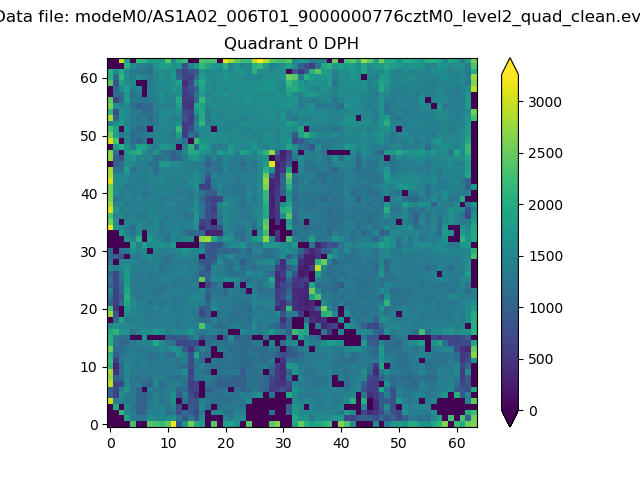 |
 |
Quadrant B |
|---|---|---|---|
| Quadrant D | 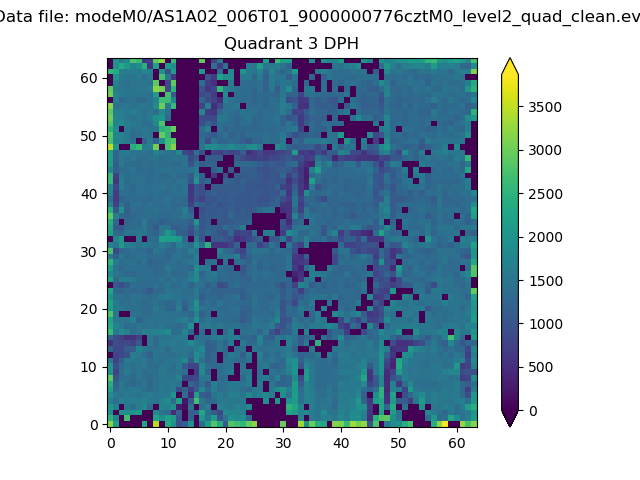 |
 |
Quadrant C |
| Plot type | Count rate plots | Images |
|---|---|---|
| Comparison with Poisson distribution Blue bars denote a histogram of data divided into 1 sec bins. Red curve is a Poisson curve with rate = median count rate of data. |
 |
 |
| Quadrant-wise count rates Data is divided into 100 sec bins |
 |
|
| Module-wise count rates for Quadrant A Data is divided into 100 sec bins |
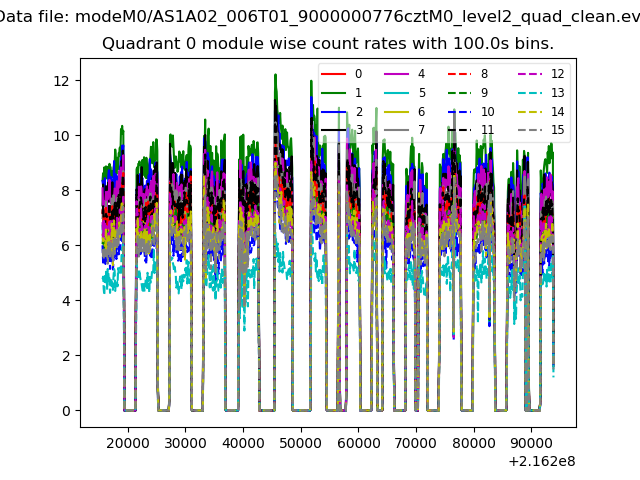 |
 |
| Module-wise count rates for Quadrant B Data is divided into 100 sec bins |
 |
 |
| Module-wise count rates for Quadrant C Data is divided into 100 sec bins |
 |
 |
| Module-wise count rates for Quadrant D Data is divided into 100 sec bins |
 |
 |
| Parameter | Plot |
|---|---|
| CZT HV Monitor | 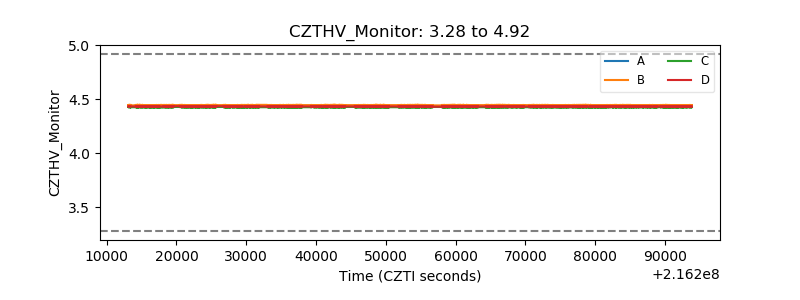 |
| D_VDD | 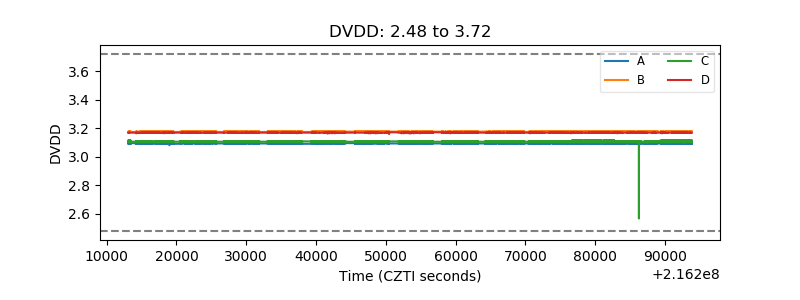 |
| Temperature 1 |  |
| Veto HV Monitor | 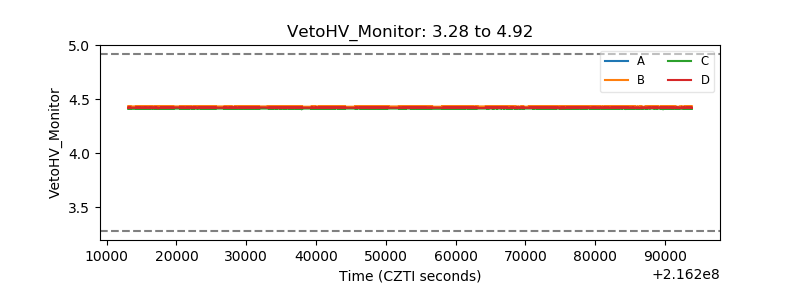 |
| Veto LLD |  |
| Alpha Counter |  |
| _CPM_Rate |  |
| CZT Counter |  |
| +2.5 Volts monitor | 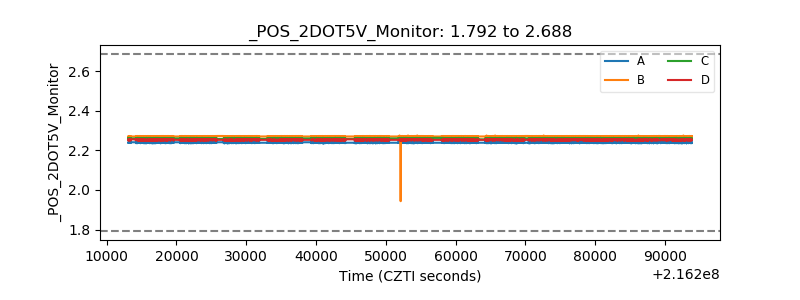 |
| +5 Volts monitor |  |
| _ROLL_ROT |  |
| _Roll_DEC |  |
| _Roll_RA | 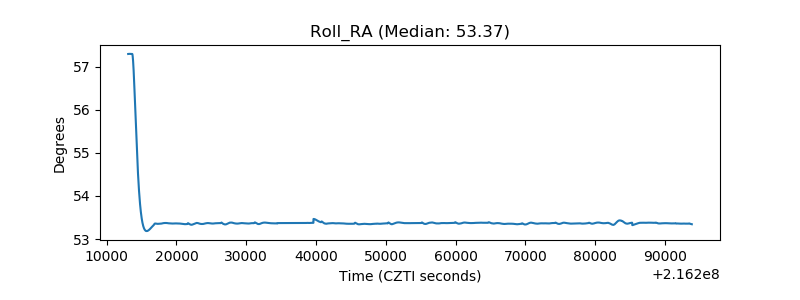 |
| Veto Counter |  |