| Param | Original file | Final file |
|---|---|---|
| Filename | modeM0/AS1A02_006T01_9000000776_06019cztM0_level2.evt | modeM0/AS1A02_006T01_9000000776_06019cztM0_level2_quad_clean.evt |
| Size (bytes) | 1,559,963,520 | 301,176,000 |
| Size | 1.5 GB | 287.2 MB |
| Events in quadrant A | 13,562,661 | 1,902,395 |
| Events in quadrant B | 11,509,802 | 1,957,774 |
| Events in quadrant C | 10,843,744 | 1,881,830 |
| Events in quadrant D | 9,824,431 | 1,849,895 |
| Mode M9 | |||
|---|---|---|---|
| Quadrant | BADHDUFLAG | Total packets | Discarded packets |
| A | 0 | 48 | 0 |
| B | 0 | 48 | 2 |
| C | 0 | 48 | 0 |
| D | 0 | 48 | 2 |
| Mode SS | |||
|---|---|---|---|
| Quadrant | BADHDUFLAG | Total packets | Discarded packets |
| A | 0 | 470 | 10 |
| B | 0 | 470 | 10 |
| C | 0 | 470 | 14 |
| D | 0 | 470 | 14 |
| Mode M0 | |||
|---|---|---|---|
| Quadrant | BADHDUFLAG | Total packets | Discarded packets |
| A | 0 | 57384 | 2072 |
| B | 0 | 50677 | 1756 |
| C | 0 | 50521 | 2495 |
| D | 0 | 47585 | 1462 |
| Quadrant | Total seconds | Saturated seconds | Saturation percentage |
|---|---|---|---|
| A | 22154 | 346 | 1.561795% |
| B | 22220 | 356 | 1.602160% |
| C | 22173 | 462 | 2.083615% |
| D | 22269 | 212 | 0.951996% |
Noise dominated data is calculated using 1-second bins in cleaned event files. If a bin has >2000 counts, and if more than 50% of those come from <1% of pixels, then it is considered to be noise-dominated and hence unusable.
| Quadrant | # 1 sec bins | Bins with >0 counts | Bins with >2000 counts | High rate bins dominated by noise | Noise dominated (total time) | Noise dominated (detector-on time) | Marked lightcurve |
|---|---|---|---|---|---|---|---|
| A | 27787 | 22773 | 31 | 31 | 0.11% | 0.14% | 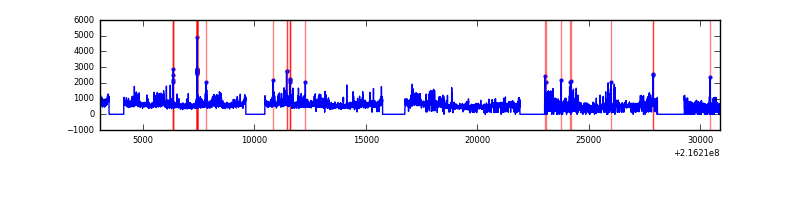 |
| B | 27788 | 22783 | 69 | 69 | 0.25% | 0.30% | 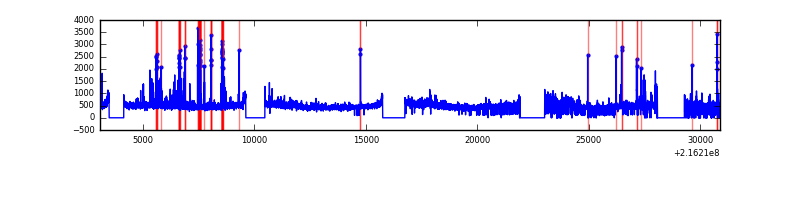 |
| C | 27790 | 22697 | 202 | 202 | 0.73% | 0.89% | 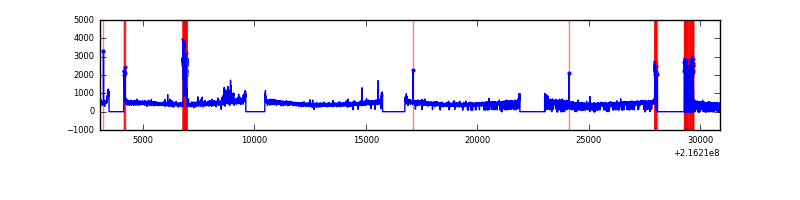 |
| D | 27789 | 22827 | 29 | 29 | 0.10% | 0.13% | 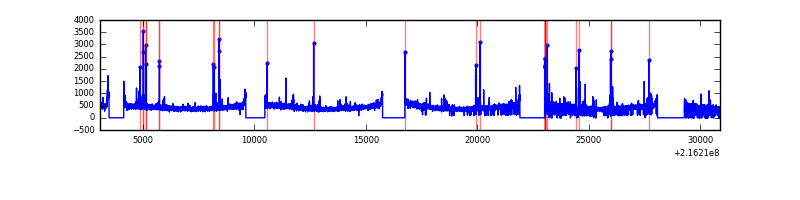 |
Top three noisy pixels from each quadrant. If the there are fewer than three noisy pixels in the level2.evt file, extra rows are filled as -1
| Pixel properties | Quadrant properties | ||||||
|---|---|---|---|---|---|---|---|
| Quadrant | DetID | PixID | Counts | Sigma | Mean | Median | Sigma |
| A | 13 | 34 | 3318485 | 6369.63 | 2567 | 2507 | 520.6 |
| A | 7 | 16 | 166546 | 315.1 | 2567 | 2507 | 520.6 |
| A | 8 | 15 | 83830 | 156.21 | 2567 | 2507 | 520.6 |
| B | 15 | 204 | 558083 | 1112.85 | 2615 | 2551 | 499.2 |
| B | 3 | 64 | 542238 | 1081.11 | 2615 | 2551 | 499.2 |
| B | 7 | 221 | 91672 | 178.53 | 2615 | 2551 | 499.2 |
| C | 1 | 241 | 1059773 | 1829.46 | 2493 | 2499 | 577.9 |
| C | 1 | 16 | 30457 | 48.38 | 2493 | 2499 | 577.9 |
| C | 13 | 61 | 19763 | 29.87 | 2493 | 2499 | 577.9 |
| D | 12 | 221 | 90732 | 144.99 | 2509 | 2430 | 609.0 |
| D | 2 | 206 | 75662 | 120.25 | 2509 | 2430 | 609.0 |
| D | 5 | 97 | 74595 | 118.5 | 2509 | 2430 | 609.0 |
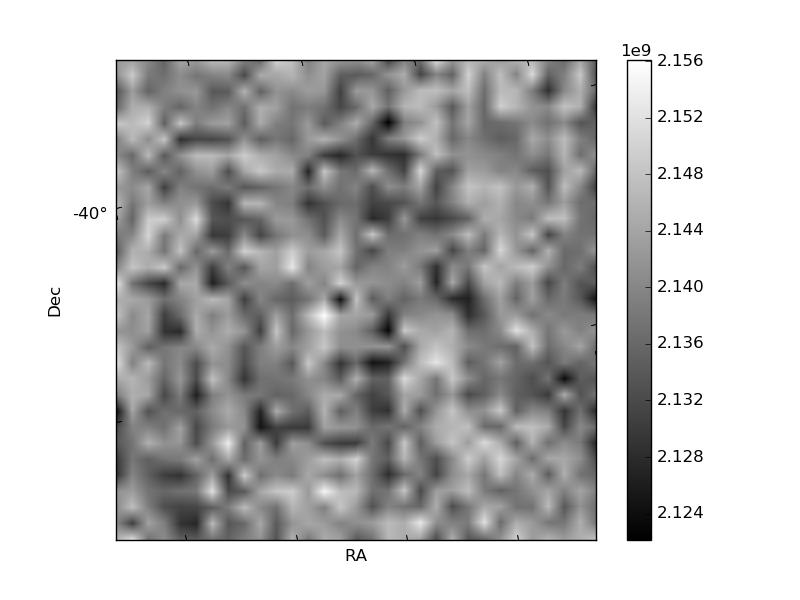
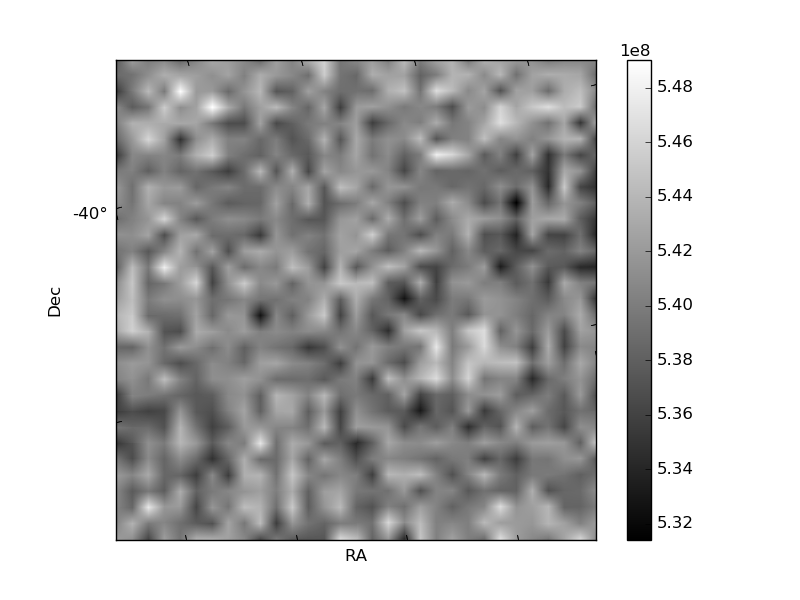
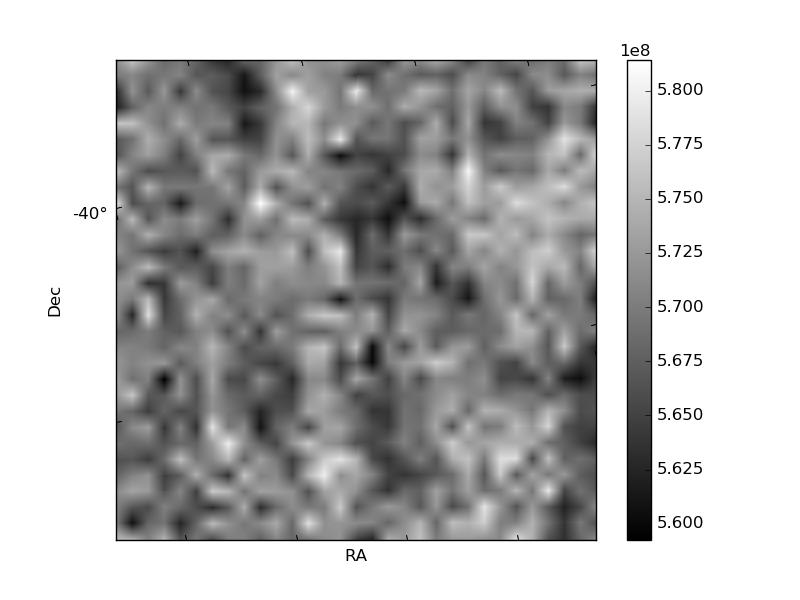
Histogram calculated using DETX and DETY for each event in the final _common_clean file
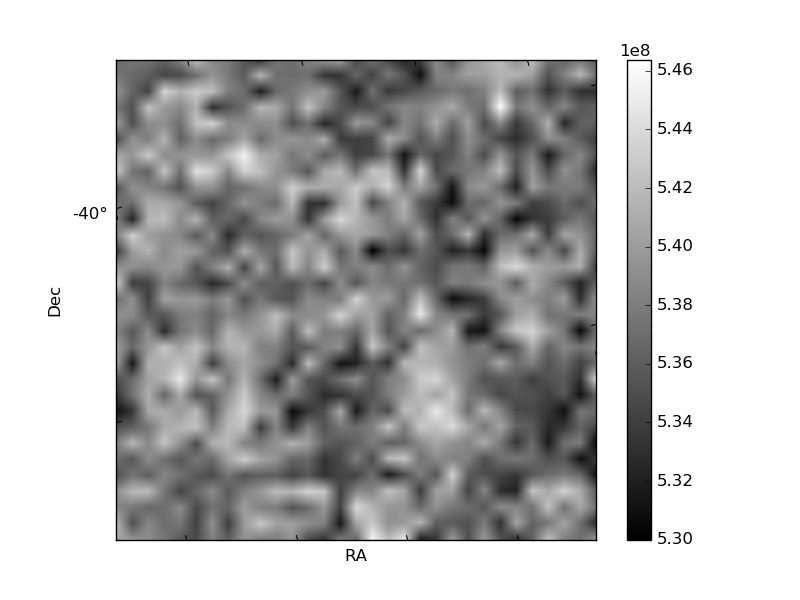
| Quadrant A | 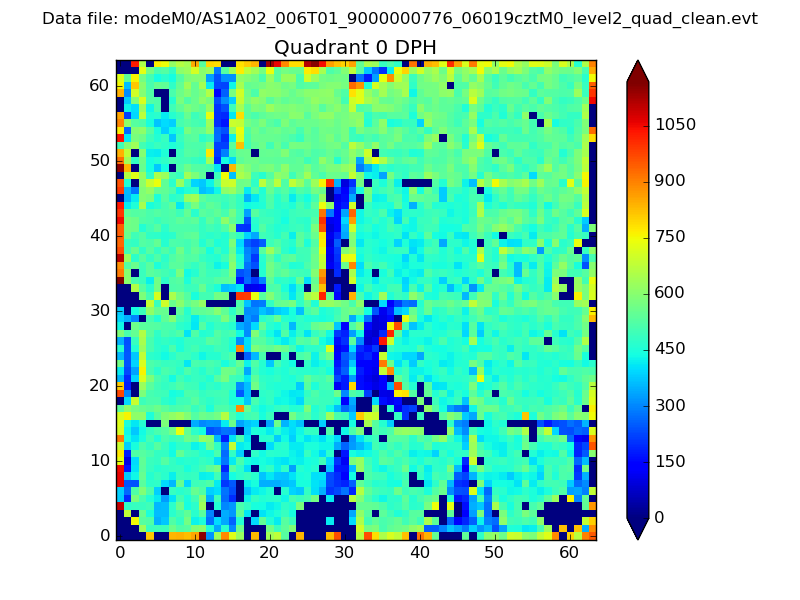 |
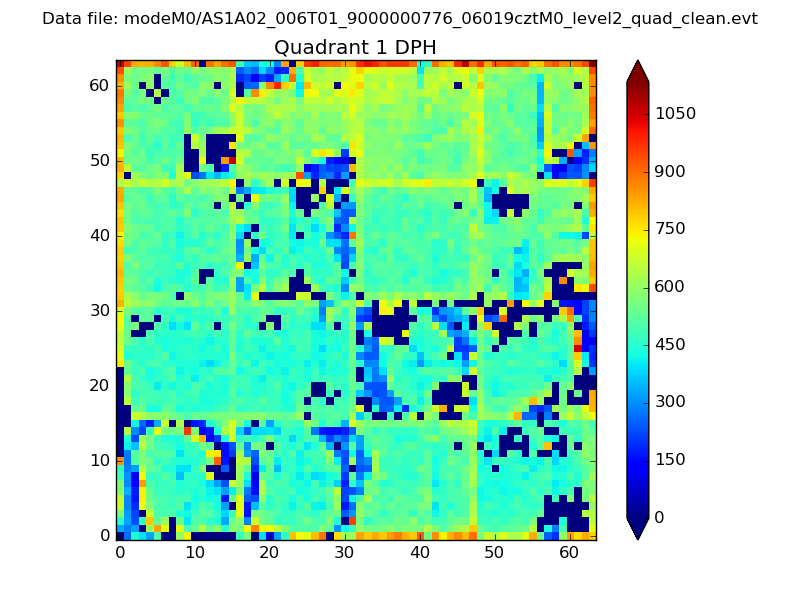 |
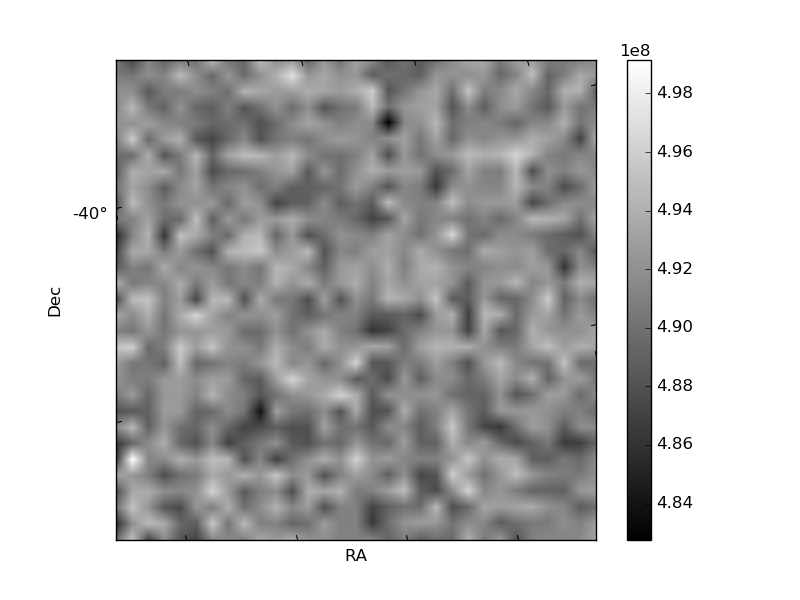
Quadrant B |
|---|---|---|---|
| Quadrant D | 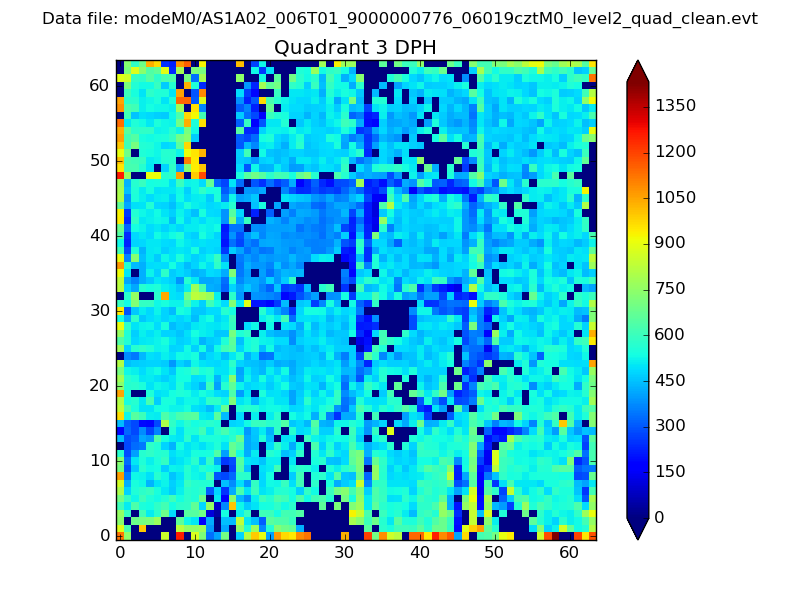 |
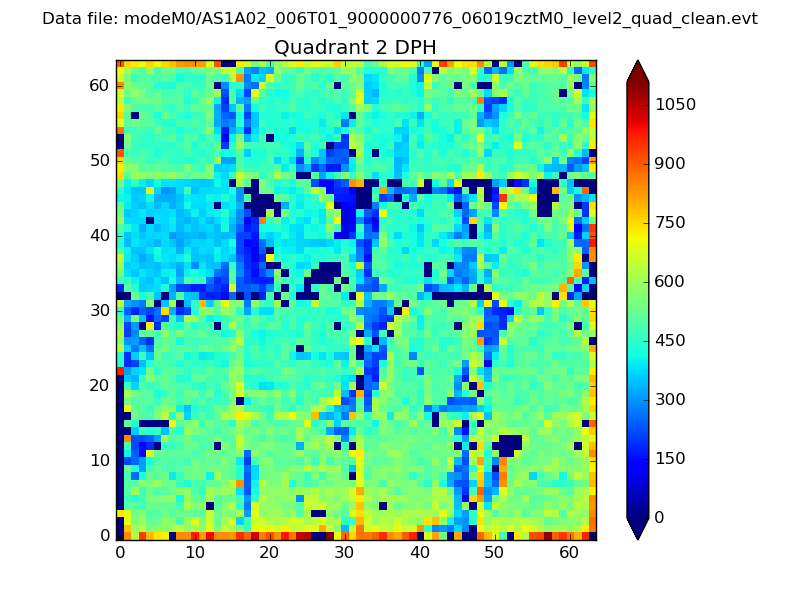 |
Quadrant C |
| Plot type | Count rate plots | Images |
|---|---|---|
| Comparison with Poisson distribution Blue bars denote a histogram of data divided into 1 sec bins. Red curve is a Poisson curve with rate = median count rate of data. |
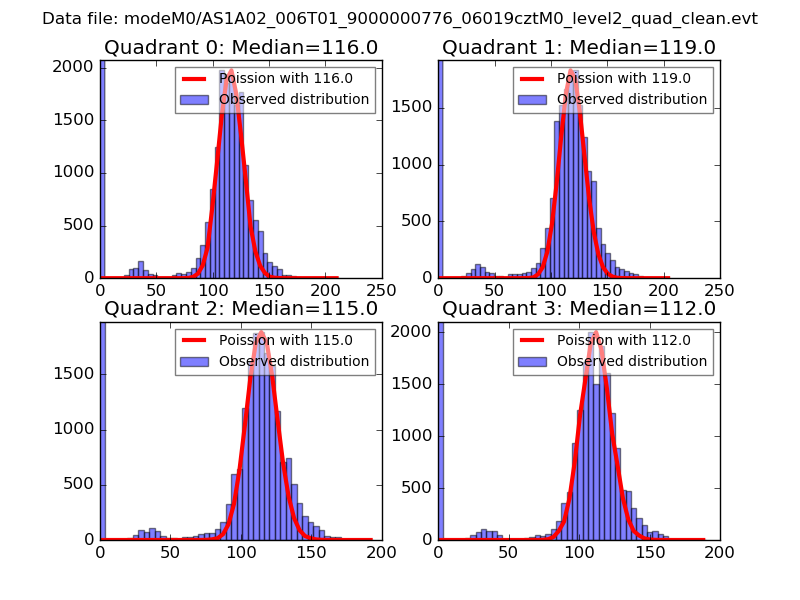 |
 |
| Quadrant-wise count rates Data is divided into 100 sec bins |
 |
|
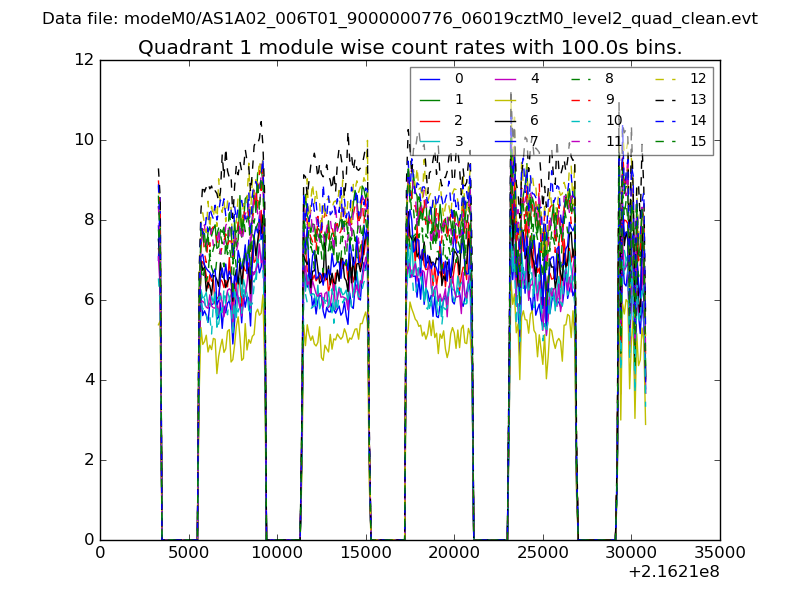
| Module-wise count rates for Quadrant A Data is divided into 100 sec bins |
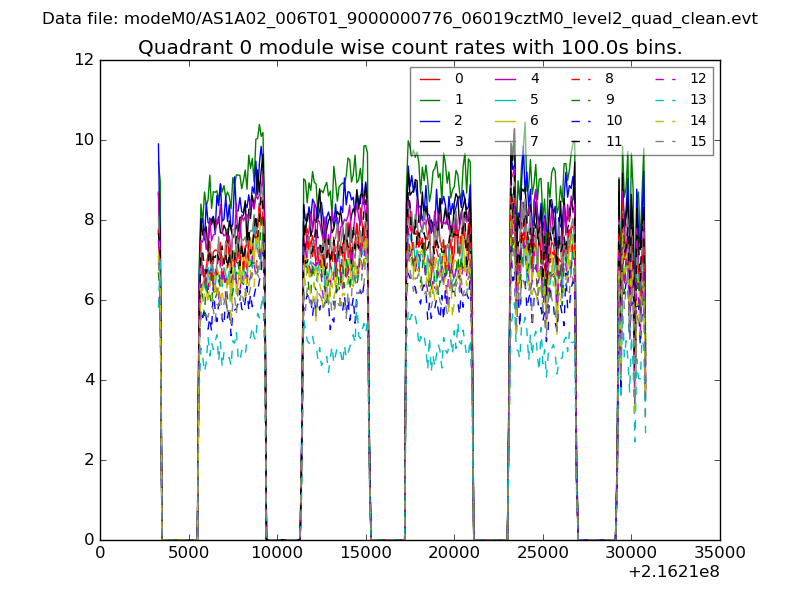 |
 |
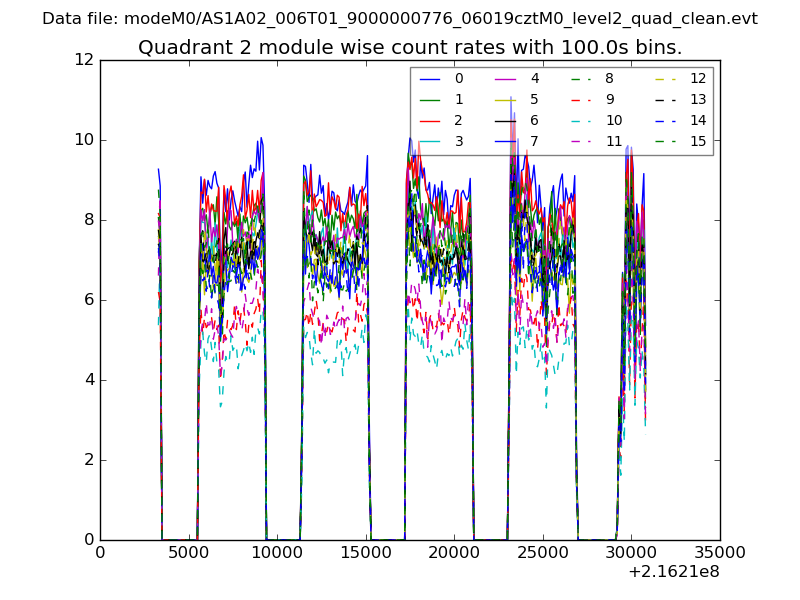
| Module-wise count rates for Quadrant B Data is divided into 100 sec bins |
 |
 |
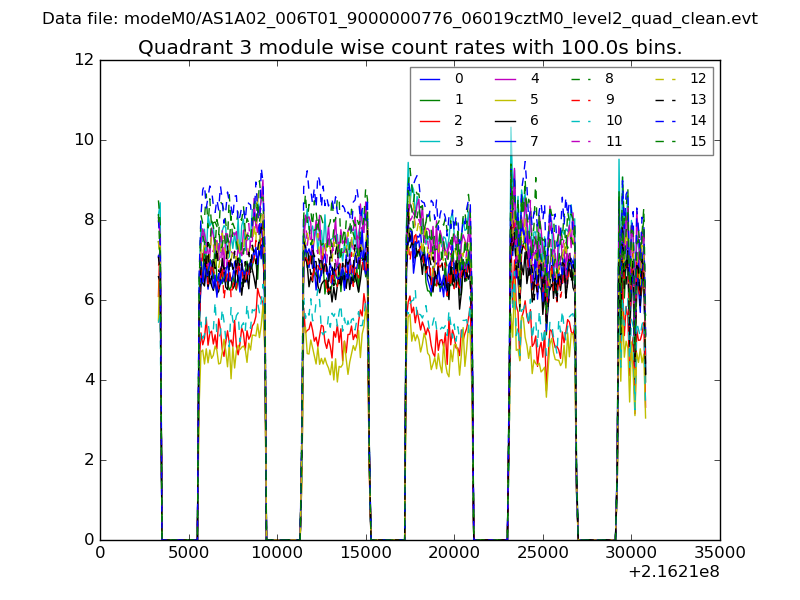
| Module-wise count rates for Quadrant C Data is divided into 100 sec bins |
 |
 |
| Module-wise count rates for Quadrant D Data is divided into 100 sec bins |
 |
 |
| Parameter | Plot |
|---|---|
| CZT HV Monitor | 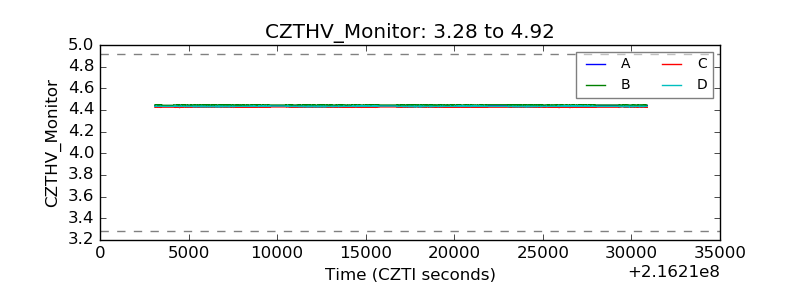 |
| D_VDD | 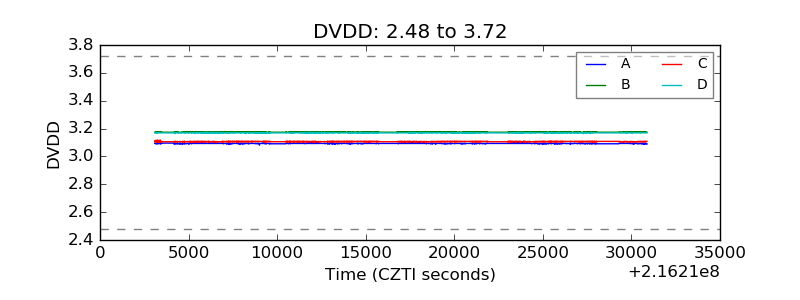 |
| Temperature 1 | 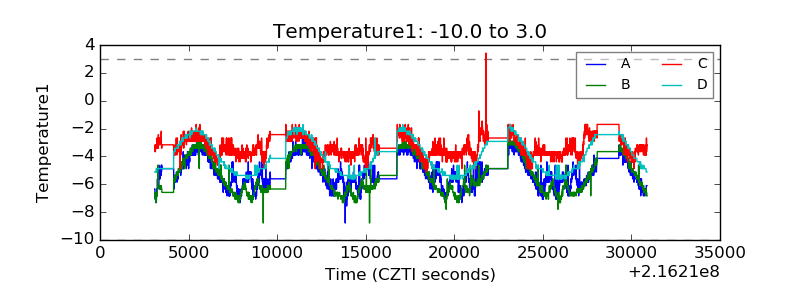 |
| Veto HV Monitor | 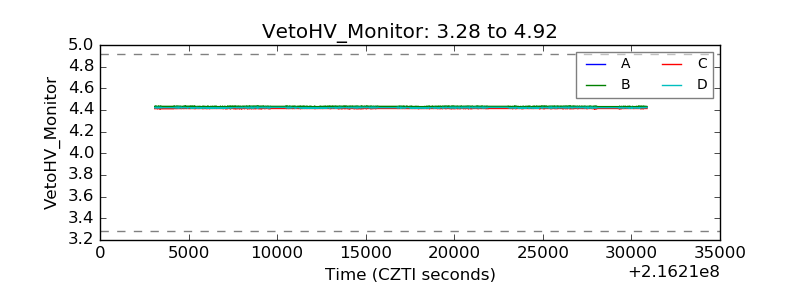 |
| Veto LLD | 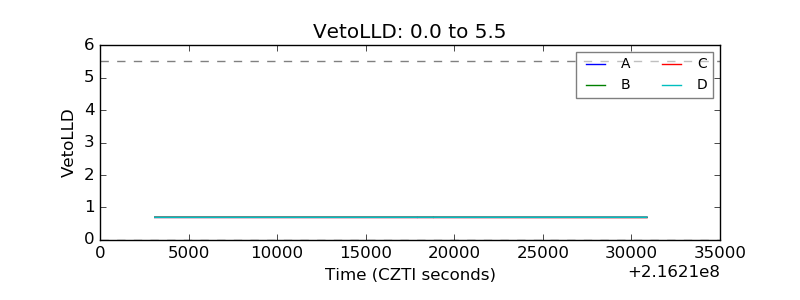 |
| Alpha Counter | 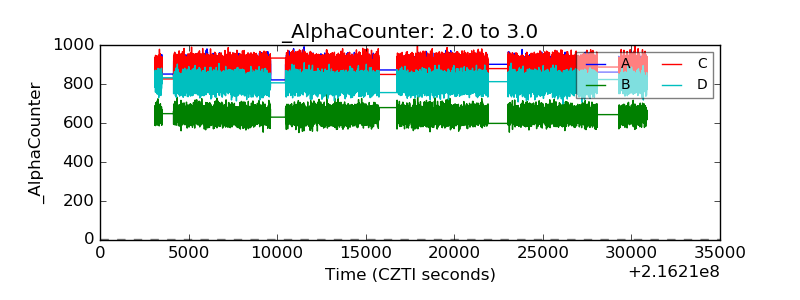 |
| _CPM_Rate | 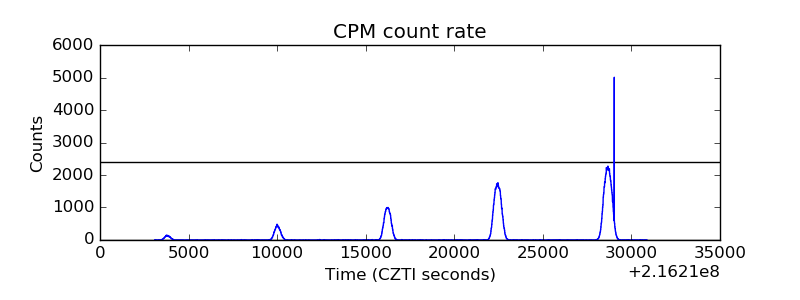 |
| CZT Counter | 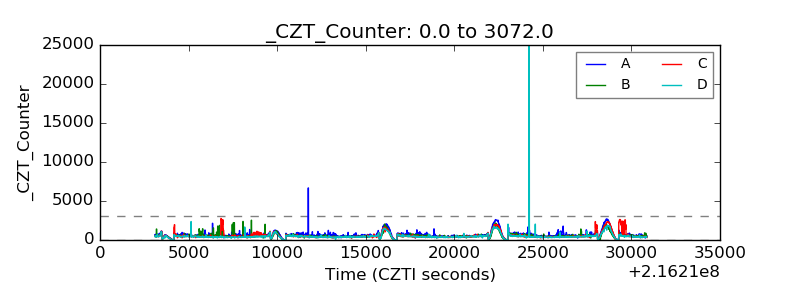 |
| +2.5 Volts monitor |  |
| +5 Volts monitor |  |
| _ROLL_ROT | 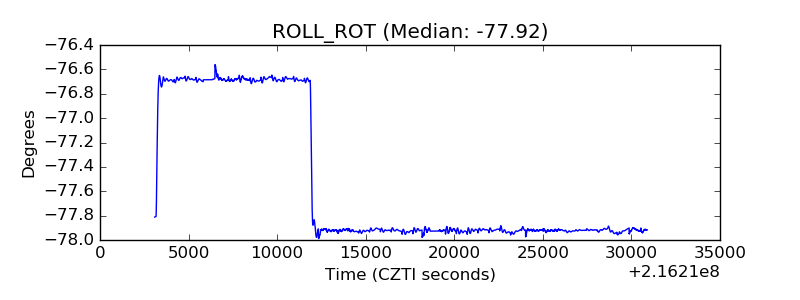 |
| _Roll_DEC | 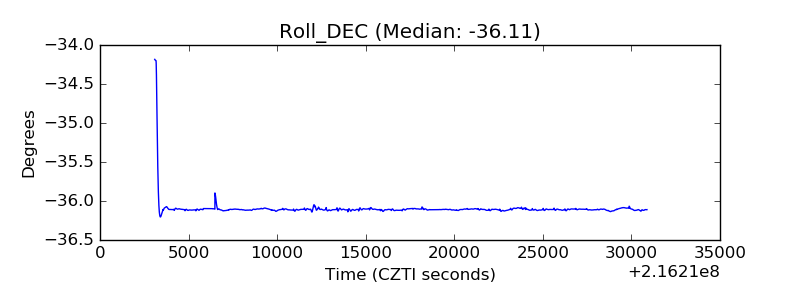 |
| _Roll_RA | 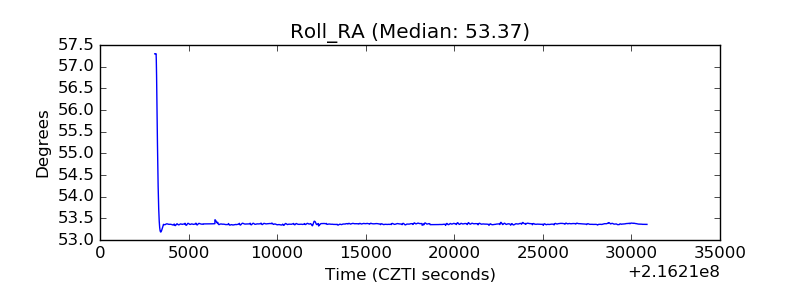 |
| Veto Counter | 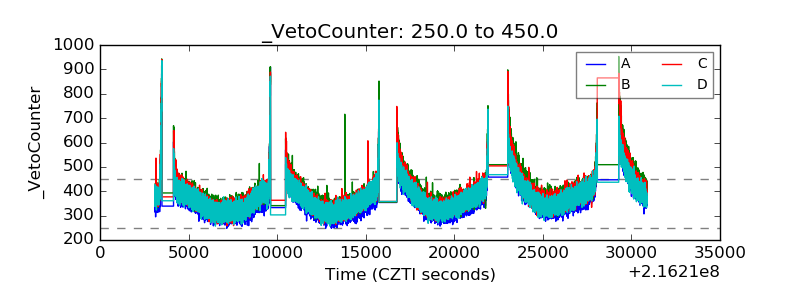 |