| Param | Original file | Final file |
|---|---|---|
| Filename | modeM0/AS1A02_006T01_9000000776_06023cztM0_level2.evt | modeM0/AS1A02_006T01_9000000776_06023cztM0_level2_quad_clean.evt |
| Size (bytes) | 440,691,840 | 90,728,640 |
| Size | 420.3 MB | 86.5 MB |
| Events in quadrant A | 3,723,226 | 569,443 |
| Events in quadrant B | 3,228,290 | 588,772 |
| Events in quadrant C | 3,036,357 | 569,925 |
| Events in quadrant D | 2,898,557 | 547,840 |
| Mode M9 | |||
|---|---|---|---|
| Quadrant | BADHDUFLAG | Total packets | Discarded packets |
| A | 0 | 23 | 0 |
| B | 0 | 23 | 0 |
| C | 0 | 23 | 0 |
| D | 0 | 23 | 0 |
| Mode SS | |||
|---|---|---|---|
| Quadrant | BADHDUFLAG | Total packets | Discarded packets |
| A | 0 | 138 | 0 |
| B | 0 | 138 | 0 |
| C | 0 | 138 | 0 |
| D | 0 | 138 | 0 |
| Mode M0 | |||
|---|---|---|---|
| Quadrant | BADHDUFLAG | Total packets | Discarded packets |
| A | 0 | 15263 | 3 |
| B | 0 | 14160 | 2 |
| C | 0 | 13835 | 2 |
| D | 0 | 13810 | 2 |
| Quadrant | Total seconds | Saturated seconds | Saturation percentage |
|---|---|---|---|
| A | 6771 | 45 | 0.664599% |
| B | 6771 | 42 | 0.620292% |
| C | 6771 | 18 | 0.265840% |
| D | 6771 | 6 | 0.088613% |
Noise dominated data is calculated using 1-second bins in cleaned event files. If a bin has >2000 counts, and if more than 50% of those come from <1% of pixels, then it is considered to be noise-dominated and hence unusable.
| Quadrant | # 1 sec bins | Bins with >0 counts | Bins with >2000 counts | High rate bins dominated by noise | Noise dominated (total time) | Noise dominated (detector-on time) | Marked lightcurve |
|---|---|---|---|---|---|---|---|
| A | 9016 | 6773 | 7 | 7 | 0.08% | 0.10% | 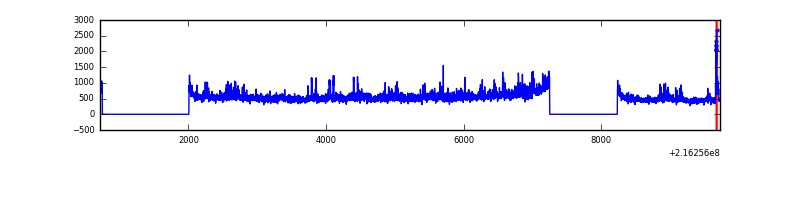 |
| B | 9016 | 6773 | 2 | 2 | 0.02% | 0.03% | 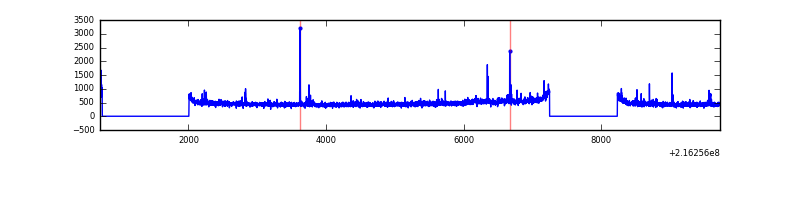 |
| C | 9016 | 6773 | 0 | 0 | 0.00% | 0.00% | 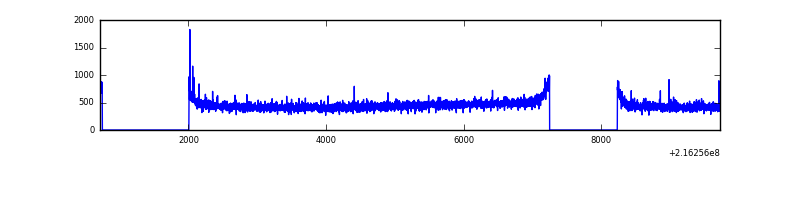 |
| D | 9016 | 6773 | 1 | 1 | 0.01% | 0.01% | 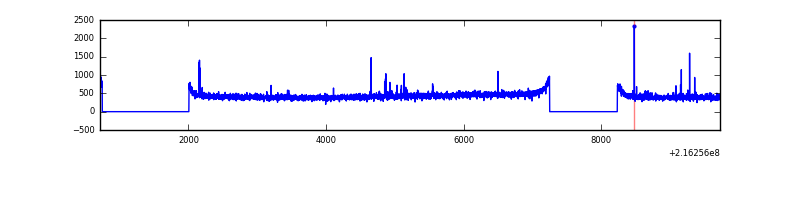 |
Top three noisy pixels from each quadrant. If the there are fewer than three noisy pixels in the level2.evt file, extra rows are filled as -1
| Pixel properties | Quadrant properties | ||||||
|---|---|---|---|---|---|---|---|
| Quadrant | DetID | PixID | Counts | Sigma | Mean | Median | Sigma |
| A | 13 | 34 | 688624 | 4335.72 | 778 | 762 | 158.7 |
| A | 15 | 234 | 35923 | 221.63 | 778 | 762 | 158.7 |
| A | 0 | 226 | 7302 | 41.22 | 778 | 762 | 158.7 |
| B | 3 | 64 | 51400 | 334.56 | 794 | 773 | 151.3 |
| B | 15 | 204 | 47226 | 306.98 | 794 | 773 | 151.3 |
| B | 12 | 111 | 15271 | 95.81 | 794 | 773 | 151.3 |
| C | 1 | 16 | 17043 | 90.05 | 770 | 774 | 180.7 |
| C | 8 | 208 | 7356 | 36.43 | 770 | 774 | 180.7 |
| C | 13 | 61 | 6170 | 29.87 | 770 | 774 | 180.7 |
| D | 2 | 206 | 13353 | 67.54 | 759 | 734 | 186.8 |
| D | 5 | 97 | 11815 | 59.31 | 759 | 734 | 186.8 |
| D | 2 | 33 | 8224 | 40.09 | 759 | 734 | 186.8 |
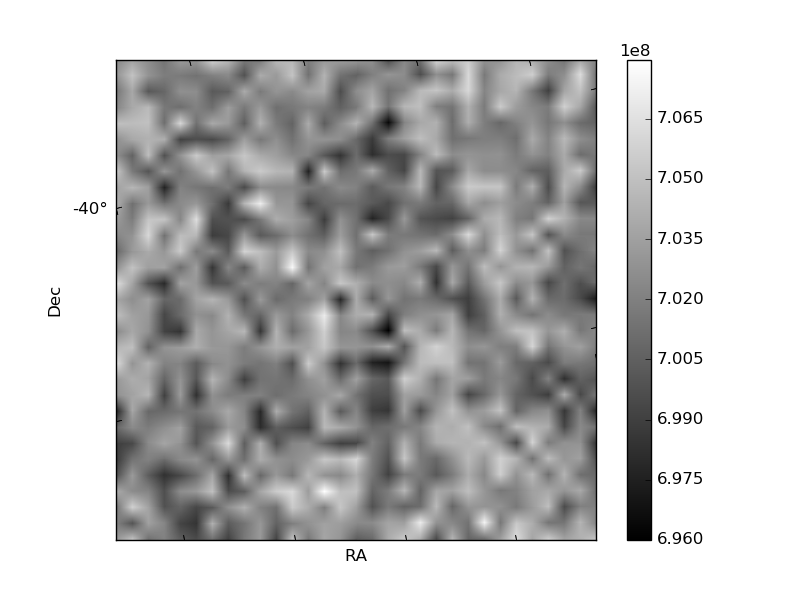
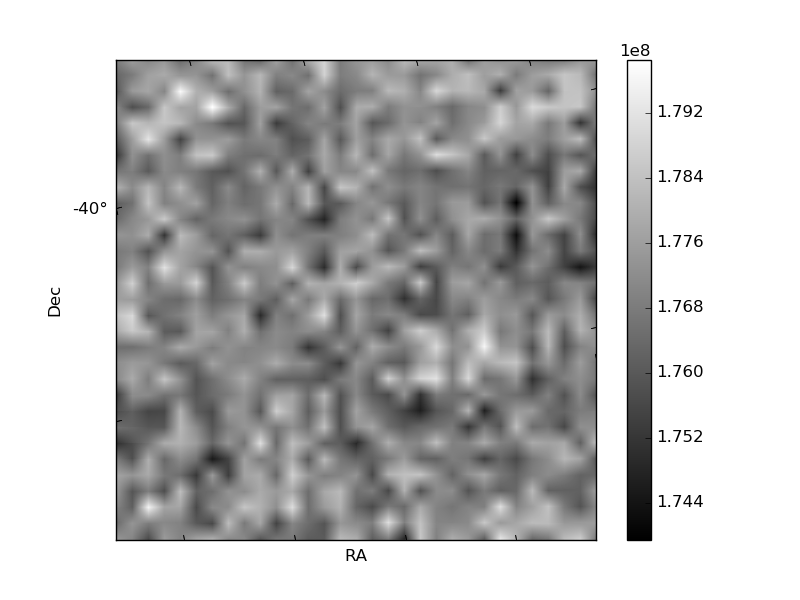
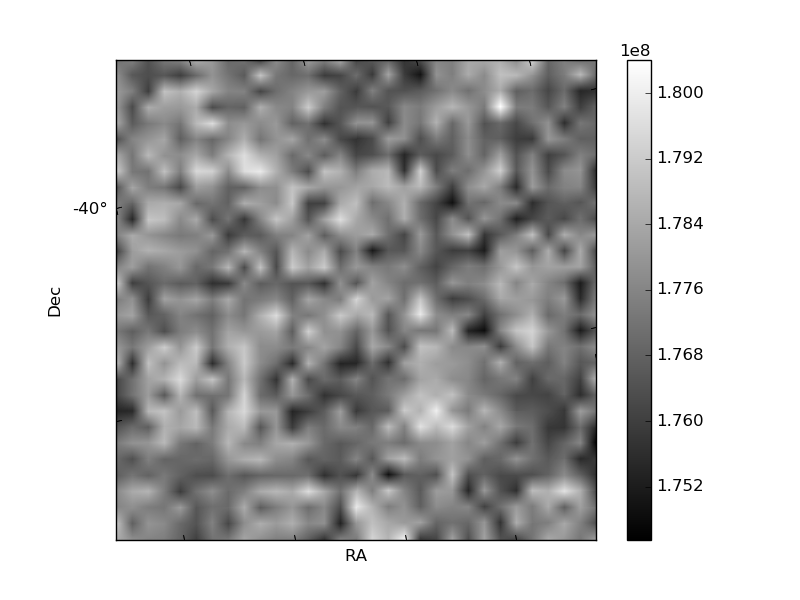
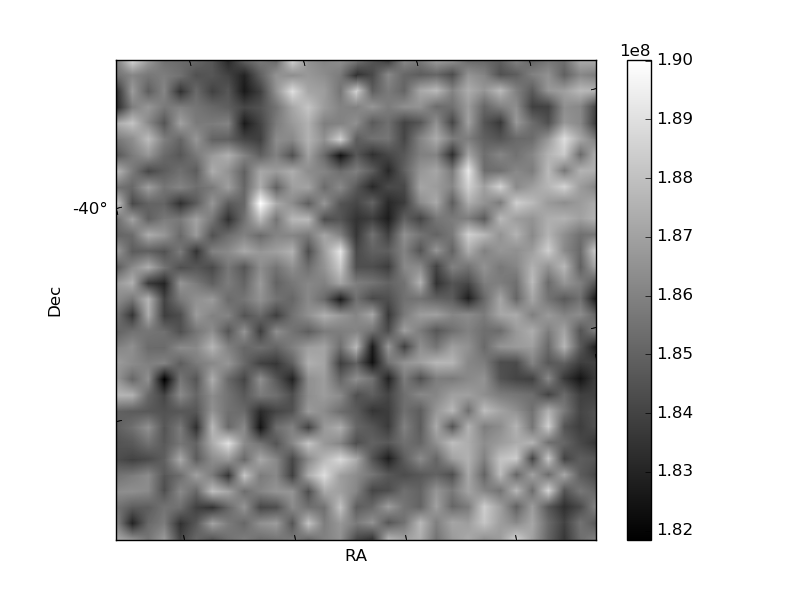
Histogram calculated using DETX and DETY for each event in the final _common_clean file
| Quadrant A | 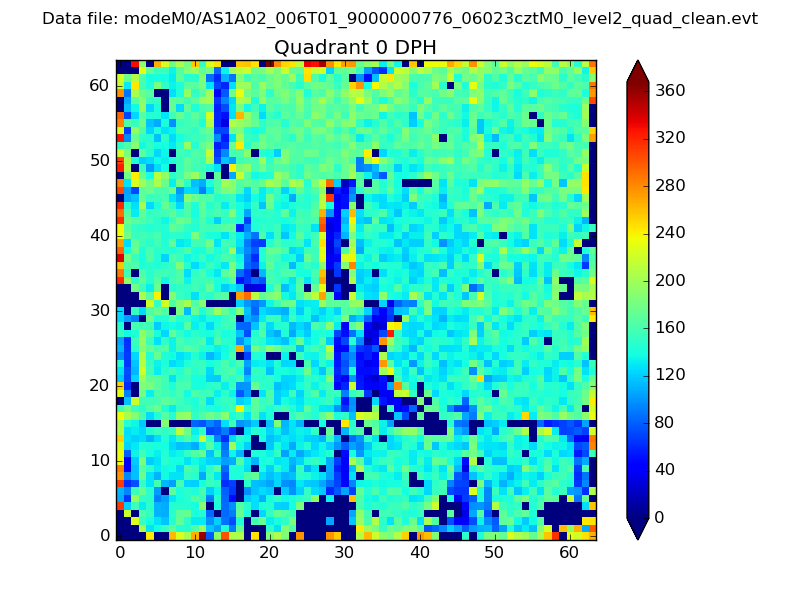 |
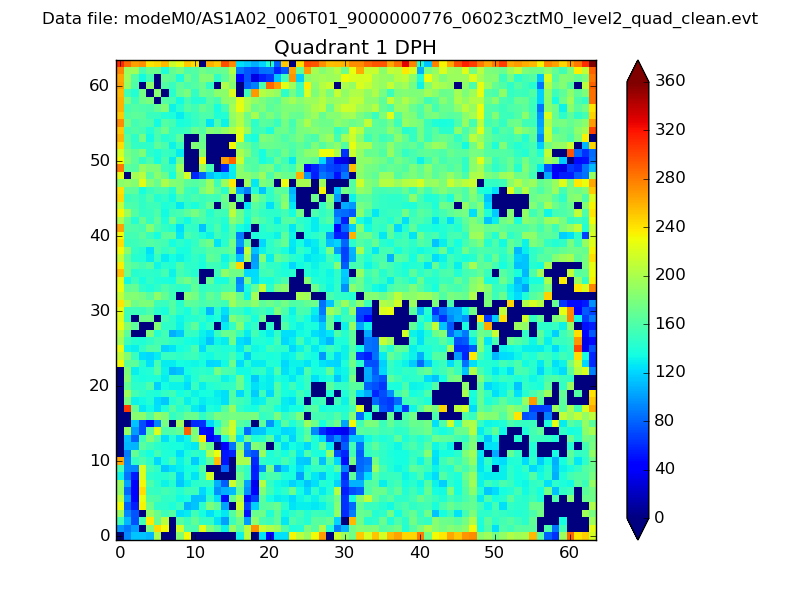 |
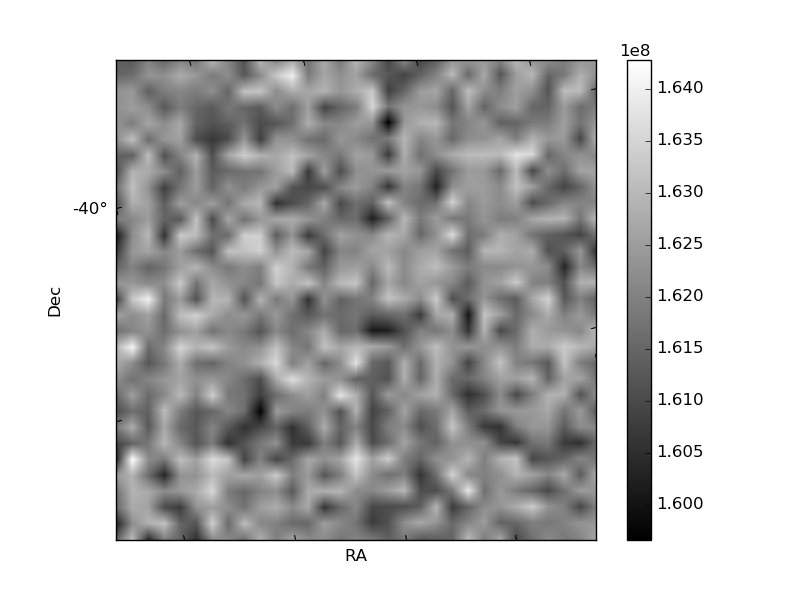
Quadrant B |
|---|---|---|---|
| Quadrant D | 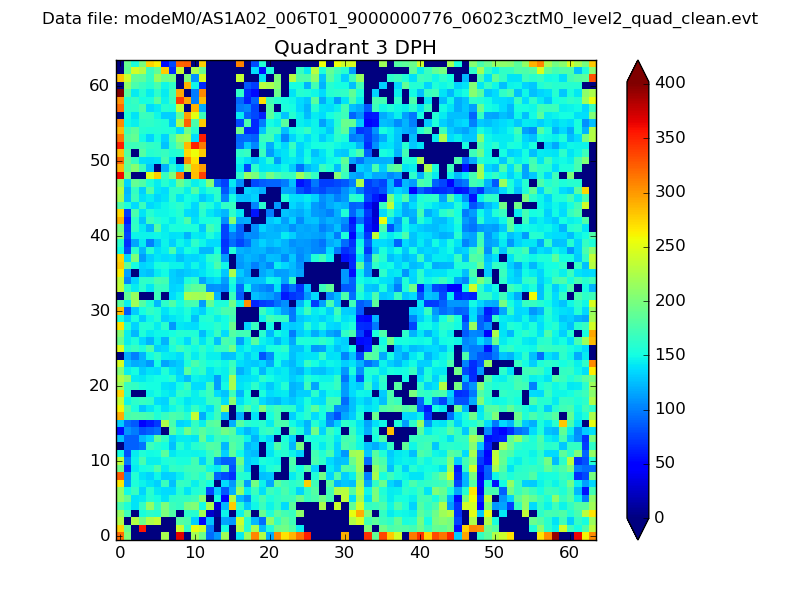 |
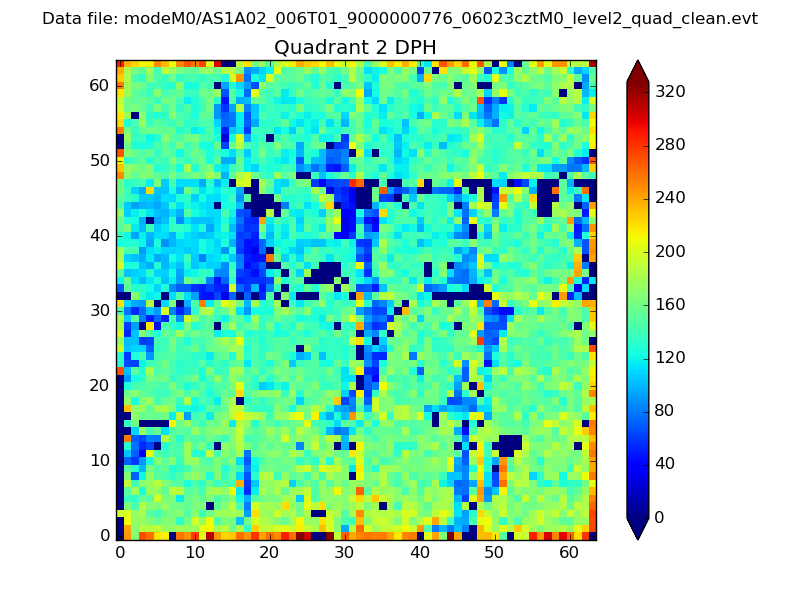 |
Quadrant C |
| Plot type | Count rate plots | Images |
|---|---|---|
| Comparison with Poisson distribution Blue bars denote a histogram of data divided into 1 sec bins. Red curve is a Poisson curve with rate = median count rate of data. |
 |
 |
| Quadrant-wise count rates Data is divided into 100 sec bins |
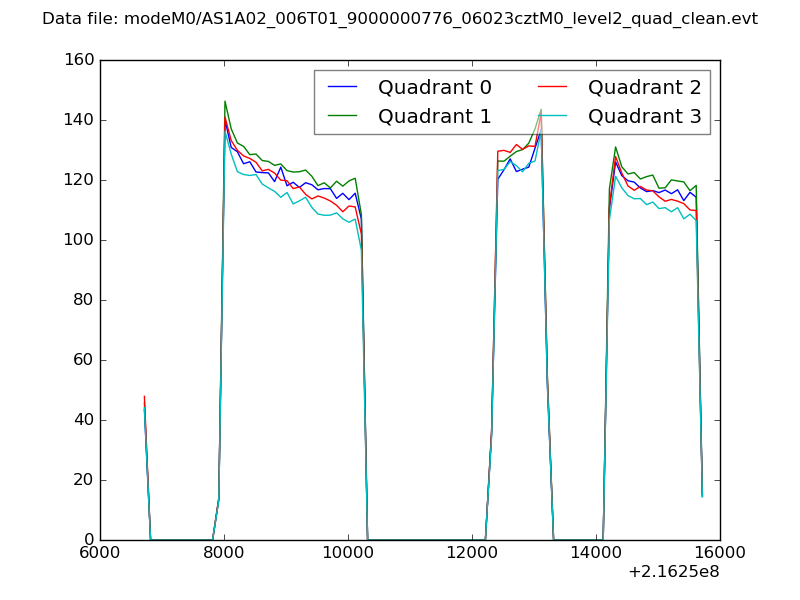 |
|
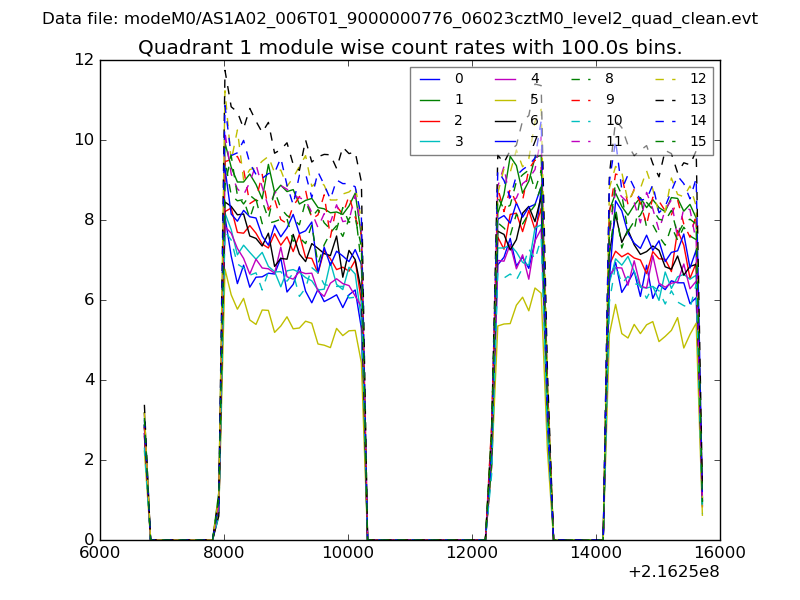
| Module-wise count rates for Quadrant A Data is divided into 100 sec bins |
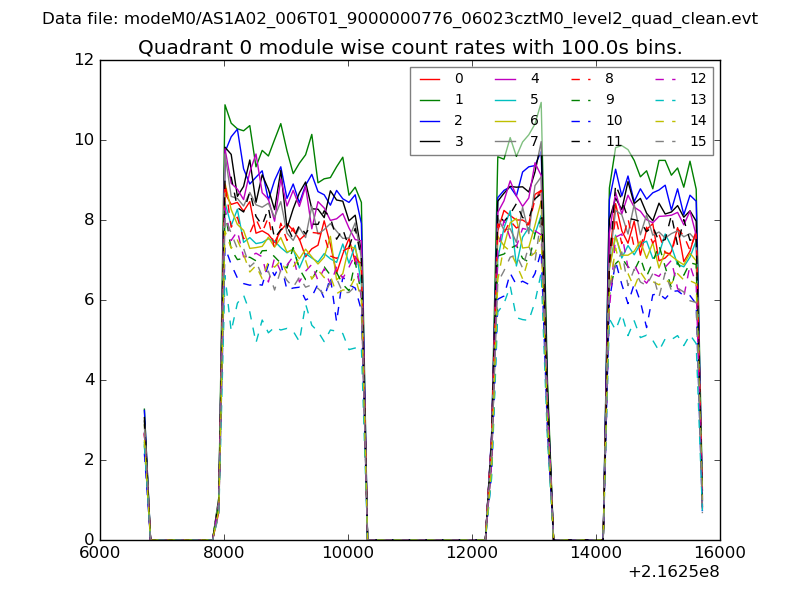 |
 |
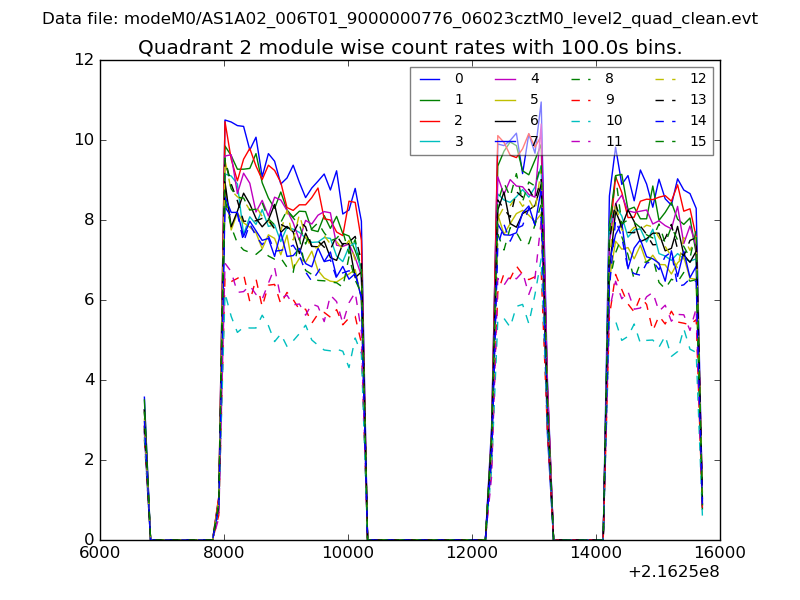
| Module-wise count rates for Quadrant B Data is divided into 100 sec bins |
 |
 |
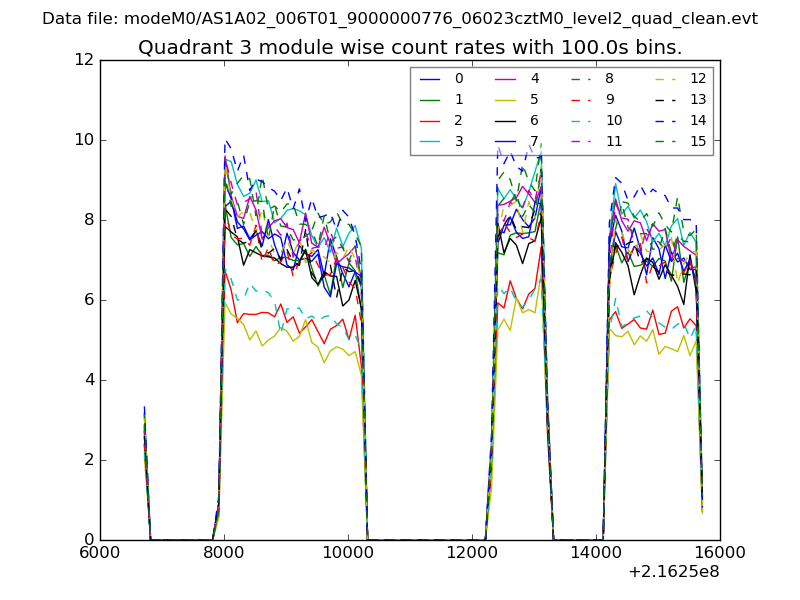
| Module-wise count rates for Quadrant C Data is divided into 100 sec bins |
 |
 |
| Module-wise count rates for Quadrant D Data is divided into 100 sec bins |
 |
 |
| Parameter | Plot |
|---|---|
| CZT HV Monitor | 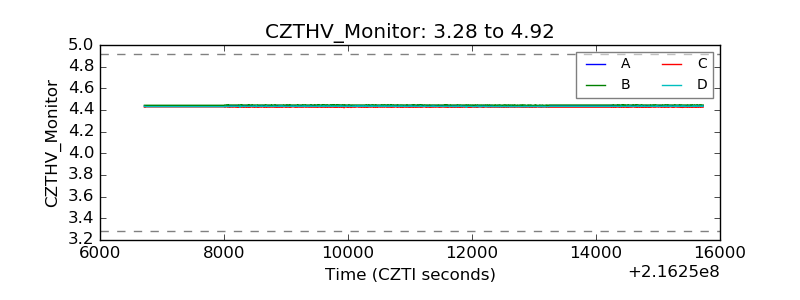 |
| D_VDD | 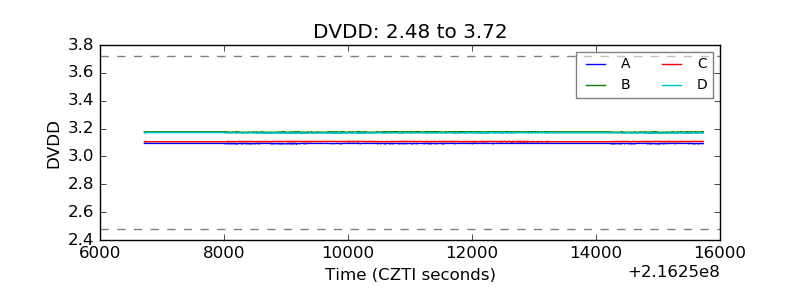 |
| Temperature 1 | 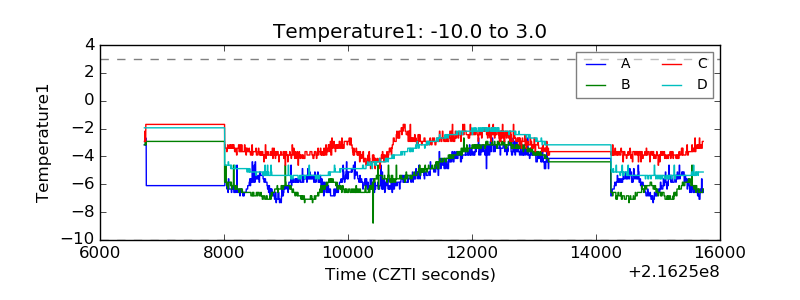 |
| Veto HV Monitor | 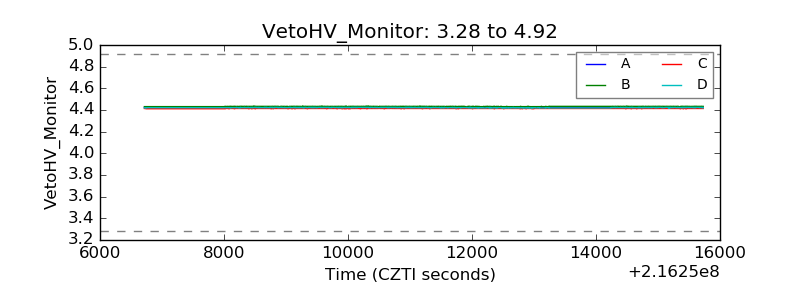 |
| Veto LLD | 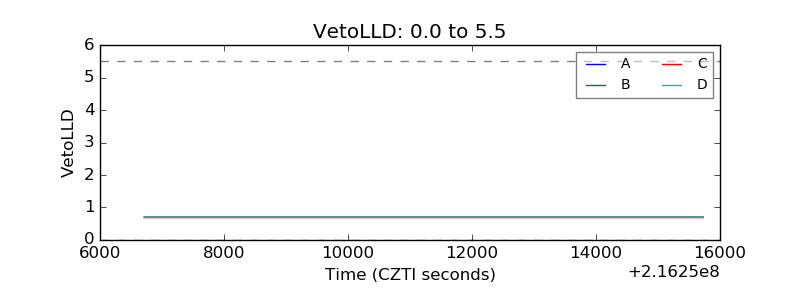 |
| Alpha Counter | 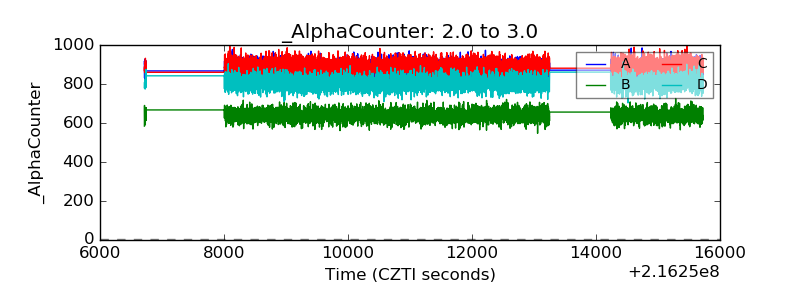 |
| _CPM_Rate | 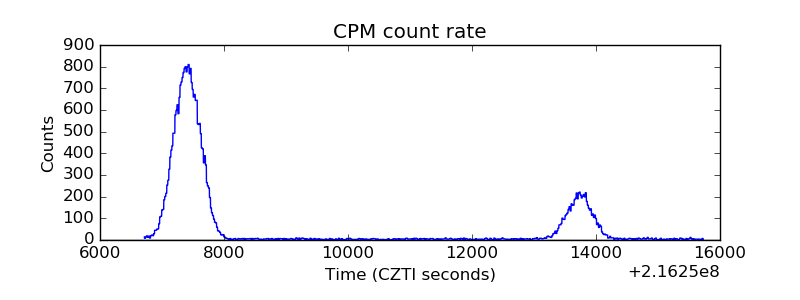 |
| CZT Counter | 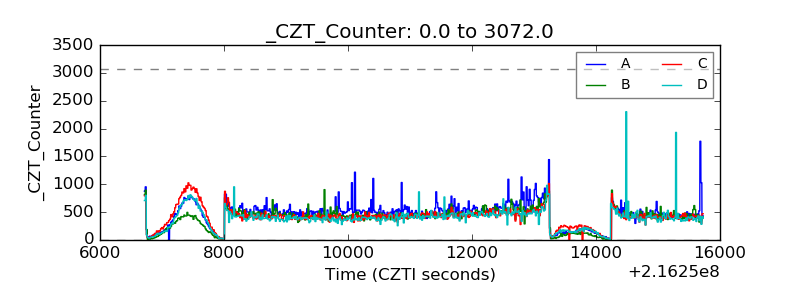 |
| +2.5 Volts monitor |  |
| +5 Volts monitor |  |
| _ROLL_ROT | 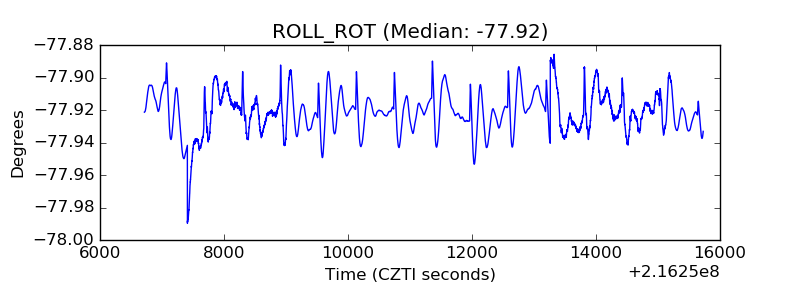 |
| _Roll_DEC |  |
| _Roll_RA | 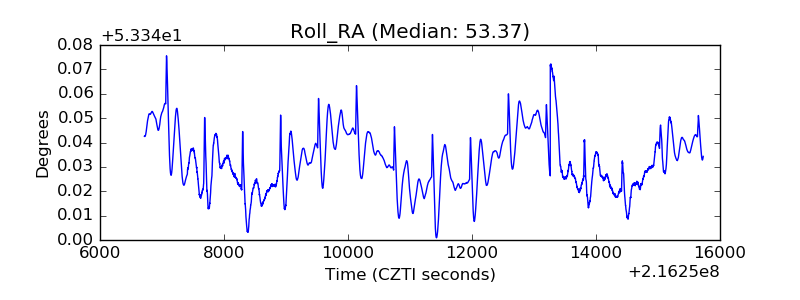 |
| Veto Counter | 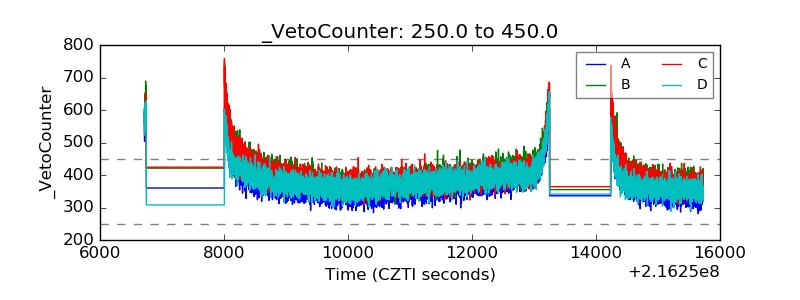 |