| Param | Original file | Final file |
|---|---|---|
| Filename | modeM0/AS1A02_006T01_9000000776_06024cztM0_level2.evt | modeM0/AS1A02_006T01_9000000776_06024cztM0_level2_quad_clean.evt |
| Size (bytes) | 479,096,640 | 99,924,480 |
| Size | 456.9 MB | 95.3 MB |
| Events in quadrant A | 4,006,803 | 627,404 |
| Events in quadrant B | 3,575,777 | 649,721 |
| Events in quadrant C | 3,265,901 | 633,118 |
| Events in quadrant D | 3,166,014 | 609,684 |
| Mode M9 | |||
|---|---|---|---|
| Quadrant | BADHDUFLAG | Total packets | Discarded packets |
| A | 0 | 16 | 1 |
| B | 0 | 16 | 0 |
| C | 0 | 16 | 0 |
| D | 0 | 16 | 0 |
| Mode SS | |||
|---|---|---|---|
| Quadrant | BADHDUFLAG | Total packets | Discarded packets |
| A | 0 | 160 | 12 |
| B | 0 | 160 | 4 |
| C | 0 | 160 | 12 |
| D | 0 | 160 | 10 |
| Mode M0 | |||
|---|---|---|---|
| Quadrant | BADHDUFLAG | Total packets | Discarded packets |
| A | 0 | 18068 | 1523 |
| B | 0 | 16870 | 1448 |
| C | 0 | 16081 | 1188 |
| D | 0 | 16110 | 1184 |
| Quadrant | Total seconds | Saturated seconds | Saturation percentage |
|---|---|---|---|
| A | 7222 | 87 | 1.204652% |
| B | 7237 | 104 | 1.437060% |
| C | 7274 | 59 | 0.811108% |
| D | 7282 | 39 | 0.535567% |
Noise dominated data is calculated using 1-second bins in cleaned event files. If a bin has >2000 counts, and if more than 50% of those come from <1% of pixels, then it is considered to be noise-dominated and hence unusable.
| Quadrant | # 1 sec bins | Bins with >0 counts | Bins with >2000 counts | High rate bins dominated by noise | Noise dominated (total time) | Noise dominated (detector-on time) | Marked lightcurve |
|---|---|---|---|---|---|---|---|
| A | 9370 | 7772 | 14 | 14 | 0.15% | 0.18% | 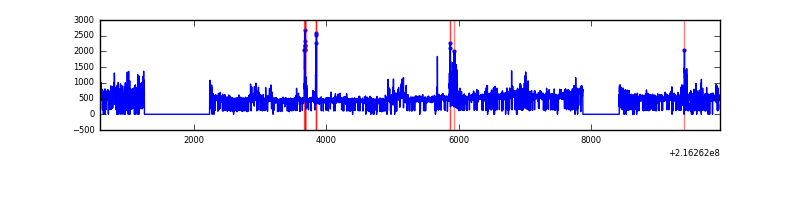 |
| B | 9370 | 7756 | 23 | 23 | 0.25% | 0.30% | 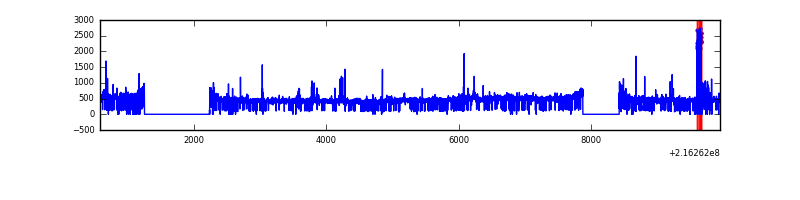 |
| C | 9370 | 7791 | 2 | 2 | 0.02% | 0.03% | 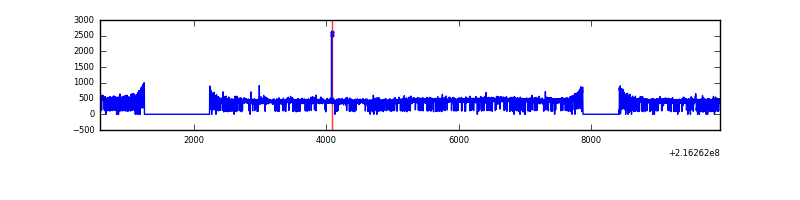 |
| D | 9370 | 7771 | 2 | 2 | 0.02% | 0.03% | 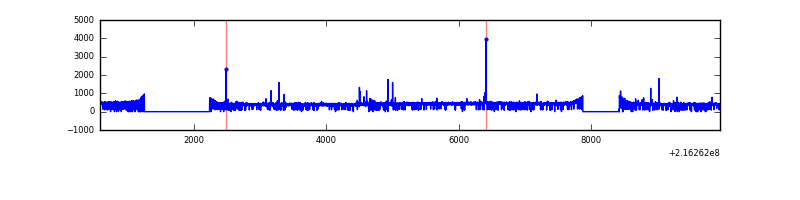 |
Top three noisy pixels from each quadrant. If the there are fewer than three noisy pixels in the level2.evt file, extra rows are filled as -1
| Pixel properties | Quadrant properties | ||||||
|---|---|---|---|---|---|---|---|
| Quadrant | DetID | PixID | Counts | Sigma | Mean | Median | Sigma |
| A | 13 | 34 | 735598 | 4298.47 | 834 | 815 | 170.9 |
| A | 15 | 234 | 55709 | 321.13 | 834 | 815 | 170.9 |
| A | 12 | 194 | 7908 | 41.49 | 834 | 815 | 170.9 |
| B | 3 | 64 | 148767 | 900.94 | 852 | 830 | 164.2 |
| B | 15 | 204 | 81642 | 492.15 | 852 | 830 | 164.2 |
| B | 12 | 111 | 16697 | 96.63 | 852 | 830 | 164.2 |
| C | 1 | 16 | 12339 | 59.36 | 828 | 832 | 193.9 |
| C | 8 | 208 | 9955 | 47.06 | 828 | 832 | 193.9 |
| C | 9 | 54 | 7893 | 36.42 | 828 | 832 | 193.9 |
| D | 2 | 206 | 29974 | 144.88 | 823 | 796 | 201.4 |
| D | 5 | 97 | 19794 | 94.33 | 823 | 796 | 201.4 |
| D | 8 | 195 | 18382 | 87.32 | 823 | 796 | 201.4 |
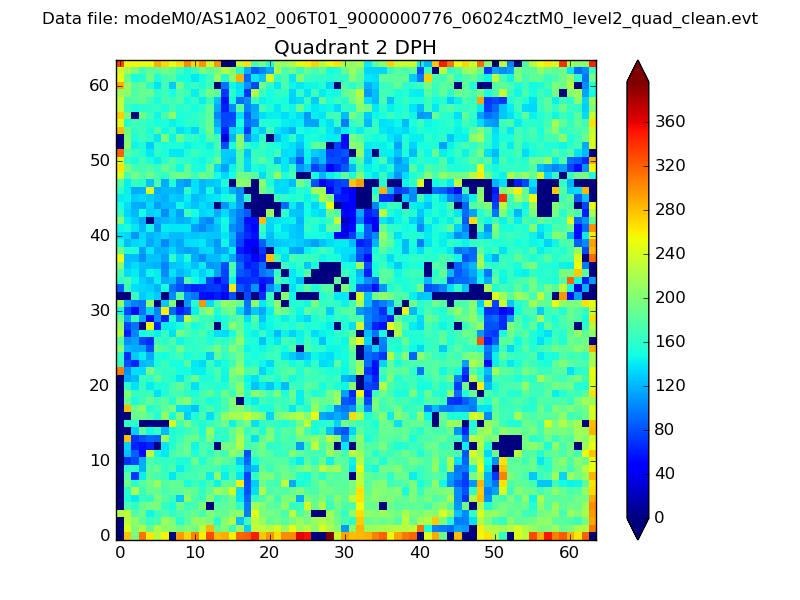
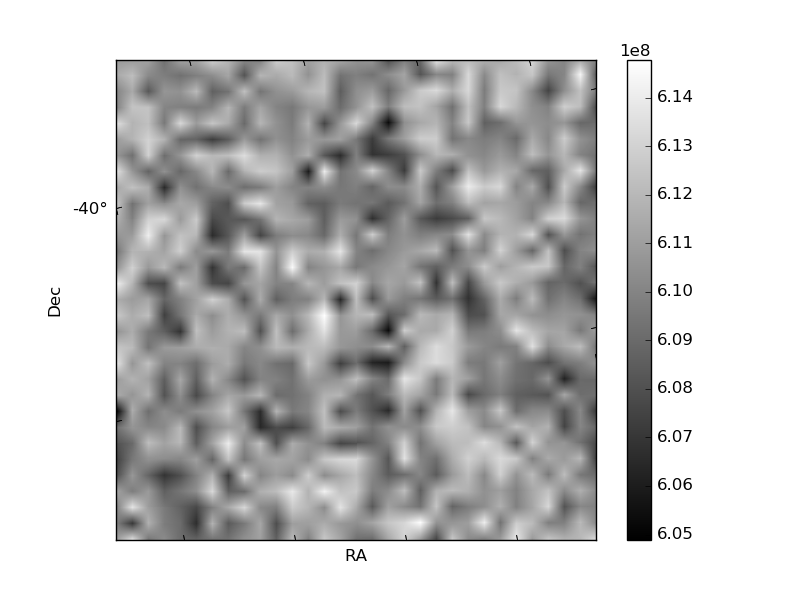
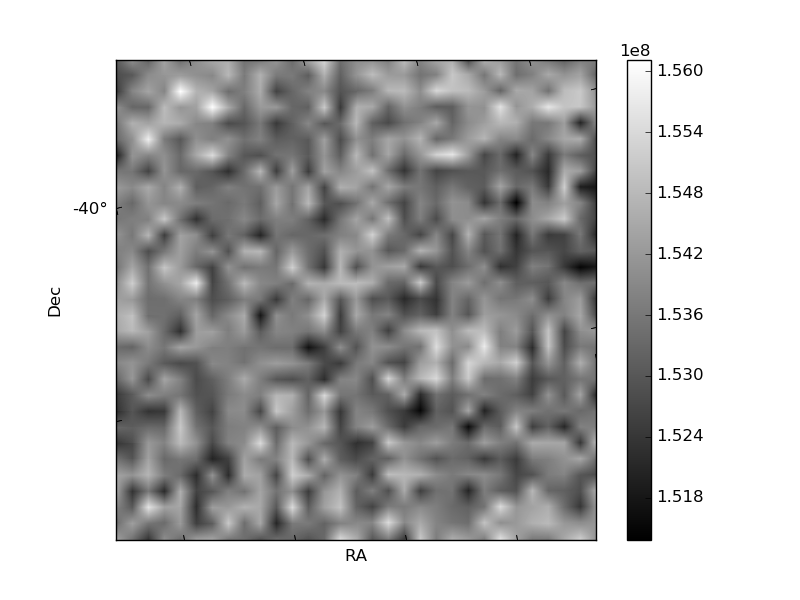
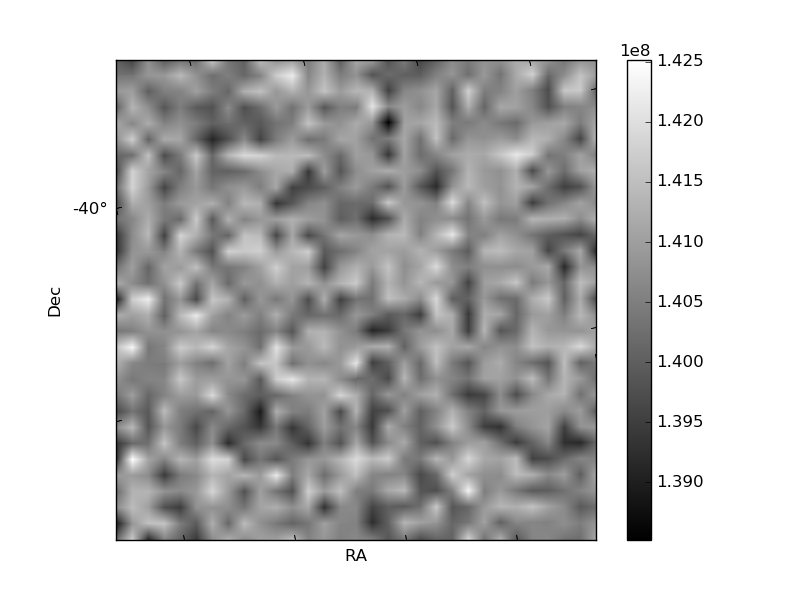
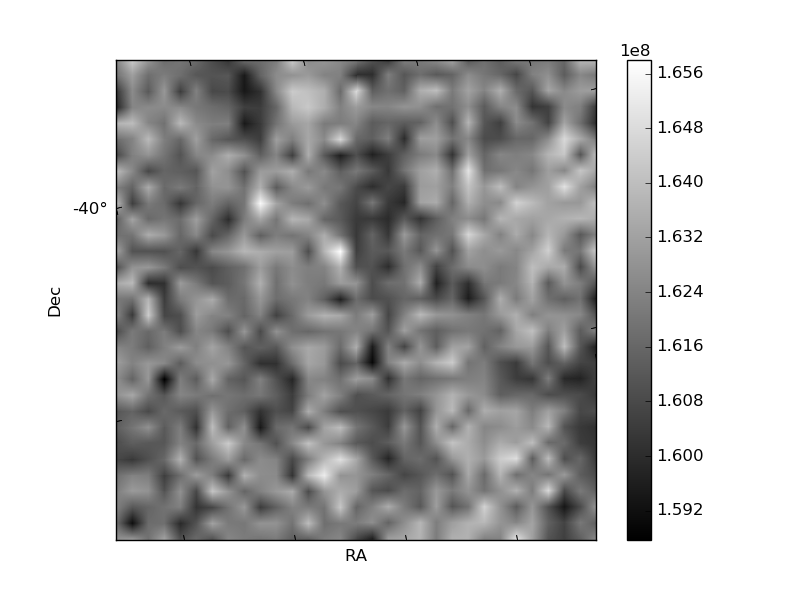
Histogram calculated using DETX and DETY for each event in the final _common_clean file
| Quadrant A | 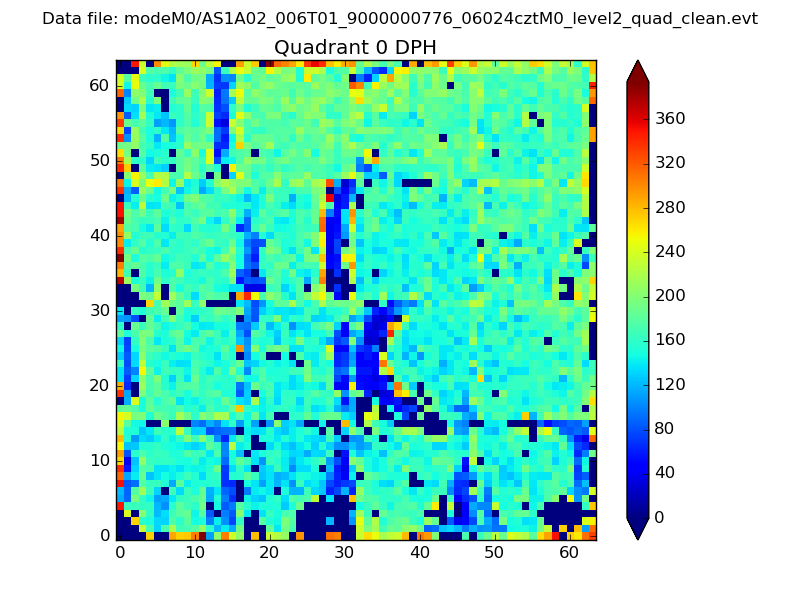 |
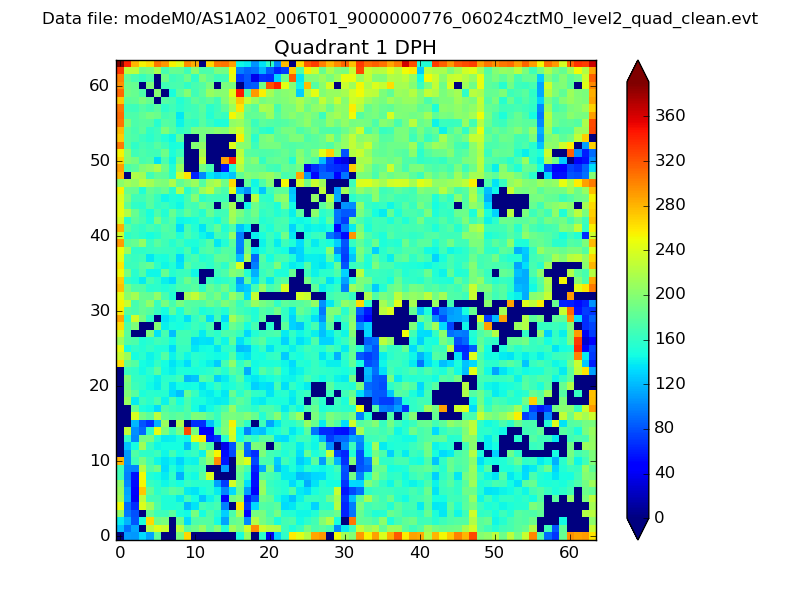 |
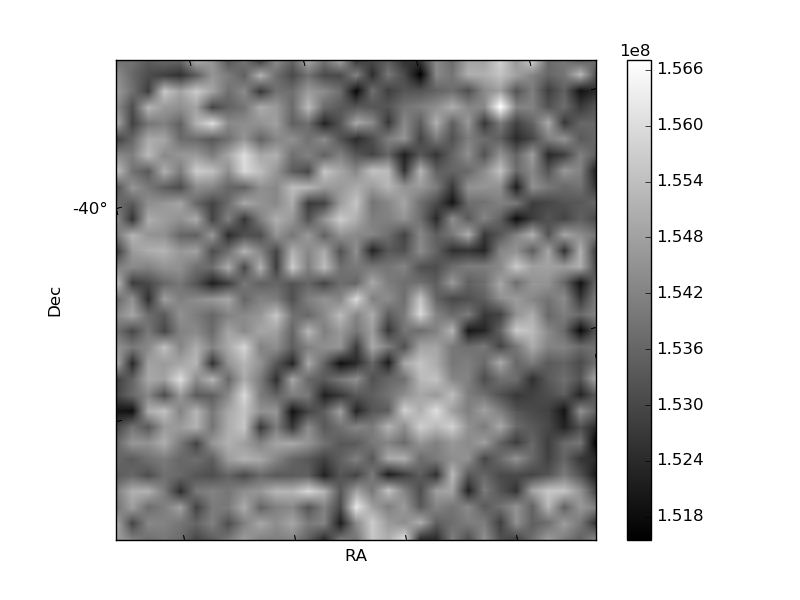
Quadrant B |
|---|---|---|---|
| Quadrant D | 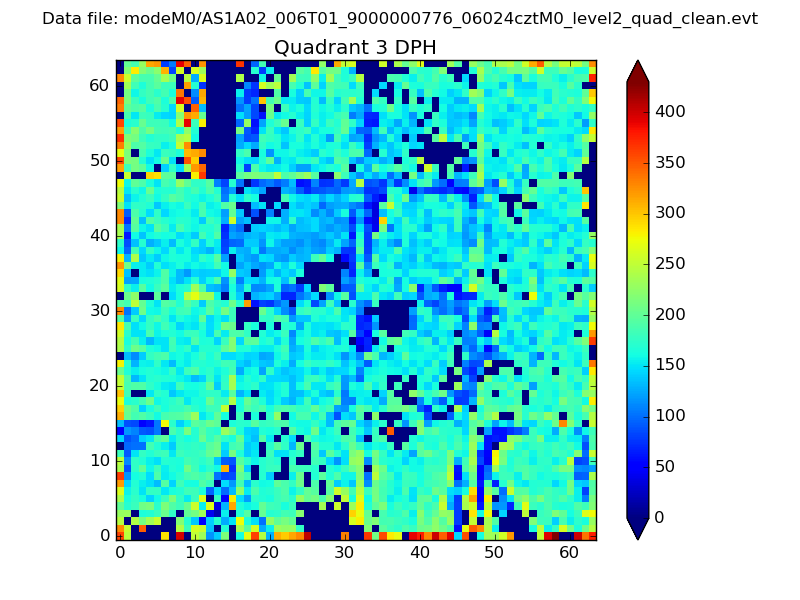 |
 |
Quadrant C |
| Plot type | Count rate plots | Images |
|---|---|---|
| Comparison with Poisson distribution Blue bars denote a histogram of data divided into 1 sec bins. Red curve is a Poisson curve with rate = median count rate of data. |
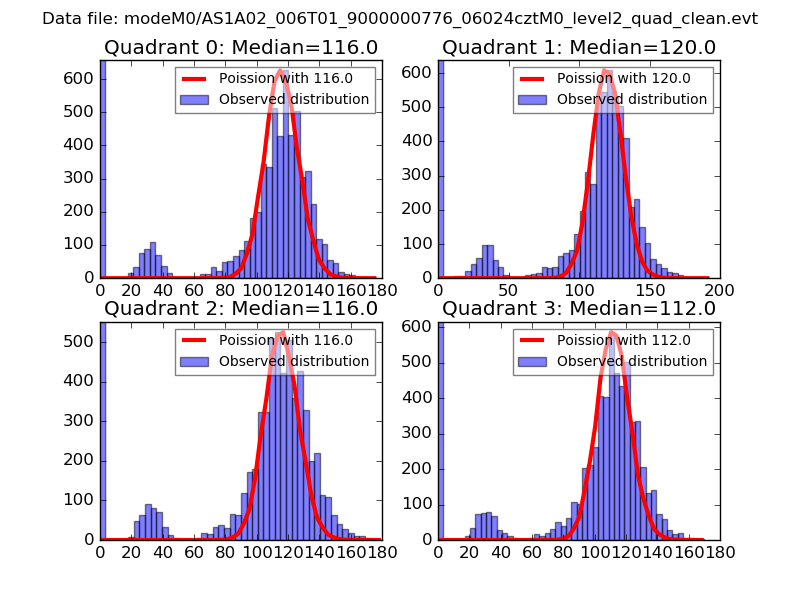 |
 |
| Quadrant-wise count rates Data is divided into 100 sec bins |
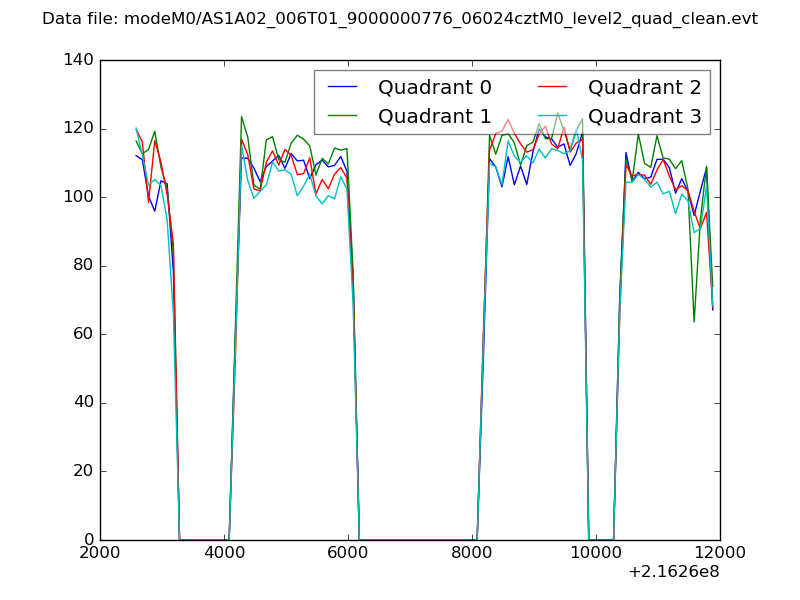 |
|
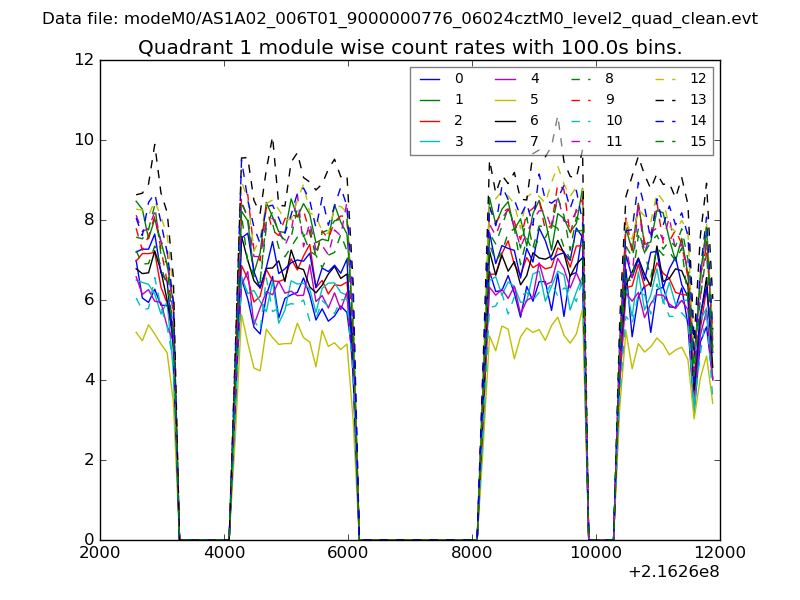
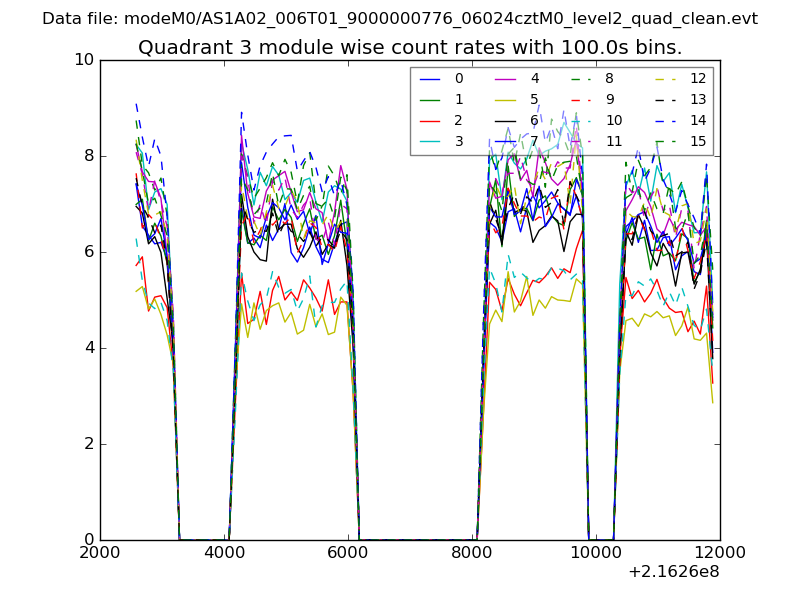
| Module-wise count rates for Quadrant A Data is divided into 100 sec bins |
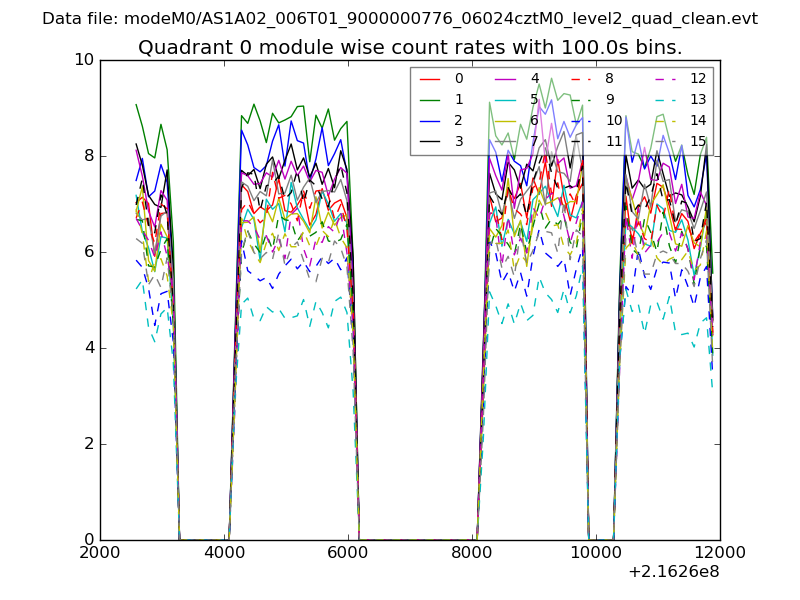 |
 |
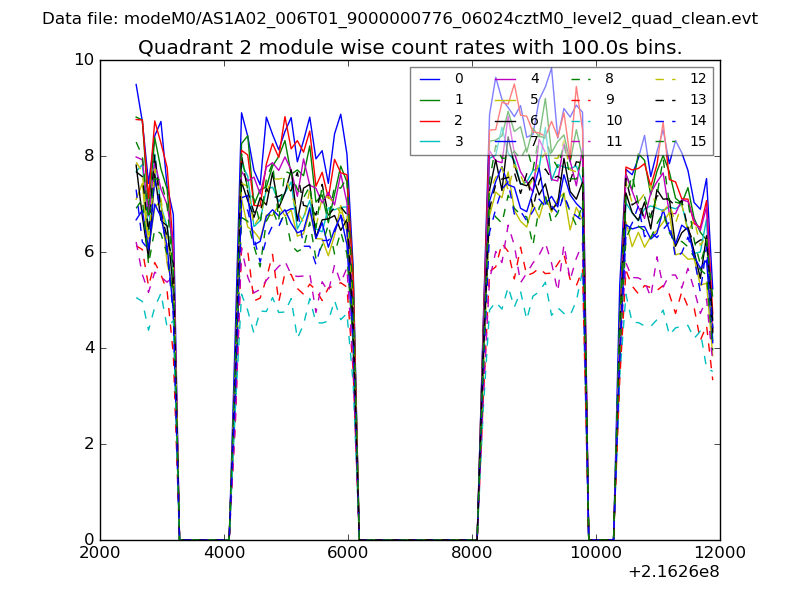
| Module-wise count rates for Quadrant B Data is divided into 100 sec bins |
 |
 |
| Module-wise count rates for Quadrant C Data is divided into 100 sec bins |
 |
 |
| Module-wise count rates for Quadrant D Data is divided into 100 sec bins |
 |
 |
| Parameter | Plot |
|---|---|
| CZT HV Monitor | 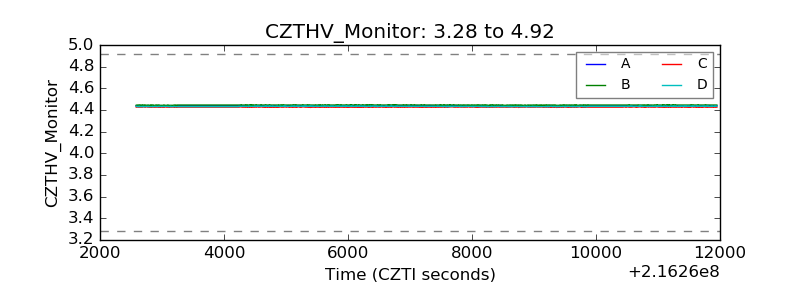 |
| D_VDD | 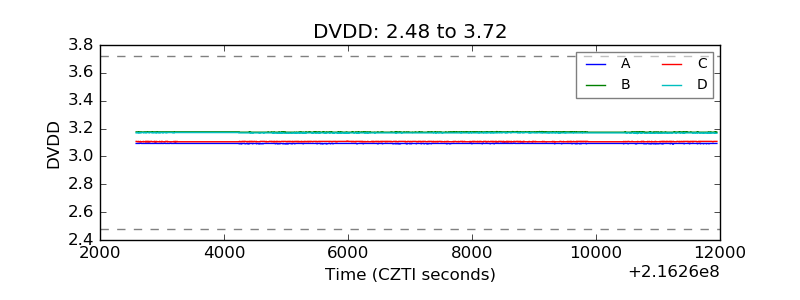 |
| Temperature 1 | 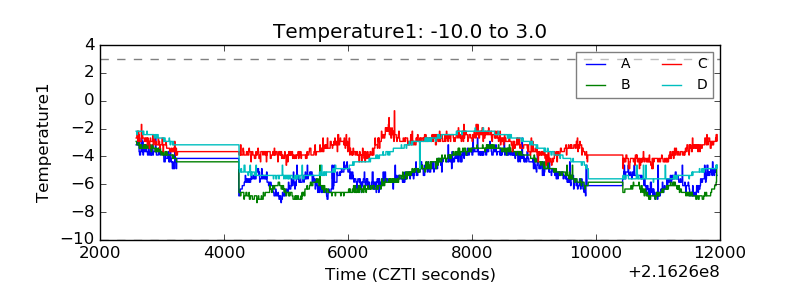 |
| Veto HV Monitor | 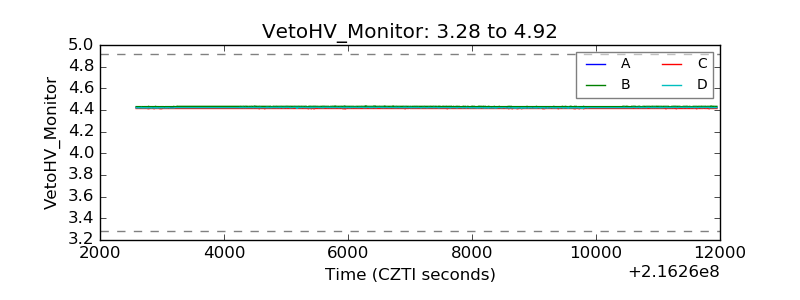 |
| Veto LLD | 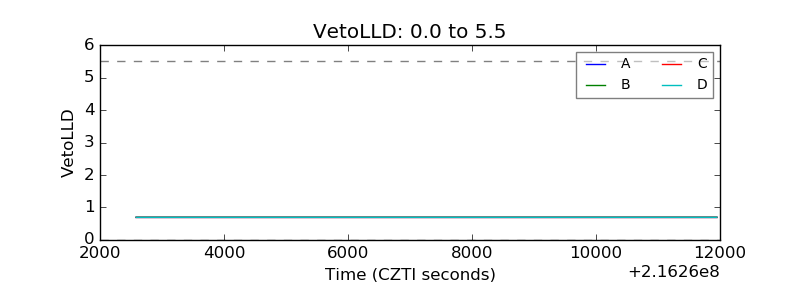 |
| Alpha Counter | 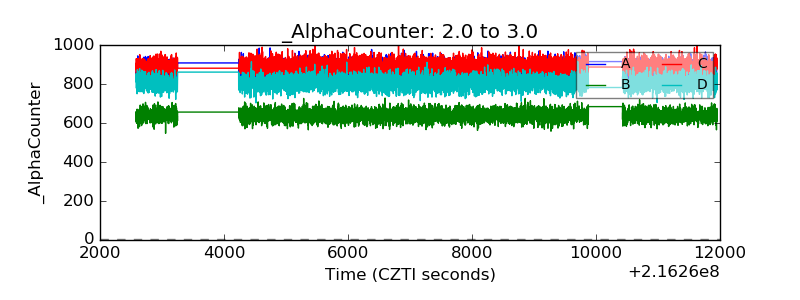 |
| _CPM_Rate | 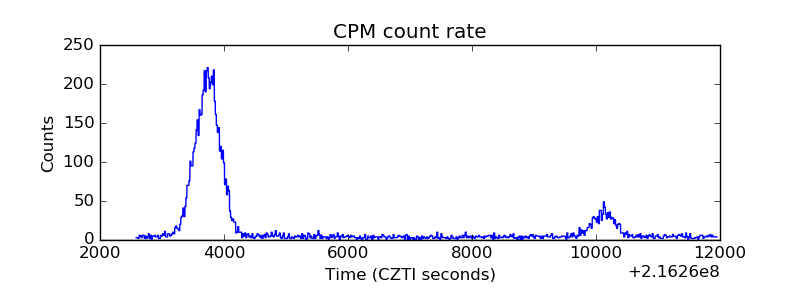 |
| CZT Counter | 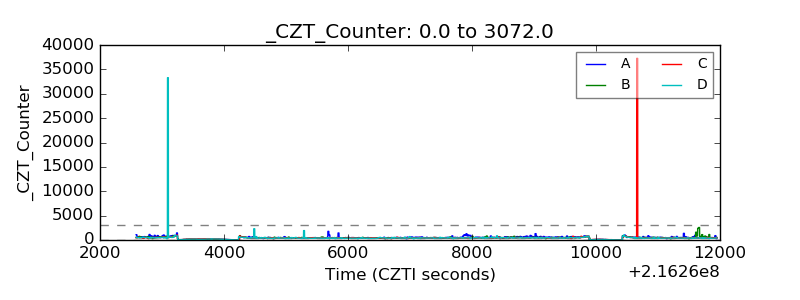 |
| +2.5 Volts monitor |  |
| +5 Volts monitor | 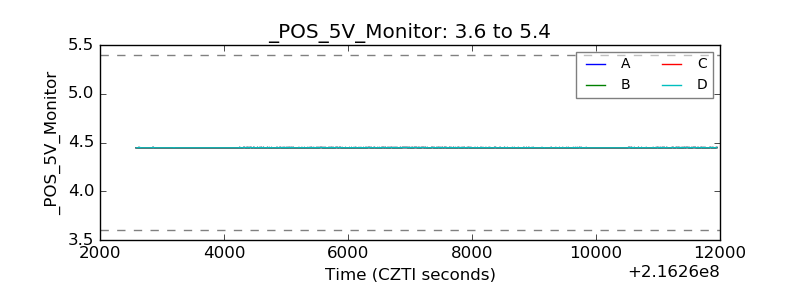 |
| _ROLL_ROT | 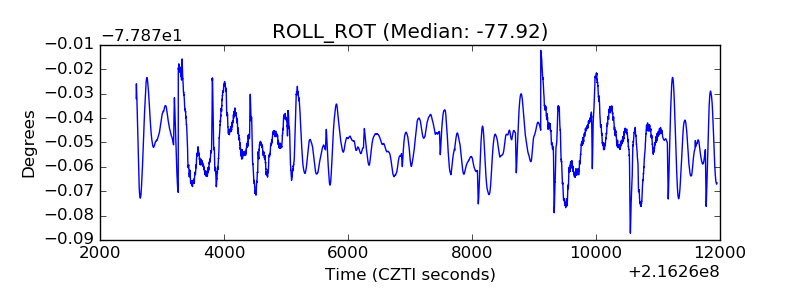 |
| _Roll_DEC | 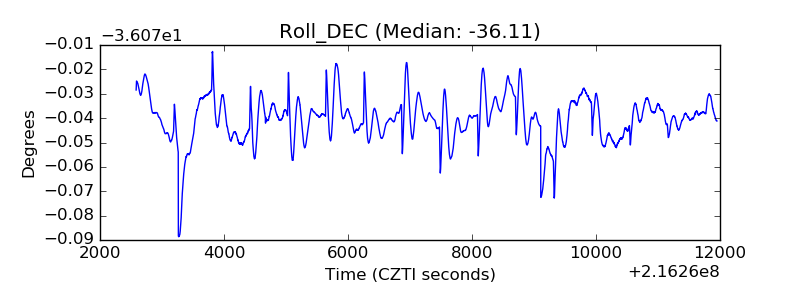 |
| _Roll_RA | 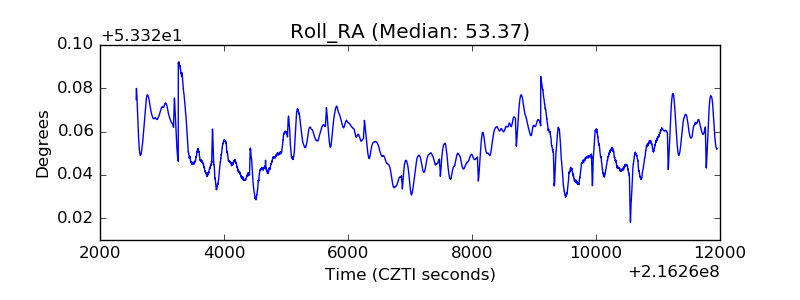 |
| Veto Counter | 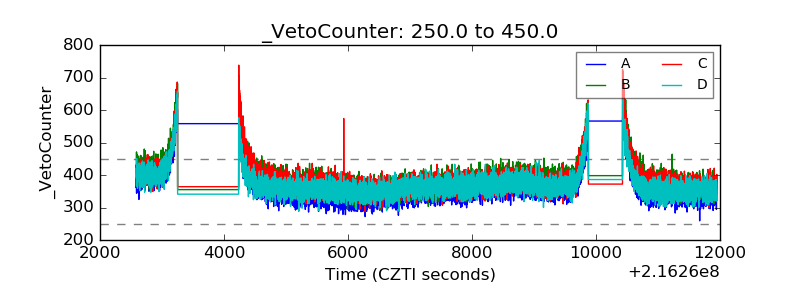 |