| Param | Original file | Final file |
|---|---|---|
| Filename | modeM0/AS1A02_006T01_9000000776_06030cztM0_level2.evt | modeM0/AS1A02_006T01_9000000776_06030cztM0_level2_quad_clean.evt |
| Size (bytes) | 1,451,453,760 | 264,453,120 |
| Size | 1.4 GB | 252.2 MB |
| Events in quadrant A | 12,253,967 | 1,624,956 |
| Events in quadrant B | 10,950,924 | 1,678,604 |
| Events in quadrant C | 9,640,953 | 1,646,532 |
| Events in quadrant D | 9,667,579 | 1,590,744 |
| Mode M9 | |||
|---|---|---|---|
| Quadrant | BADHDUFLAG | Total packets | Discarded packets |
| A | 0 | 10 | 0 |
| B | 0 | 9 | 0 |
| C | 0 | 9 | 0 |
| D | 0 | 9 | 0 |
| Mode SS | |||
|---|---|---|---|
| Quadrant | BADHDUFLAG | Total packets | Discarded packets |
| A | 0 | 480 | 53 |
| B | 0 | 482 | 48 |
| C | 0 | 481 | 55 |
| D | 0 | 480 | 51 |
| Mode M0 | |||
|---|---|---|---|
| Quadrant | BADHDUFLAG | Total packets | Discarded packets |
| A | 0 | 56768 | 6856 |
| B | 0 | 52103 | 5524 |
| C | 0 | 49474 | 5156 |
| D | 0 | 50152 | 5192 |
| Quadrant | Total seconds | Saturated seconds | Saturation percentage |
|---|---|---|---|
| A | 21129 | 719 | 3.402906% |
| B | 21349 | 778 | 3.644199% |
| C | 21362 | 580 | 2.715102% |
| D | 21385 | 577 | 2.698153% |
Noise dominated data is calculated using 1-second bins in cleaned event files. If a bin has >2000 counts, and if more than 50% of those come from <1% of pixels, then it is considered to be noise-dominated and hence unusable.
| Quadrant | # 1 sec bins | Bins with >0 counts | Bins with >2000 counts | High rate bins dominated by noise | Noise dominated (total time) | Noise dominated (detector-on time) | Marked lightcurve |
|---|---|---|---|---|---|---|---|
| A | 24595 | 22503 | 38 | 38 | 0.15% | 0.17% | 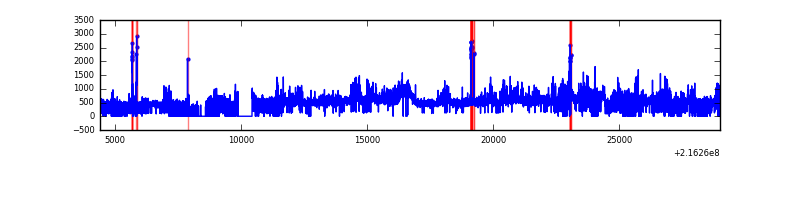 |
| B | 24595 | 22689 | 73 | 73 | 0.30% | 0.32% | 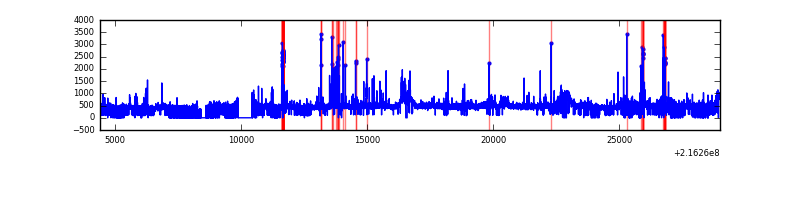 |
| C | 24595 | 22722 | 2 | 2 | 0.01% | 0.01% | 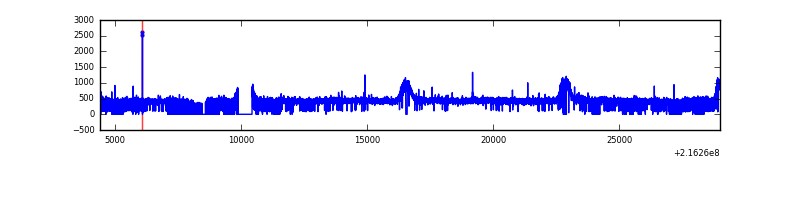 |
| D | 24595 | 22674 | 14 | 14 | 0.06% | 0.06% | 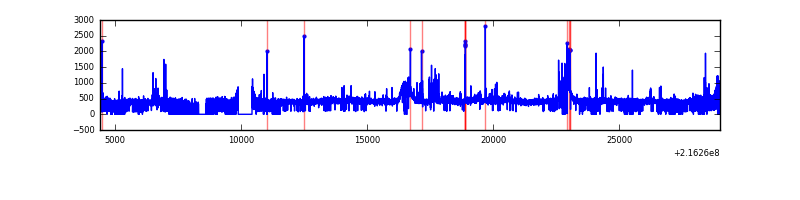 |
Top three noisy pixels from each quadrant. If the there are fewer than three noisy pixels in the level2.evt file, extra rows are filled as -1
| Pixel properties | Quadrant properties | ||||||
|---|---|---|---|---|---|---|---|
| Quadrant | DetID | PixID | Counts | Sigma | Mean | Median | Sigma |
| A | 13 | 34 | 2386197 | 4760.62 | 2445 | 2386 | 500.7 |
| A | 15 | 234 | 434607 | 863.17 | 2445 | 2386 | 500.7 |
| A | 13 | 251 | 23521 | 42.21 | 2445 | 2386 | 500.7 |
| B | 15 | 204 | 576778 | 1187.43 | 2503 | 2439 | 483.7 |
| B | 3 | 64 | 483652 | 994.9 | 2503 | 2439 | 483.7 |
| B | 12 | 111 | 50334 | 99.02 | 2503 | 2439 | 483.7 |
| C | 1 | 241 | 23203 | 36.46 | 2443 | 2450 | 569.1 |
| C | 8 | 128 | 19966 | 30.78 | 2443 | 2450 | 569.1 |
| C | 13 | 61 | 19319 | 29.64 | 2443 | 2450 | 569.1 |
| D | 2 | 63 | 147056 | 243.92 | 2432 | 2360 | 593.2 |
| D | 8 | 195 | 83011 | 135.96 | 2432 | 2360 | 593.2 |
| D | 5 | 97 | 72726 | 118.62 | 2432 | 2360 | 593.2 |
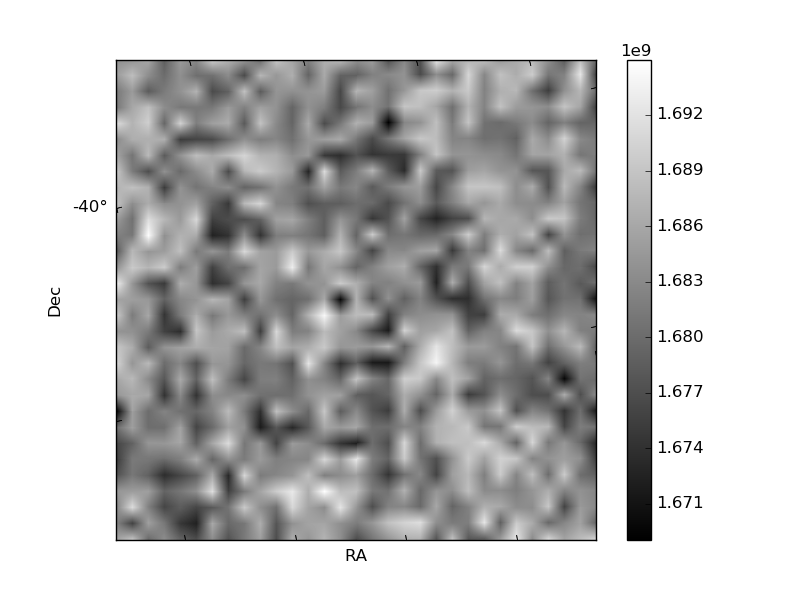
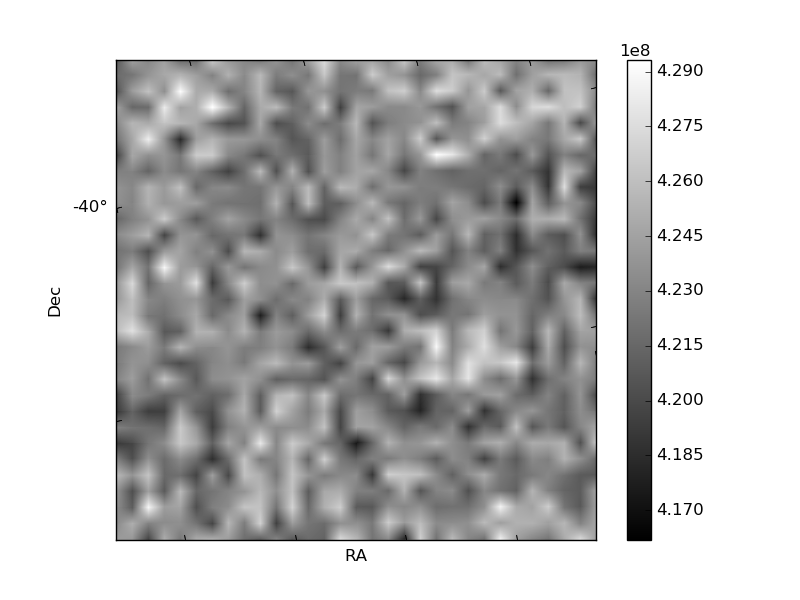
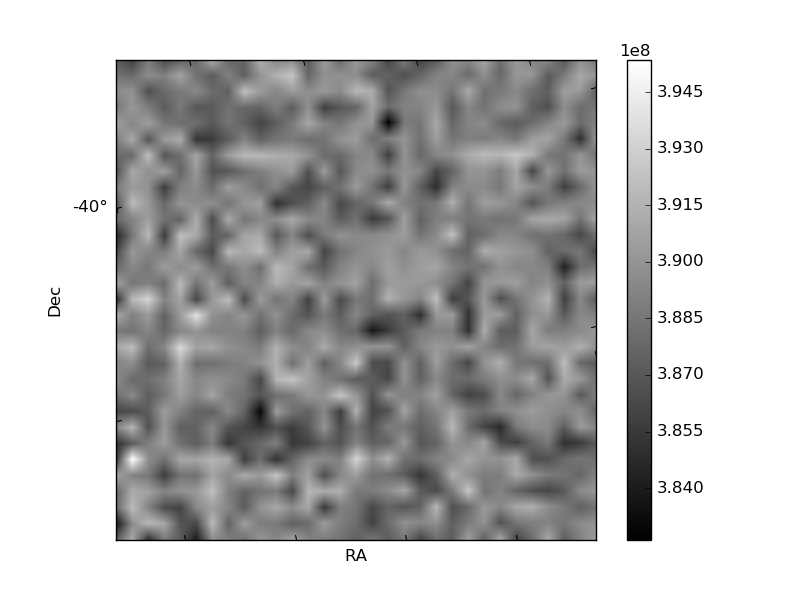
Histogram calculated using DETX and DETY for each event in the final _common_clean file
| Quadrant A | 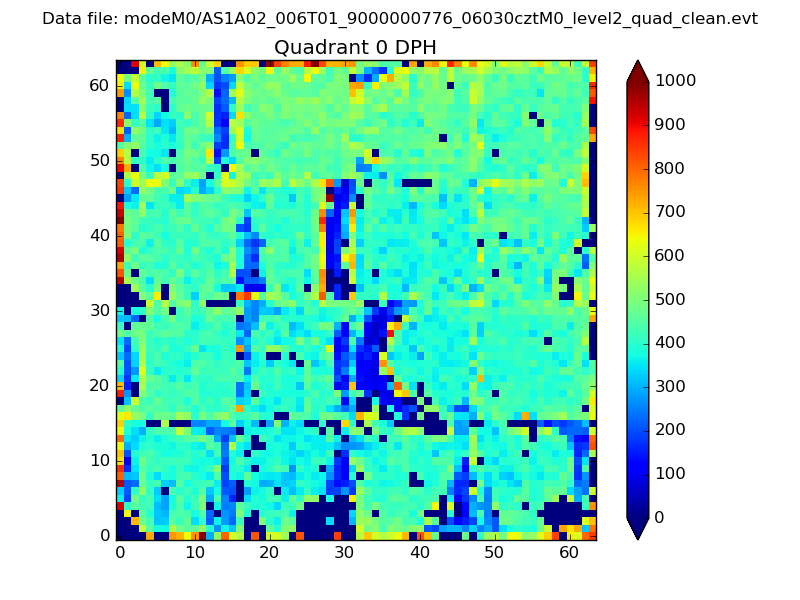 |
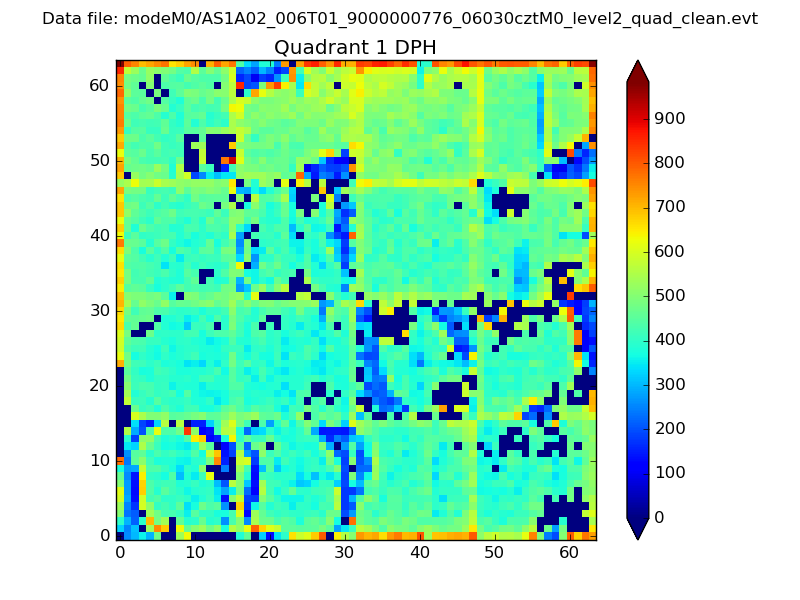 |
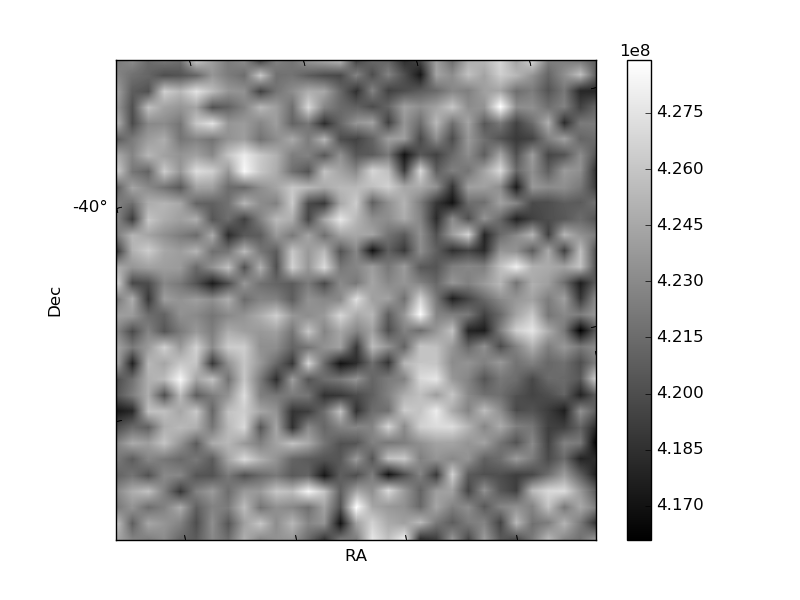
Quadrant B |
|---|---|---|---|
| Quadrant D | 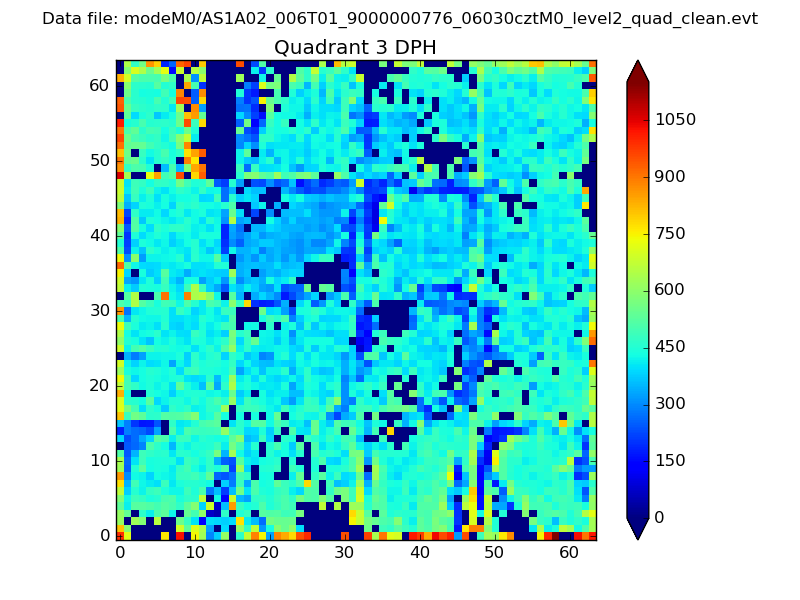 |
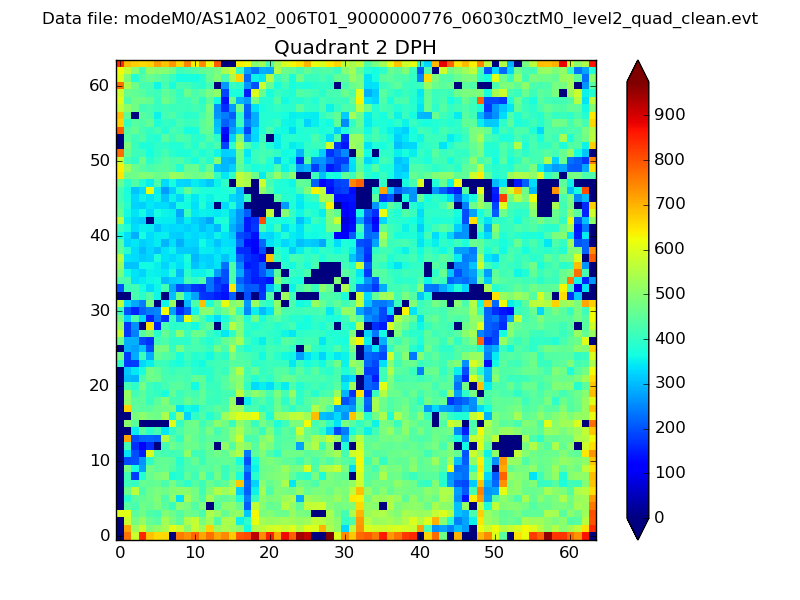 |
Quadrant C |
| Plot type | Count rate plots | Images |
|---|---|---|
| Comparison with Poisson distribution Blue bars denote a histogram of data divided into 1 sec bins. Red curve is a Poisson curve with rate = median count rate of data. |
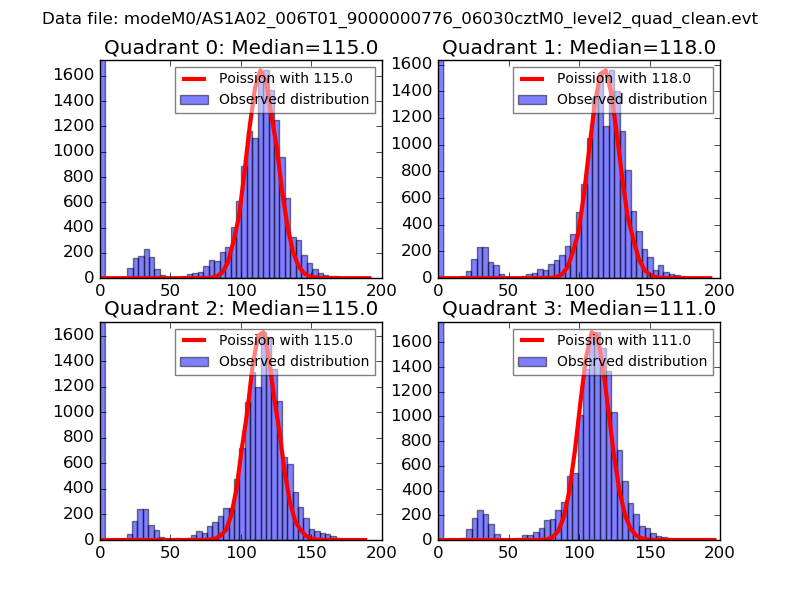 |
 |
| Quadrant-wise count rates Data is divided into 100 sec bins |
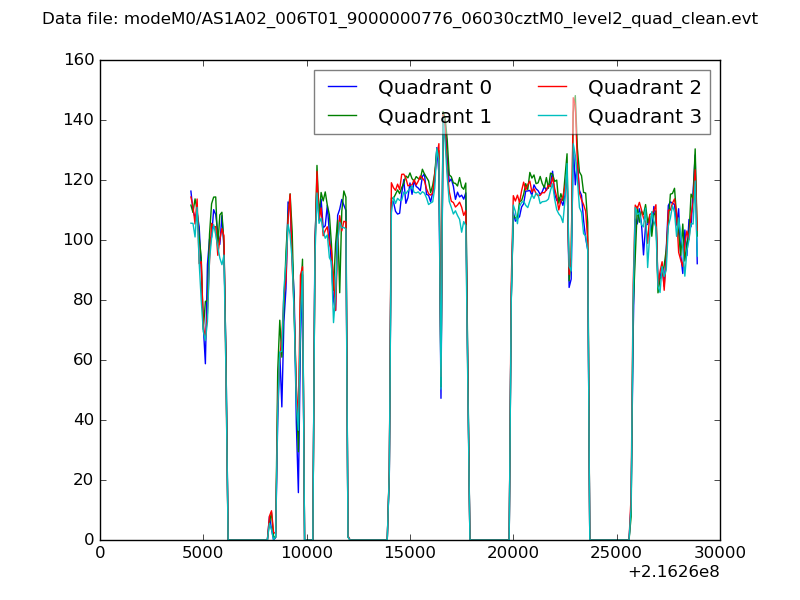 |
|
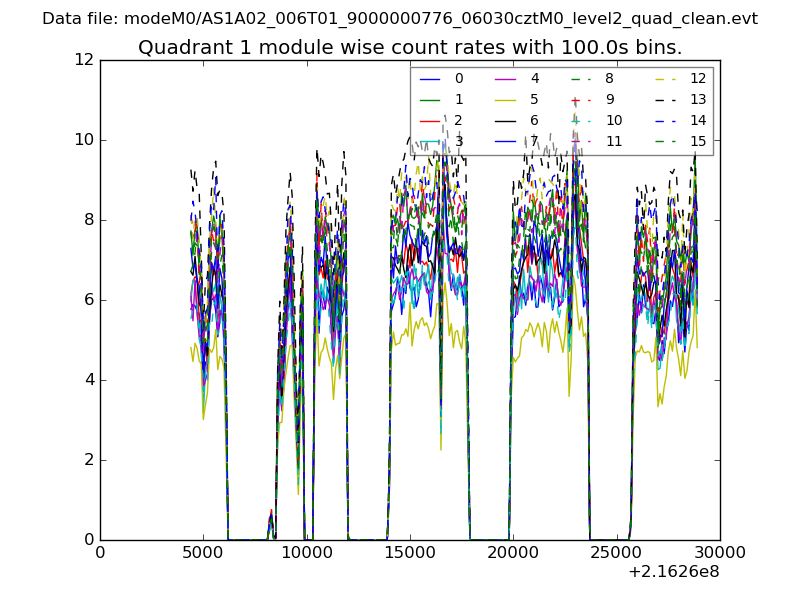
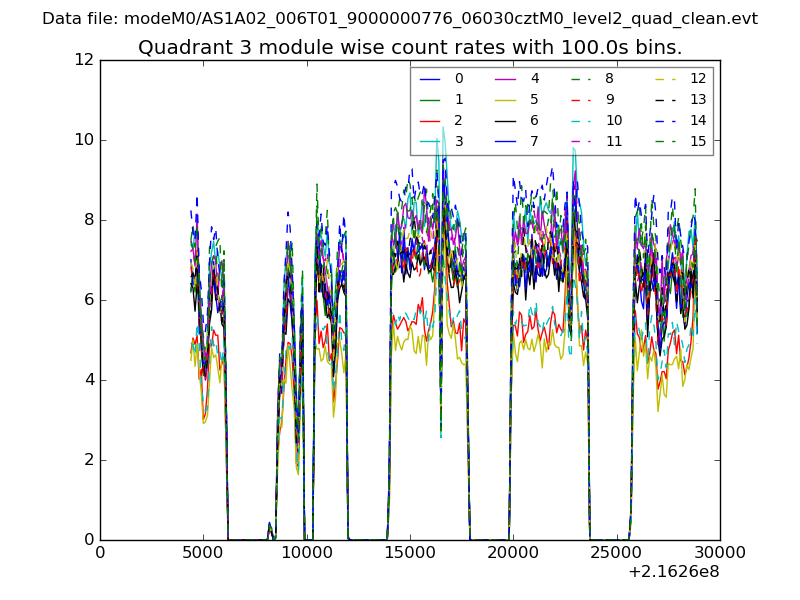
| Module-wise count rates for Quadrant A Data is divided into 100 sec bins |
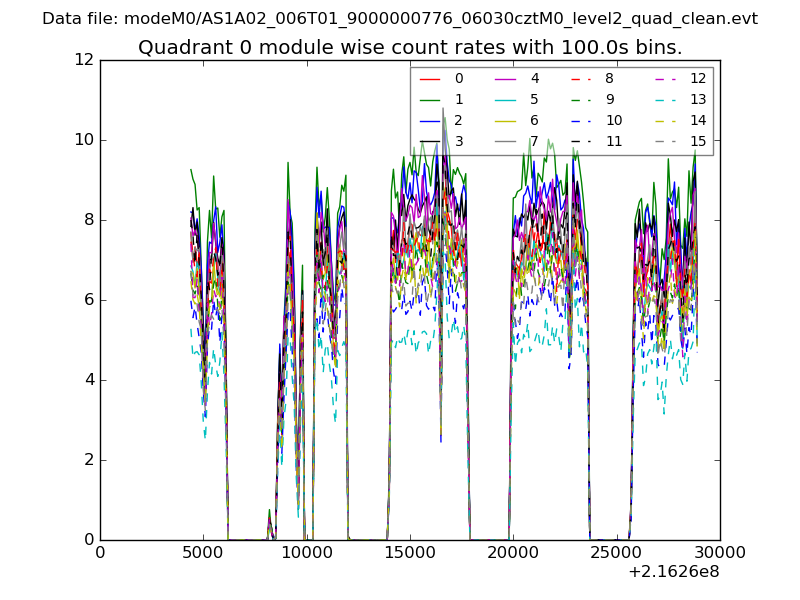 |
 |
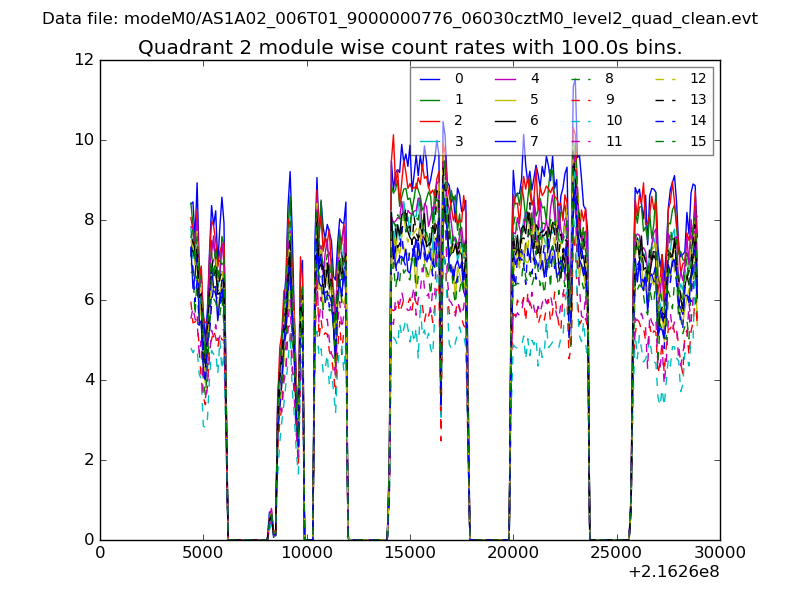
| Module-wise count rates for Quadrant B Data is divided into 100 sec bins |
 |
 |
| Module-wise count rates for Quadrant C Data is divided into 100 sec bins |
 |
 |
| Module-wise count rates for Quadrant D Data is divided into 100 sec bins |
 |
 |
| Parameter | Plot |
|---|---|
| CZT HV Monitor | 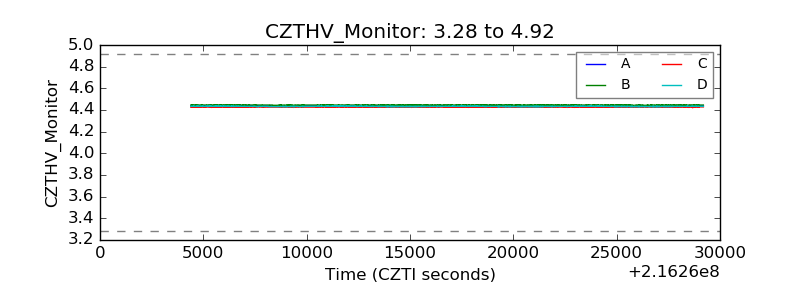 |
| D_VDD | 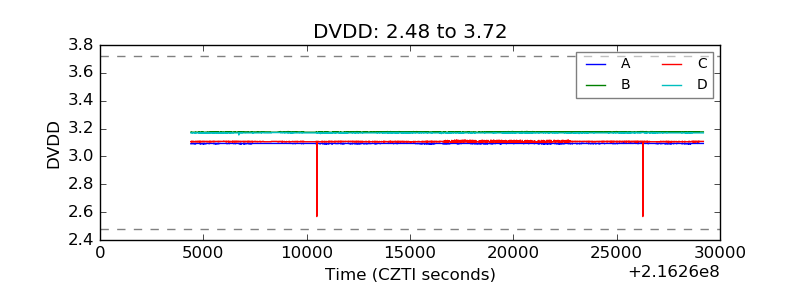 |
| Temperature 1 | 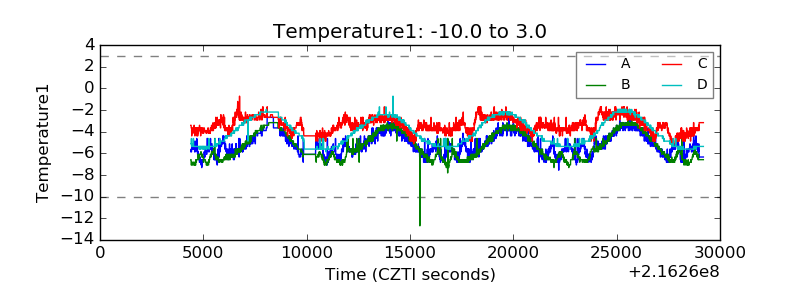 |
| Veto HV Monitor | 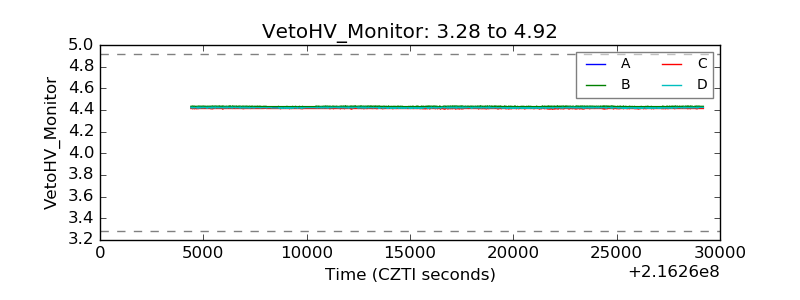 |
| Veto LLD | 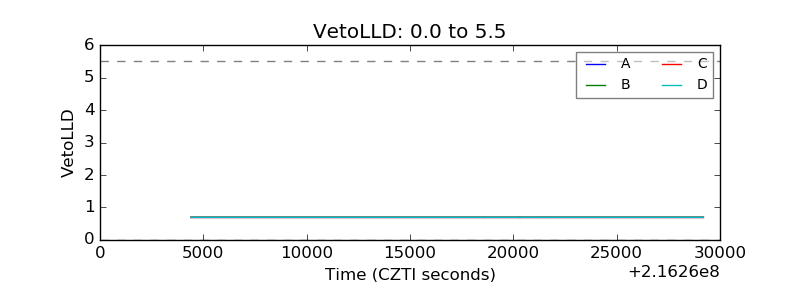 |
| Alpha Counter | 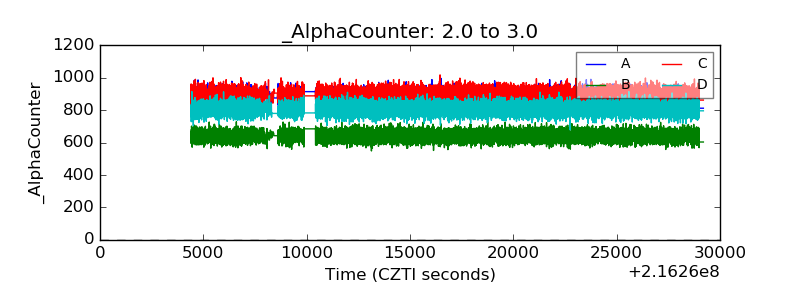 |
| _CPM_Rate | 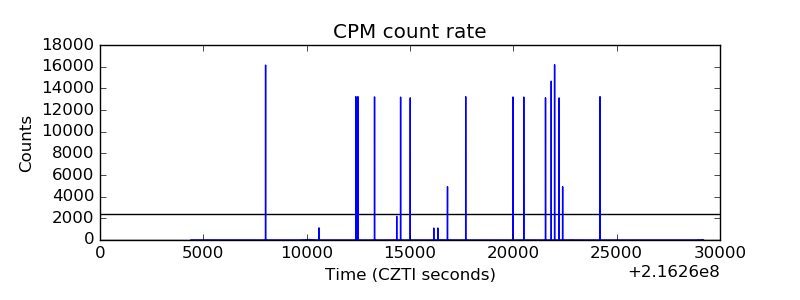 |
| CZT Counter | 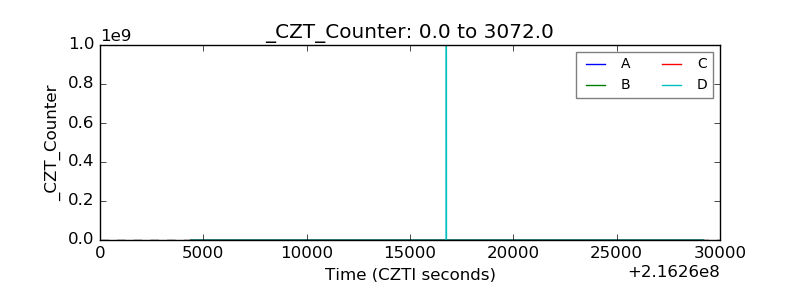 |
| +2.5 Volts monitor |  |
| +5 Volts monitor |  |
| _ROLL_ROT | 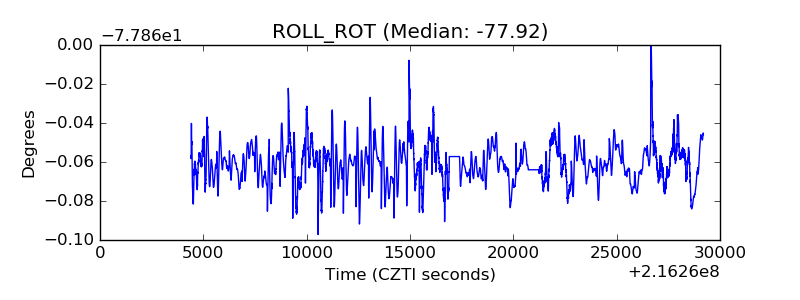 |
| _Roll_DEC | 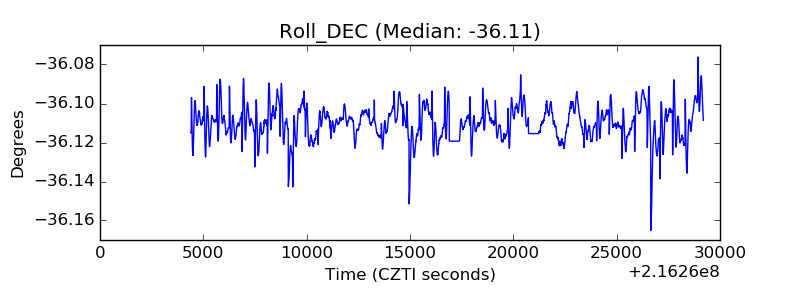 |
| _Roll_RA | 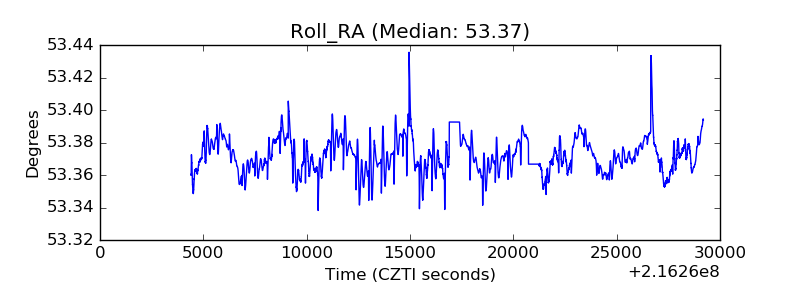 |
| Veto Counter | 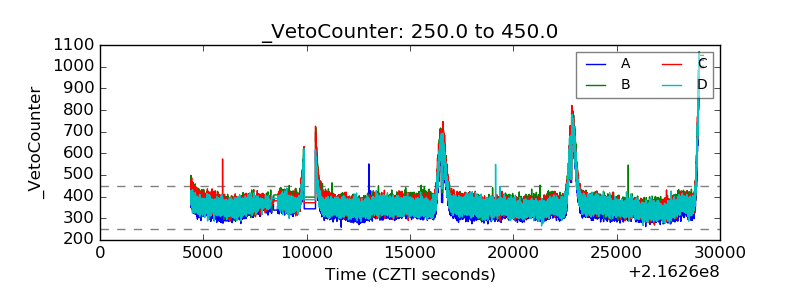 |