| Param | Original file | Final file |
|---|---|---|
| Filename | modeM0/AS1A02_006T01_9000000776_06034cztM0_level2.evt | modeM0/AS1A02_006T01_9000000776_06034cztM0_level2_quad_clean.evt |
| Size (bytes) | 873,838,080 | 151,413,120 |
| Size | 833.4 MB | 144.4 MB |
| Events in quadrant A | 7,479,116 | 933,494 |
| Events in quadrant B | 6,465,793 | 952,861 |
| Events in quadrant C | 5,553,661 | 940,619 |
| Events in quadrant D | 6,138,267 | 913,268 |
| Mode M9 | |||
|---|---|---|---|
| Quadrant | BADHDUFLAG | Total packets | Discarded packets |
| A | 0 | 5 | 0 |
| B | 0 | 5 | 0 |
| C | 0 | 5 | 0 |
| D | 0 | 5 | 0 |
| Mode SS | |||
|---|---|---|---|
| Quadrant | BADHDUFLAG | Total packets | Discarded packets |
| A | 0 | 246 | 0 |
| B | 0 | 246 | 0 |
| C | 0 | 246 | 0 |
| D | 0 | 246 | 0 |
| Mode M0 | |||
|---|---|---|---|
| Quadrant | BADHDUFLAG | Total packets | Discarded packets |
| A | 0 | 29909 | 2 |
| B | 0 | 27143 | 2 |
| C | 0 | 25550 | 4 |
| D | 0 | 27477 | 2 |
| Quadrant | Total seconds | Saturated seconds | Saturation percentage |
|---|---|---|---|
| A | 12226 | 482 | 3.942418% |
| B | 12226 | 468 | 3.827908% |
| C | 12225 | 340 | 2.781186% |
| D | 12226 | 400 | 3.271716% |
Noise dominated data is calculated using 1-second bins in cleaned event files. If a bin has >2000 counts, and if more than 50% of those come from <1% of pixels, then it is considered to be noise-dominated and hence unusable.
| Quadrant | # 1 sec bins | Bins with >0 counts | Bins with >2000 counts | High rate bins dominated by noise | Noise dominated (total time) | Noise dominated (detector-on time) | Marked lightcurve |
|---|---|---|---|---|---|---|---|
| A | 12616 | 12226 | 24 | 24 | 0.19% | 0.20% | 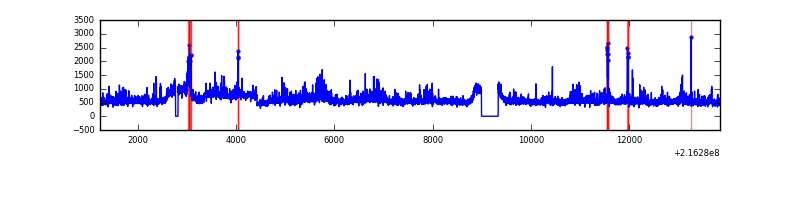 |
| B | 12616 | 12226 | 46 | 46 | 0.36% | 0.38% | 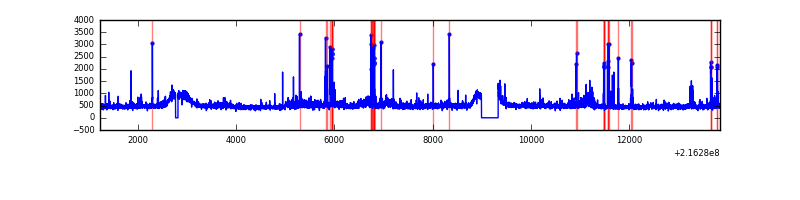 |
| C | 12616 | 12226 | 0 | 0 | 0.00% | 0.00% |  |
| D | 12616 | 12227 | 15 | 15 | 0.12% | 0.12% | 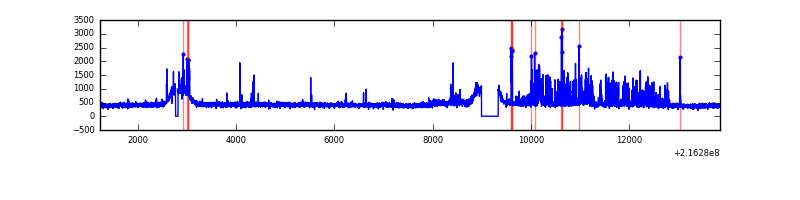 |
Top three noisy pixels from each quadrant. If the there are fewer than three noisy pixels in the level2.evt file, extra rows are filled as -1
| Pixel properties | Quadrant properties | ||||||
|---|---|---|---|---|---|---|---|
| Quadrant | DetID | PixID | Counts | Sigma | Mean | Median | Sigma |
| A | 13 | 34 | 1549942 | 5305.95 | 1422 | 1390 | 291.9 |
| A | 15 | 234 | 384271 | 1311.9 | 1422 | 1390 | 291.9 |
| A | 13 | 251 | 45713 | 151.87 | 1422 | 1390 | 291.9 |
| B | 15 | 204 | 431418 | 1536.47 | 1440 | 1403 | 279.9 |
| B | 3 | 64 | 268540 | 954.5 | 1440 | 1403 | 279.9 |
| B | 15 | 85 | 77201 | 270.83 | 1440 | 1403 | 279.9 |
| C | 1 | 241 | 24706 | 71.1 | 1401 | 1403 | 327.7 |
| C | 8 | 128 | 19004 | 53.7 | 1401 | 1403 | 327.7 |
| C | 9 | 16 | 13478 | 36.84 | 1401 | 1403 | 327.7 |
| D | 12 | 6 | 593115 | 1725.31 | 1395 | 1353 | 343.0 |
| D | 2 | 63 | 69773 | 199.48 | 1395 | 1353 | 343.0 |
| D | 14 | 173 | 63903 | 182.37 | 1395 | 1353 | 343.0 |
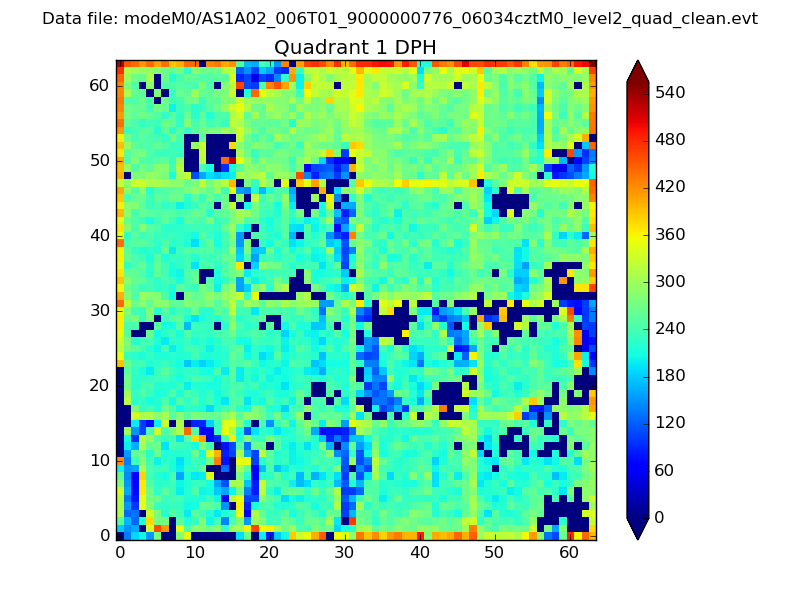
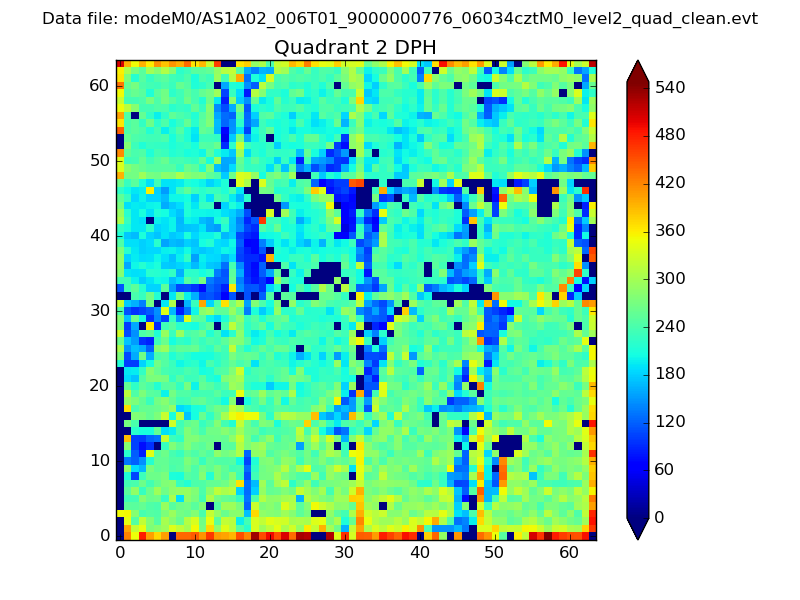
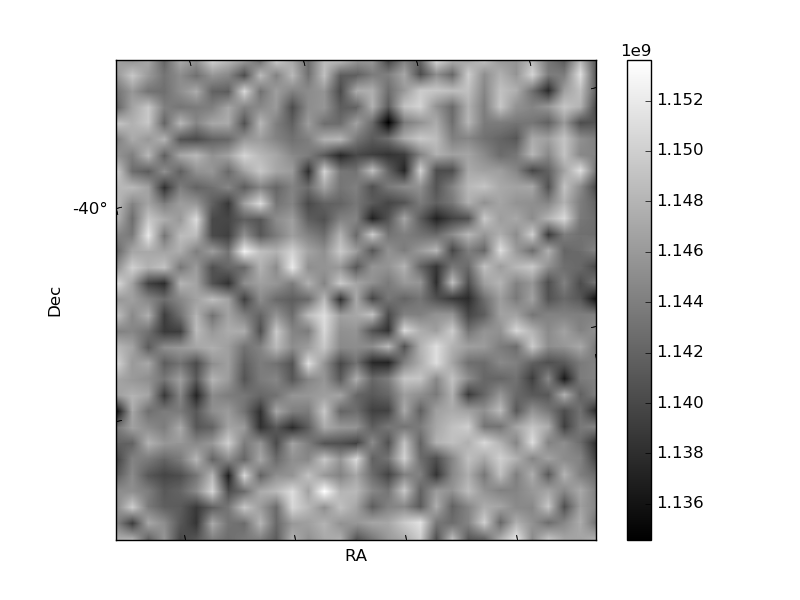
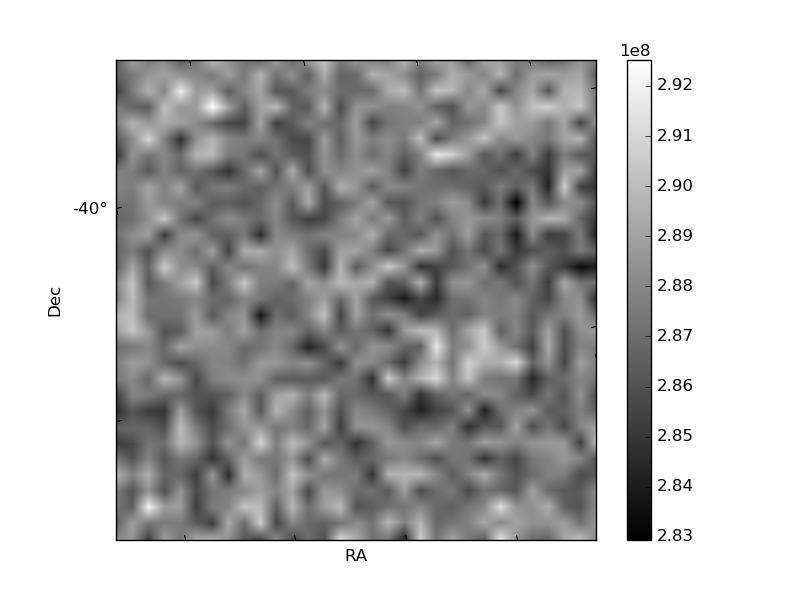
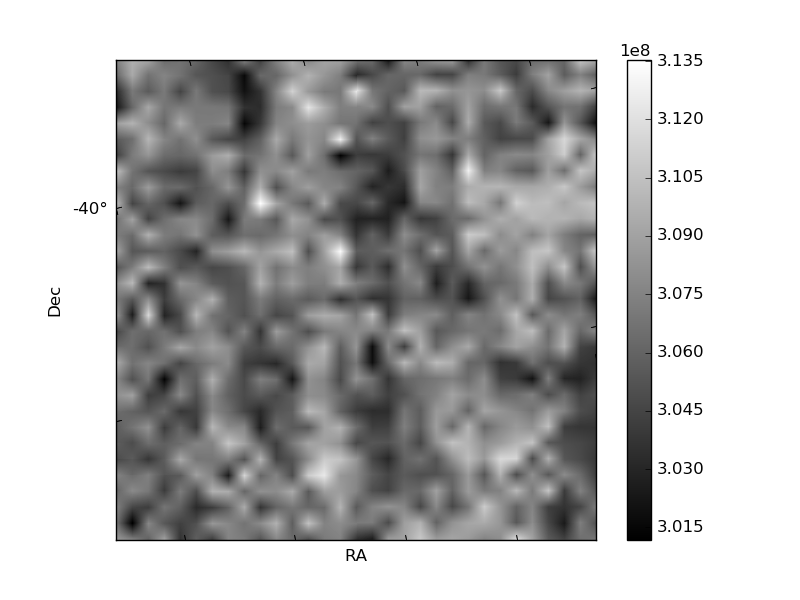
Histogram calculated using DETX and DETY for each event in the final _common_clean file
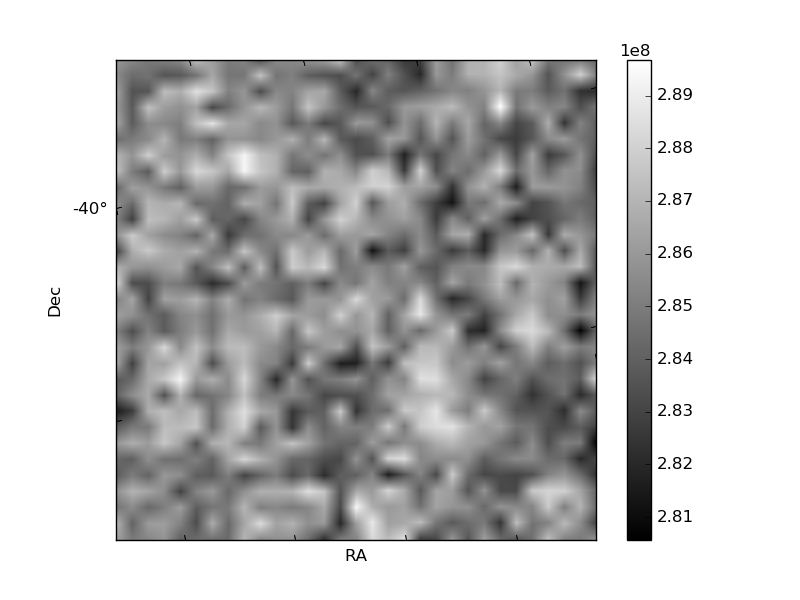
| Quadrant A | 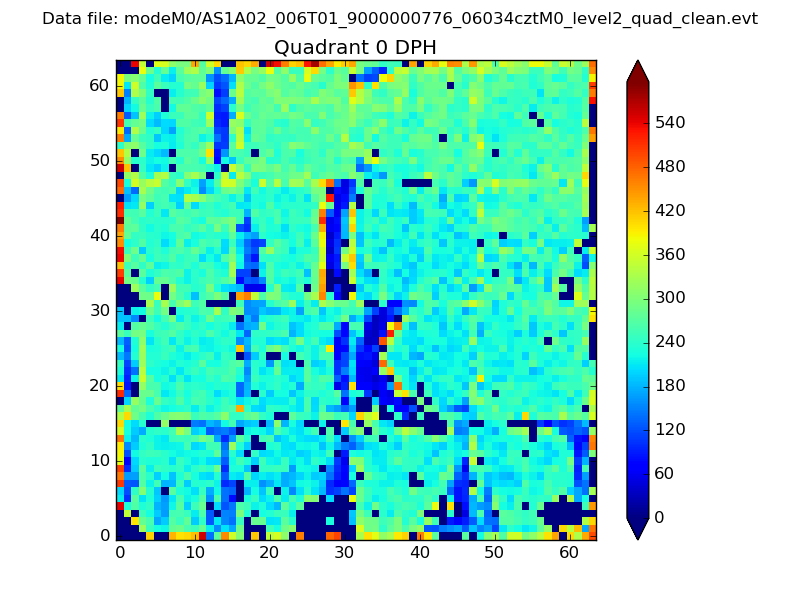 |
 |
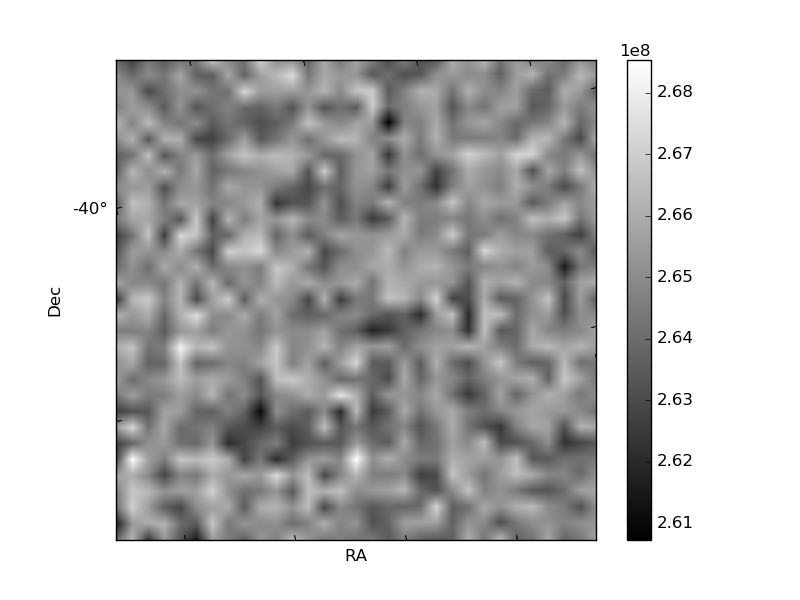
Quadrant B |
|---|---|---|---|
| Quadrant D | 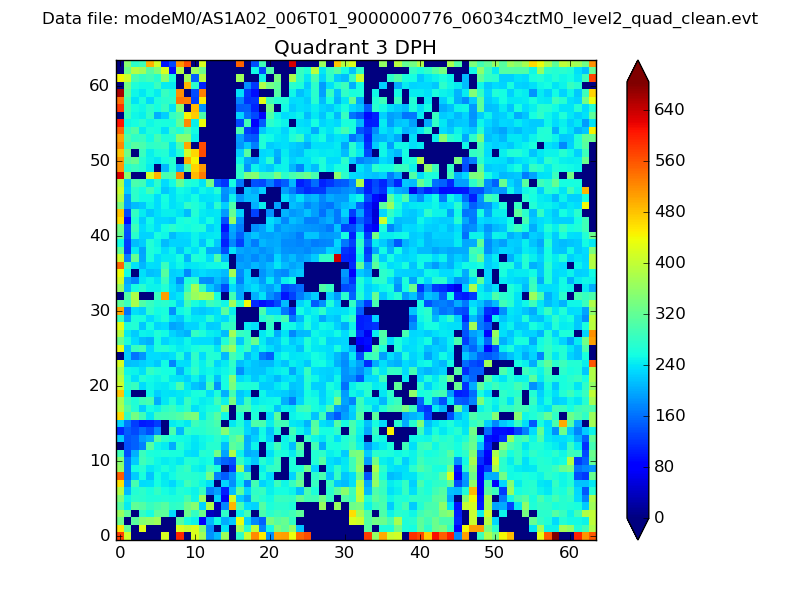 |
 |
Quadrant C |
| Plot type | Count rate plots | Images |
|---|---|---|
| Comparison with Poisson distribution Blue bars denote a histogram of data divided into 1 sec bins. Red curve is a Poisson curve with rate = median count rate of data. |
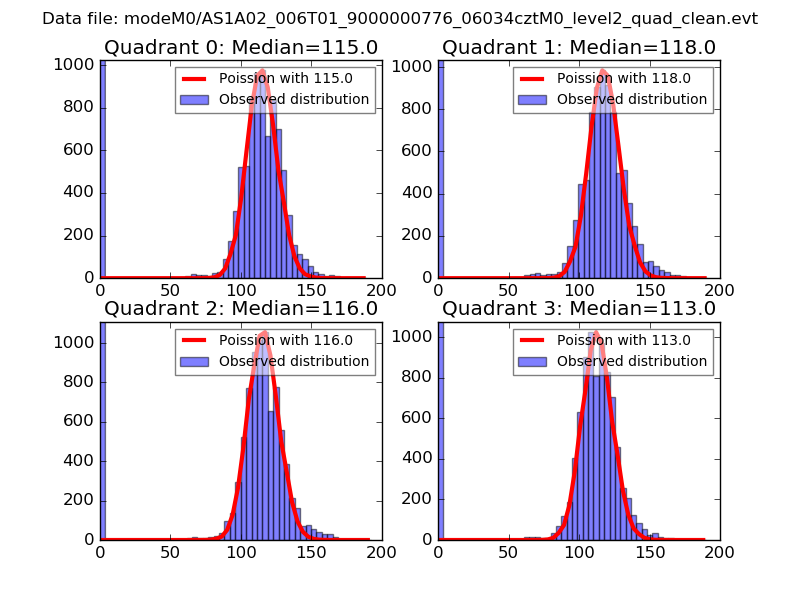 |
 |
| Quadrant-wise count rates Data is divided into 100 sec bins |
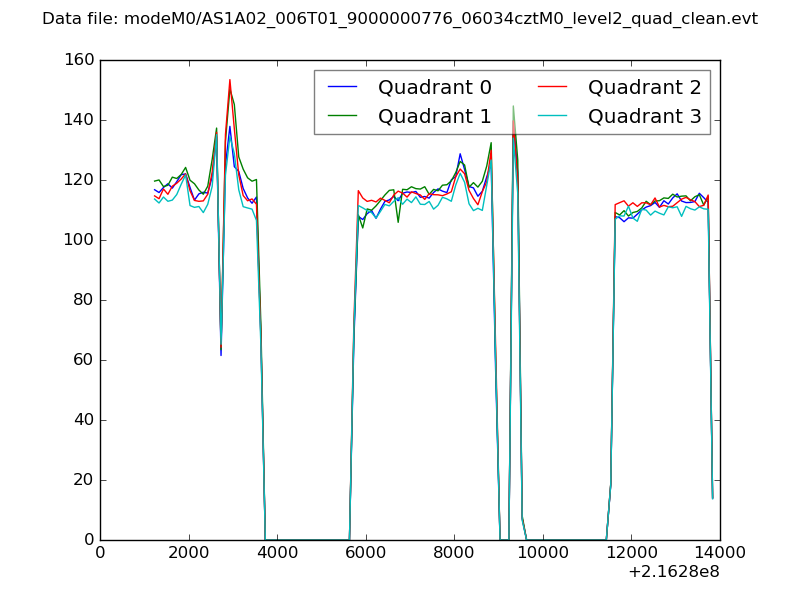 |
|
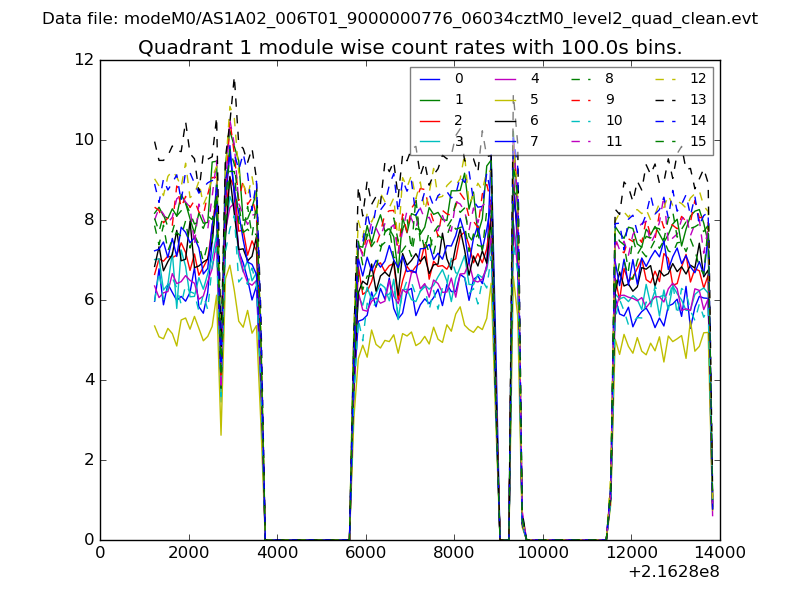
| Module-wise count rates for Quadrant A Data is divided into 100 sec bins |
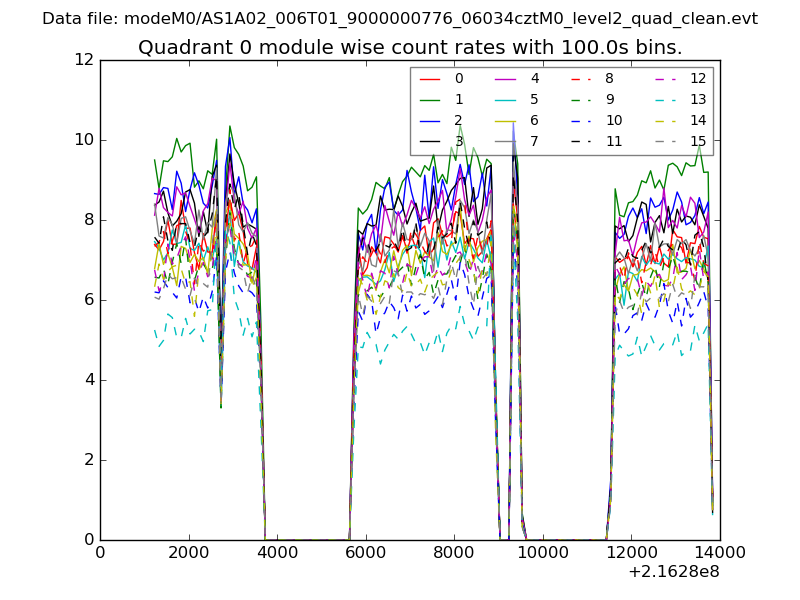 |
 |
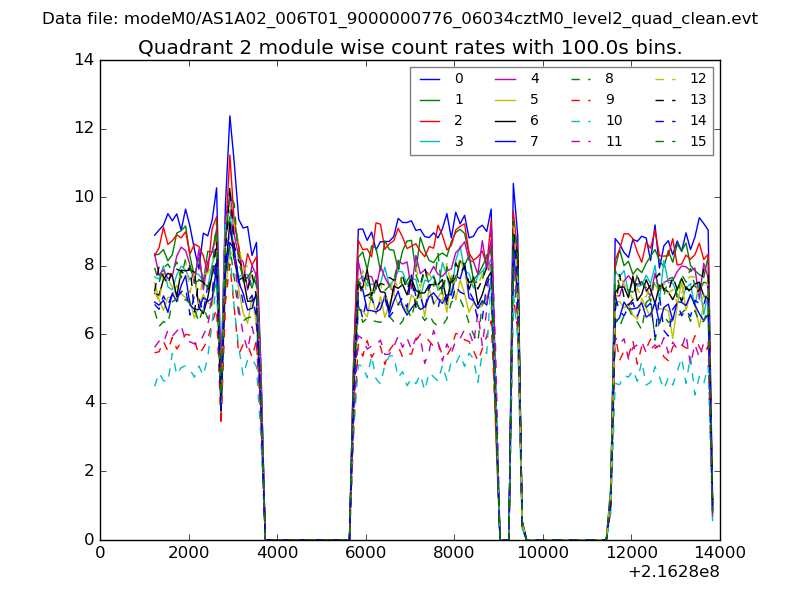
| Module-wise count rates for Quadrant B Data is divided into 100 sec bins |
 |
 |
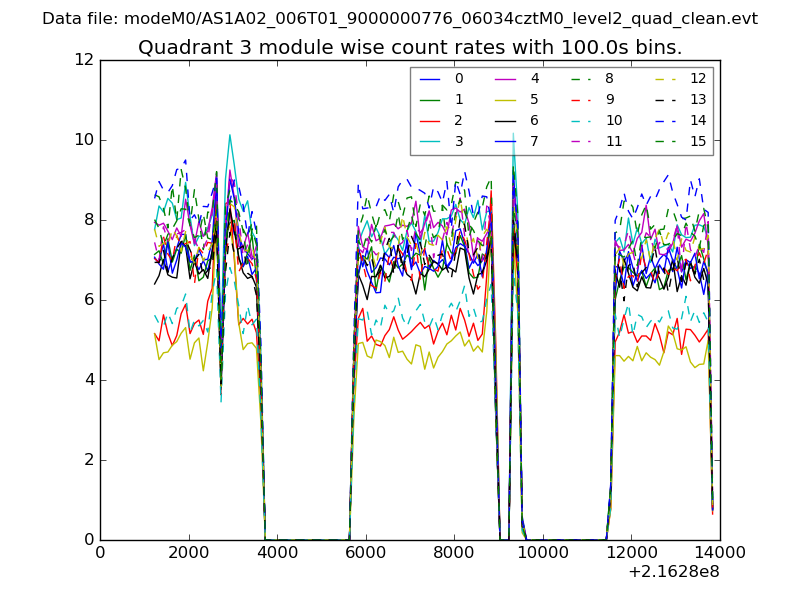
| Module-wise count rates for Quadrant C Data is divided into 100 sec bins |
 |
 |
| Module-wise count rates for Quadrant D Data is divided into 100 sec bins |
 |
 |
| Parameter | Plot |
|---|---|
| CZT HV Monitor | 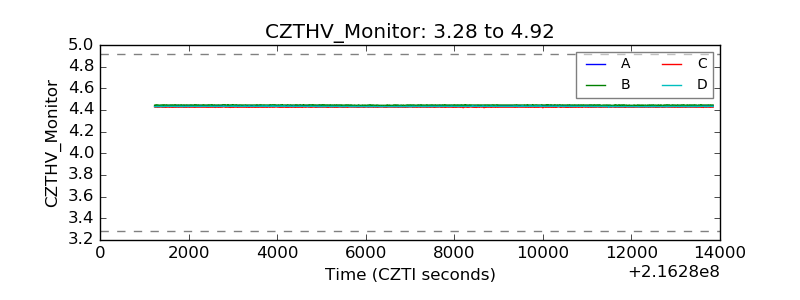 |
| D_VDD | 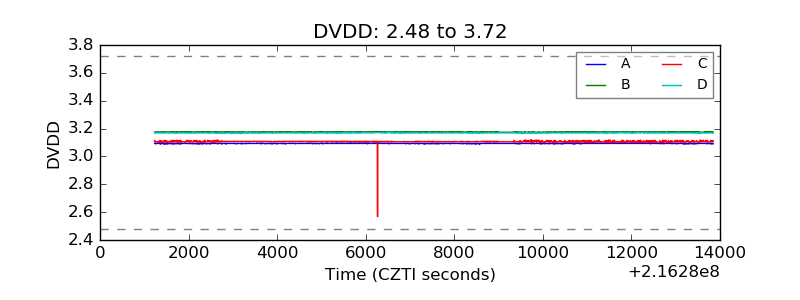 |
| Temperature 1 | 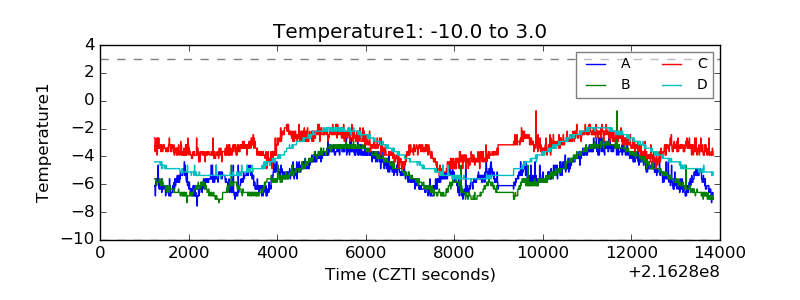 |
| Veto HV Monitor | 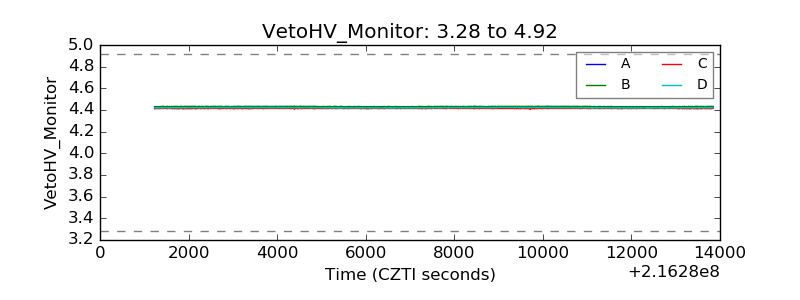 |
| Veto LLD | 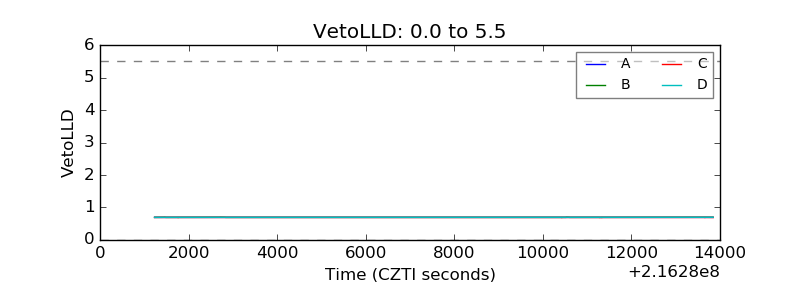 |
| Alpha Counter | 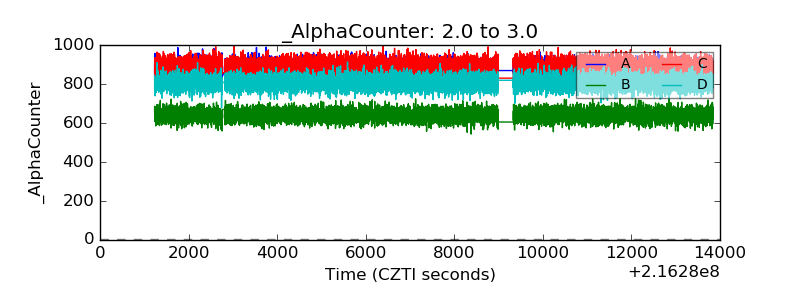 |
| _CPM_Rate | 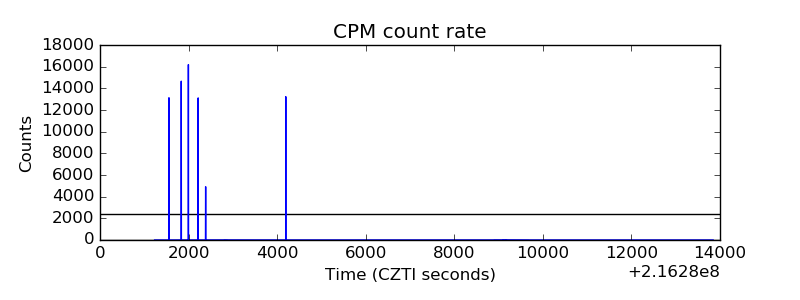 |
| CZT Counter | 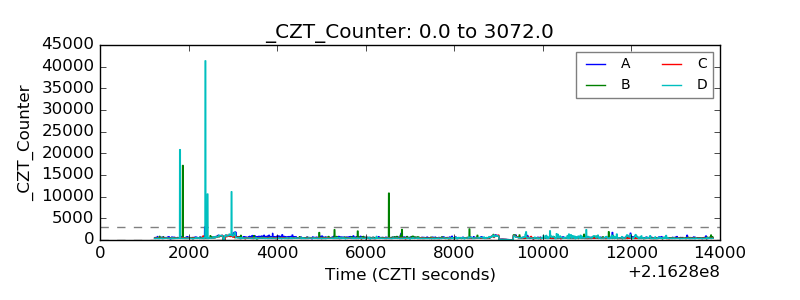 |
| +2.5 Volts monitor |  |
| +5 Volts monitor |  |
| _ROLL_ROT | 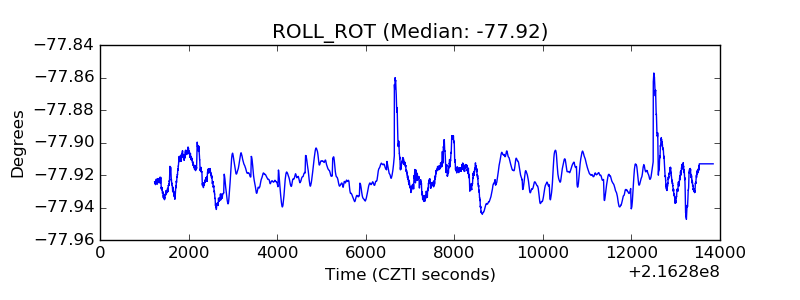 |
| _Roll_DEC | 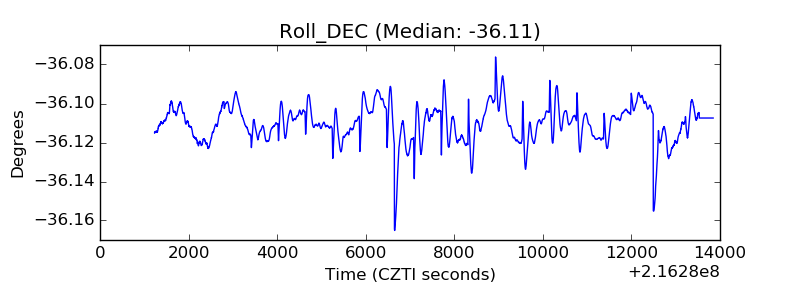 |
| _Roll_RA | 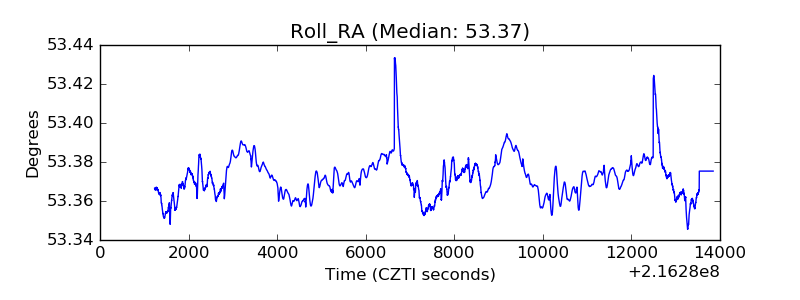 |
| Veto Counter | 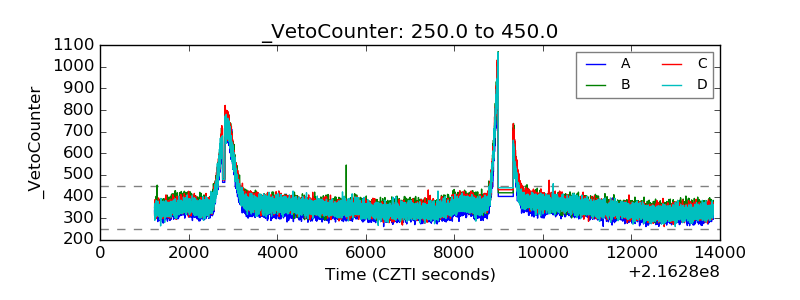 |