| Param | Original file | Final file |
|---|---|---|
| Filename | modeM0/AS1A02_090T01_9000000778_06036cztM0_level2.evt | modeM0/AS1A02_090T01_9000000778_06036cztM0_level2_quad_clean.evt |
| Size (bytes) | 493,899,840 | 98,029,440 |
| Size | 471.0 MB | 93.5 MB |
| Events in quadrant A | 4,843,161 | 637,356 |
| Events in quadrant B | 4,072,077 | 646,316 |
| Events in quadrant C | 2,837,686 | 650,412 |
| Events in quadrant D | 2,798,264 | 615,923 |
| Mode M0 | |||
|---|---|---|---|
| Quadrant | BADHDUFLAG | Total packets | Discarded packets |
| A | 0 | 18623 | 2 |
| B | 0 | 15999 | 1 |
| C | 0 | 12311 | 1 |
| D | 0 | 12524 | 1 |
| Mode SS | |||
|---|---|---|---|
| Quadrant | BADHDUFLAG | Total packets | Discarded packets |
| A | 0 | 122 | 0 |
| B | 0 | 122 | 0 |
| C | 0 | 122 | 0 |
| D | 0 | 122 | 0 |
| Mode M9 | |||
|---|---|---|---|
| Quadrant | BADHDUFLAG | Total packets | Discarded packets |
| A | 0 | 13 | 0 |
| B | 0 | 13 | 0 |
| C | 0 | 13 | 0 |
| D | 0 | 13 | 0 |
| Quadrant | Total seconds | Saturated seconds | Saturation percentage |
|---|---|---|---|
| A | 5995 | 124 | 2.068390% |
| B | 5995 | 294 | 4.904087% |
| C | 5995 | 11 | 0.183486% |
| D | 5995 | 12 | 0.200167% |
Noise dominated data is calculated using 1-second bins in cleaned event files. If a bin has >2000 counts, and if more than 50% of those come from <1% of pixels, then it is considered to be noise-dominated and hence unusable.
| Quadrant | # 1 sec bins | Bins with >0 counts | Bins with >2000 counts | High rate bins dominated by noise | Noise dominated (total time) | Noise dominated (detector-on time) | Marked lightcurve |
|---|---|---|---|---|---|---|---|
| A | 7300 | 5996 | 5 | 5 | 0.07% | 0.08% | 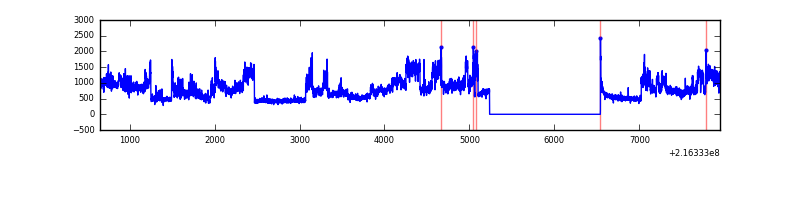 |
| B | 7300 | 5996 | 228 | 228 | 3.12% | 3.80% | 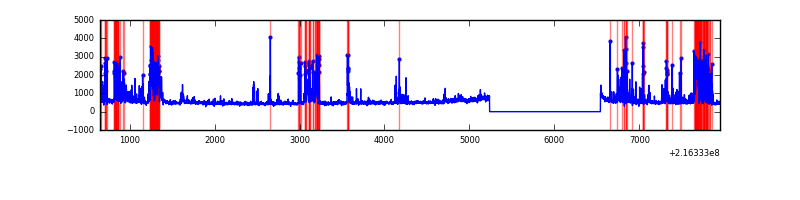 |
| C | 7300 | 5996 | 0 | 0 | 0.00% | 0.00% | 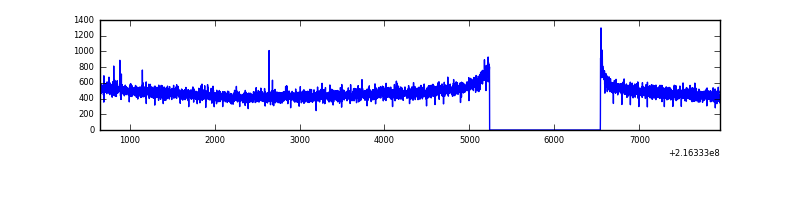 |
| D | 7300 | 5996 | 4 | 4 | 0.05% | 0.07% | 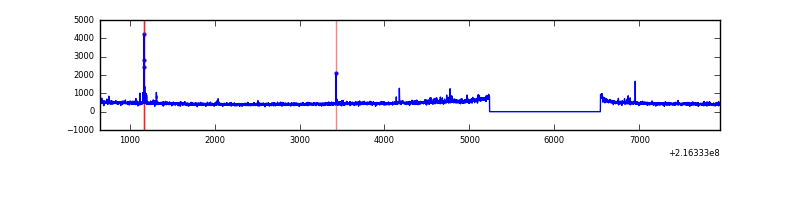 |
Top three noisy pixels from each quadrant. If the there are fewer than three noisy pixels in the level2.evt file, extra rows are filled as -1
| Pixel properties | Quadrant properties | ||||||
|---|---|---|---|---|---|---|---|
| Quadrant | DetID | PixID | Counts | Sigma | Mean | Median | Sigma |
| A | 13 | 34 | 1980226 | 13211.13 | 730 | 715 | 149.8 |
| A | 8 | 15 | 30003 | 195.46 | 730 | 715 | 149.8 |
| A | 14 | 111 | 18620 | 119.49 | 730 | 715 | 149.8 |
| B | 3 | 64 | 1090970 | 7801.63 | 736 | 722 | 139.7 |
| B | 15 | 204 | 25996 | 180.86 | 736 | 722 | 139.7 |
| B | 0 | 219 | 25190 | 175.09 | 736 | 722 | 139.7 |
| C | 14 | 67 | 22463 | 130.11 | 718 | 728 | 167.0 |
| C | 1 | 16 | 9524 | 52.66 | 718 | 728 | 167.0 |
| C | 13 | 61 | 5906 | 31.0 | 718 | 728 | 167.0 |
| D | 8 | 195 | 47722 | 269.11 | 709 | 689 | 174.8 |
| D | 2 | 33 | 26728 | 148.99 | 709 | 689 | 174.8 |
| D | 2 | 136 | 25033 | 139.29 | 709 | 689 | 174.8 |
Histogram calculated using DETX and DETY for each event in the final _common_clean file
| Quadrant A | 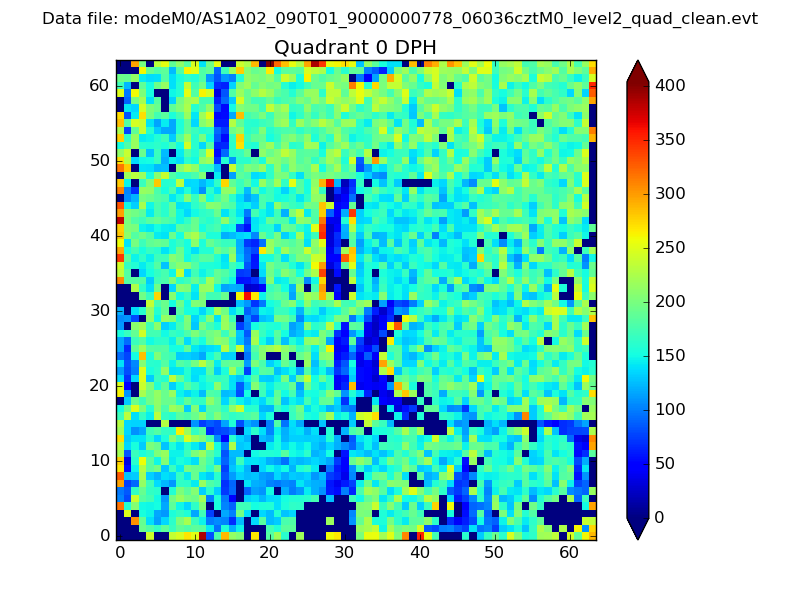 |
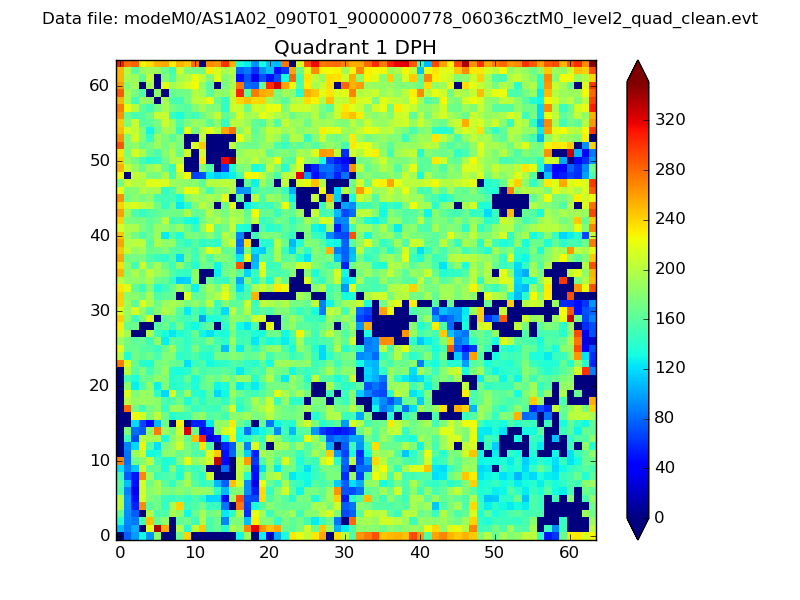 |
Quadrant B |
|---|---|---|---|
| Quadrant D | 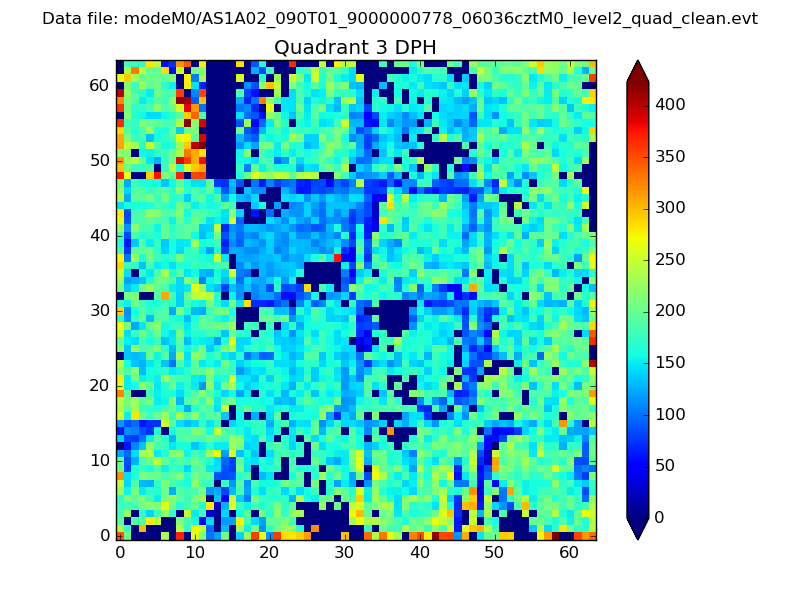 |
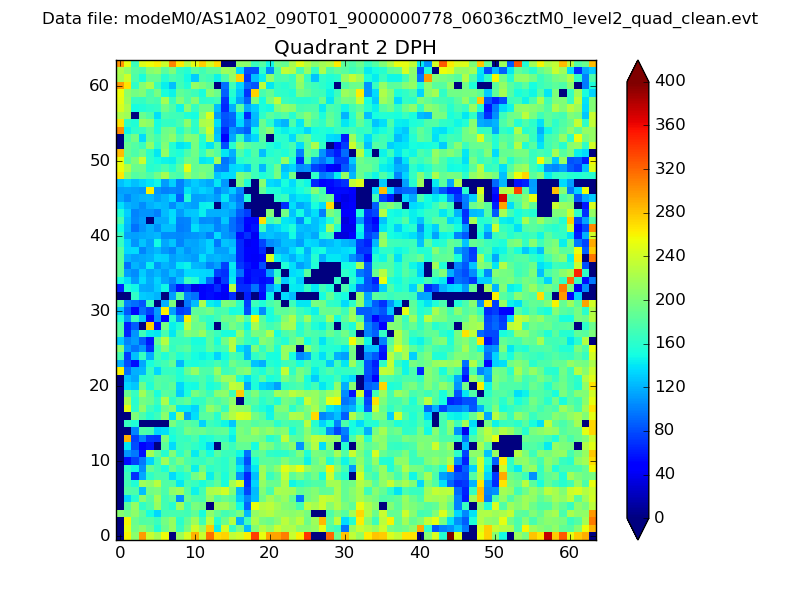 |
Quadrant C |
| Plot type | Count rate plots | Images |
|---|---|---|
| Comparison with Poisson distribution Blue bars denote a histogram of data divided into 1 sec bins. Red curve is a Poisson curve with rate = median count rate of data. |
 |
 |
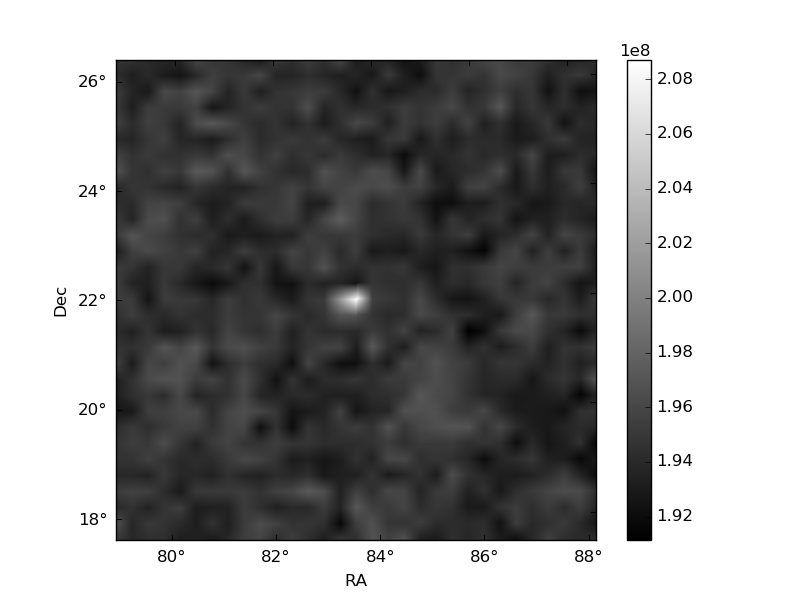
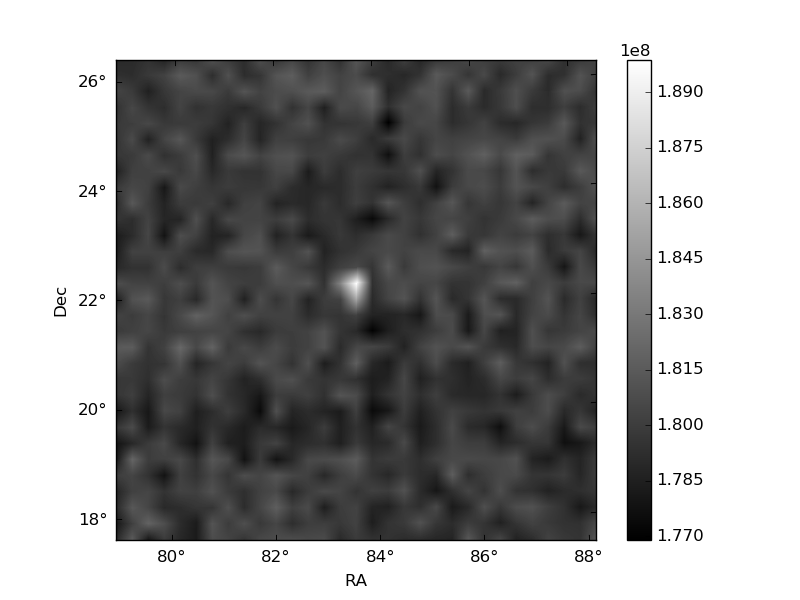
| Quadrant-wise count rates Data is divided into 100 sec bins |
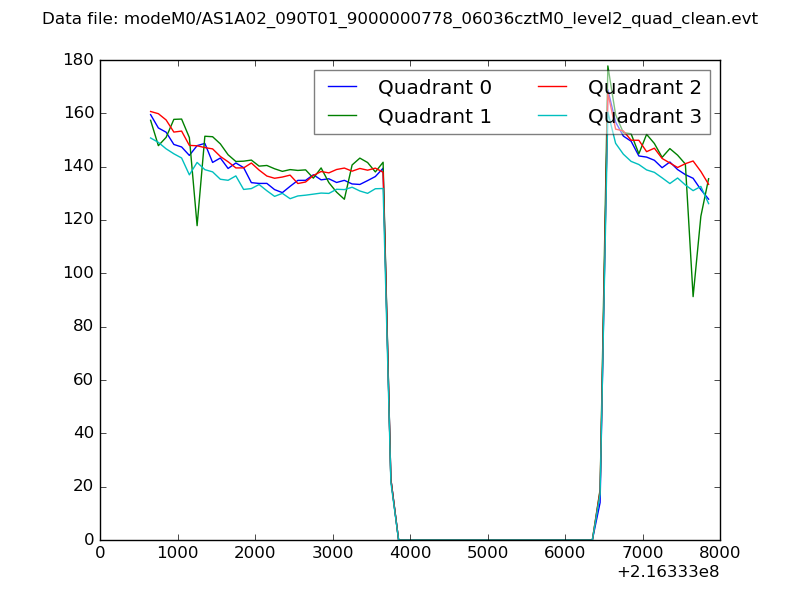 |
|
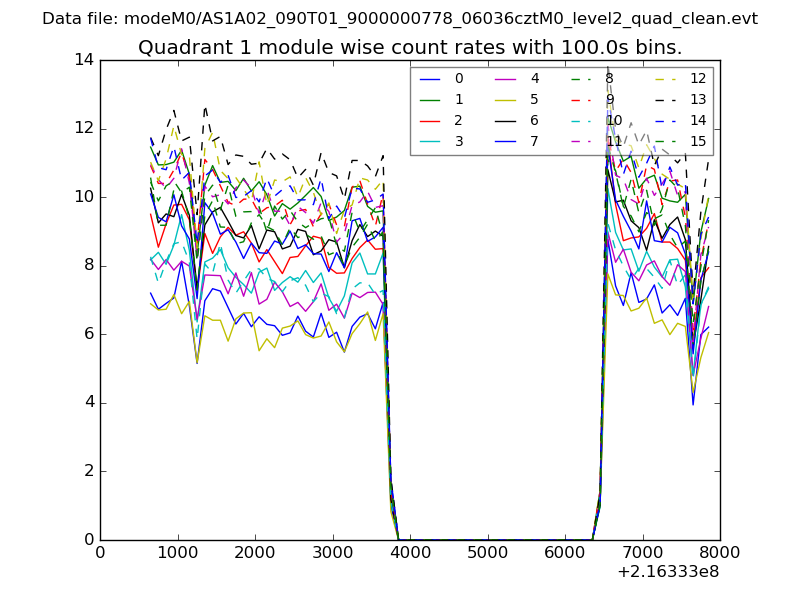
| Module-wise count rates for Quadrant A Data is divided into 100 sec bins |
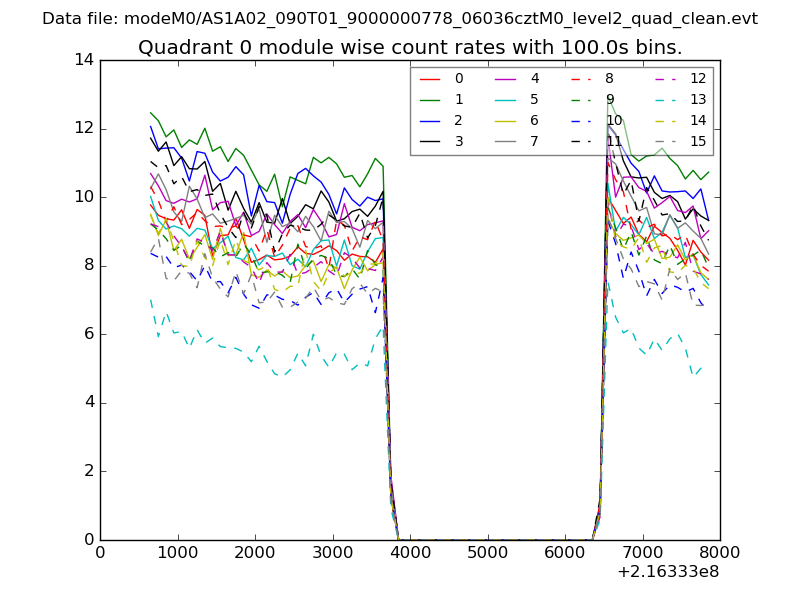 |
 |
| Module-wise count rates for Quadrant B Data is divided into 100 sec bins |
 |
 |
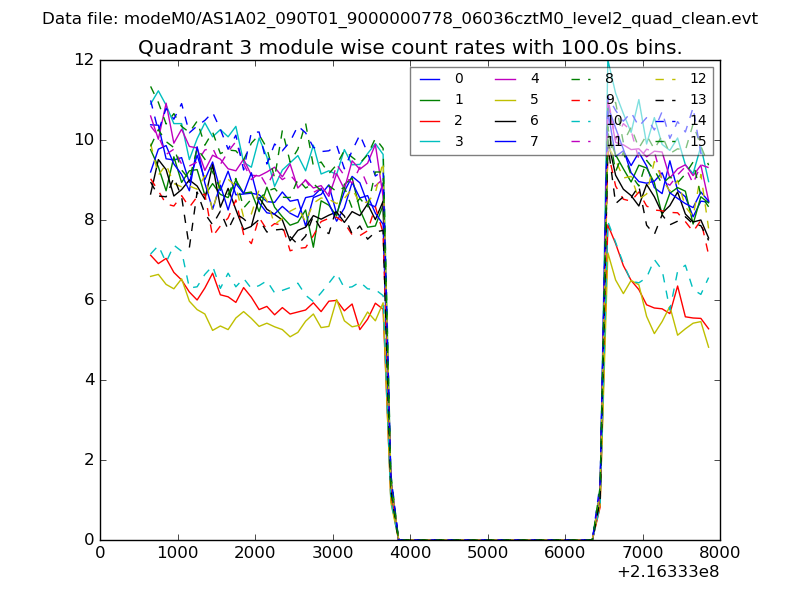
| Module-wise count rates for Quadrant C Data is divided into 100 sec bins |
 |
 |
| Module-wise count rates for Quadrant D Data is divided into 100 sec bins |
 |
 |
| Parameter | Plot |
|---|---|
| CZT HV Monitor | 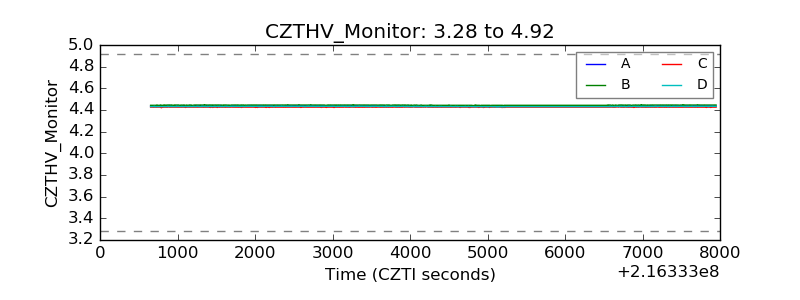 |
| D_VDD | 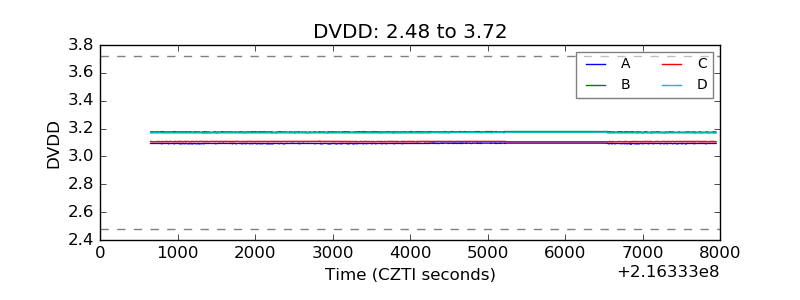 |
| Temperature 1 | 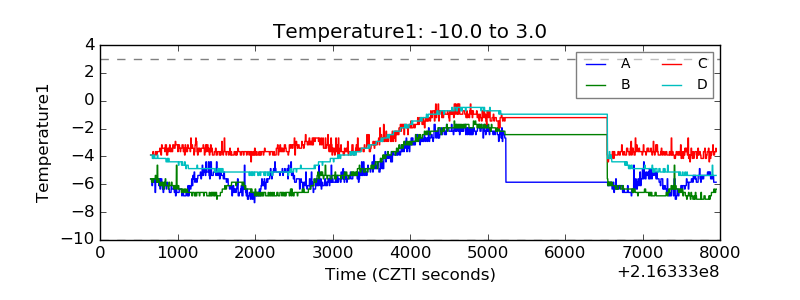 |
| Veto HV Monitor | 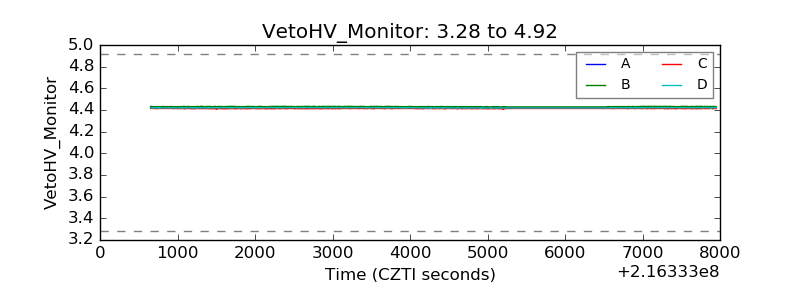 |
| Veto LLD | 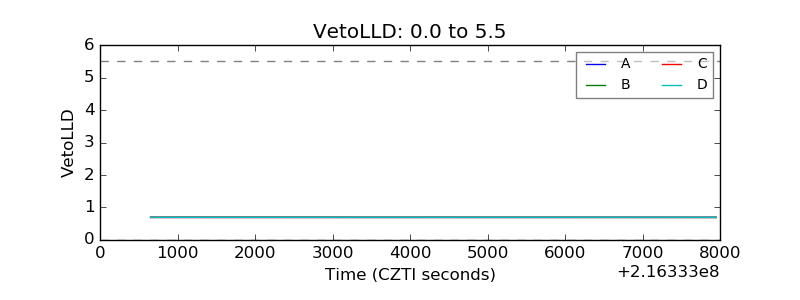 |
| Alpha Counter | 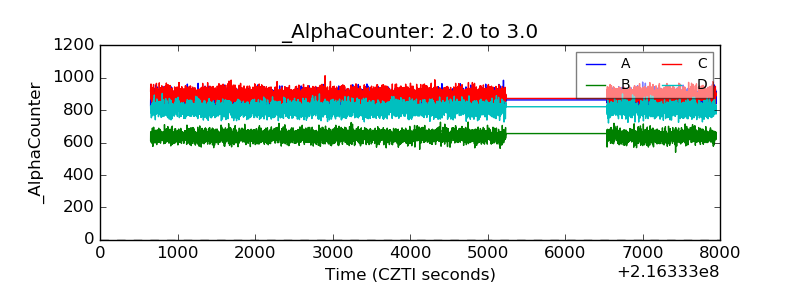 |
| _CPM_Rate | 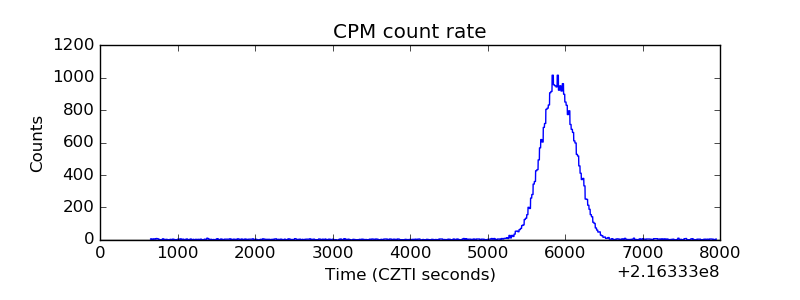 |
| CZT Counter | 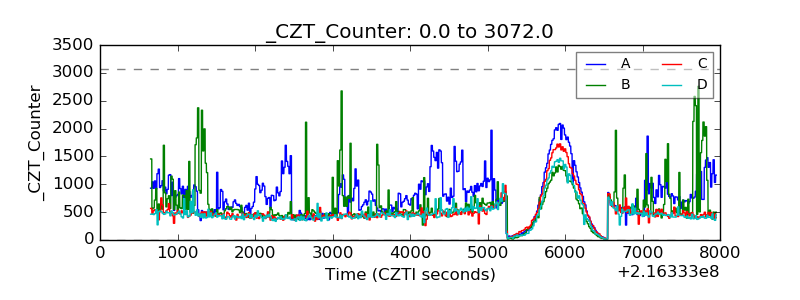 |
| +2.5 Volts monitor |  |
| +5 Volts monitor |  |
| _ROLL_ROT | 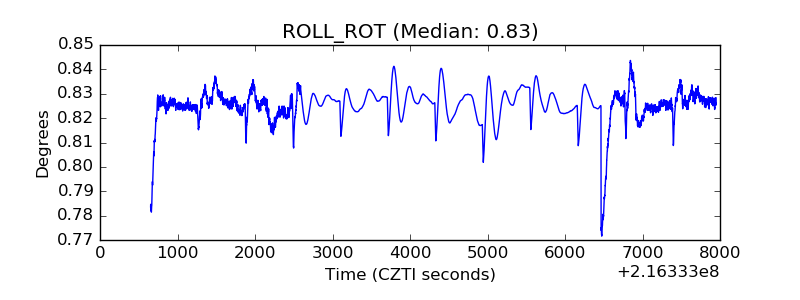 |
| _Roll_DEC | 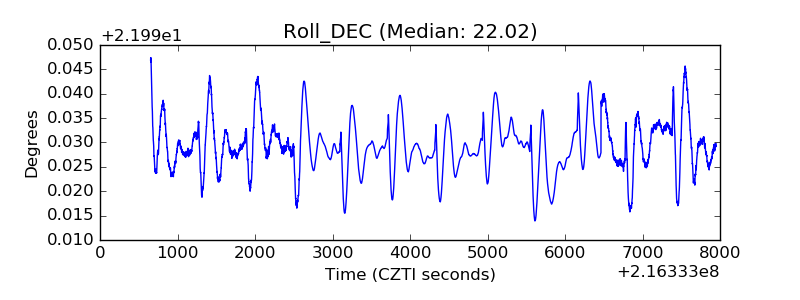 |
| _Roll_RA | 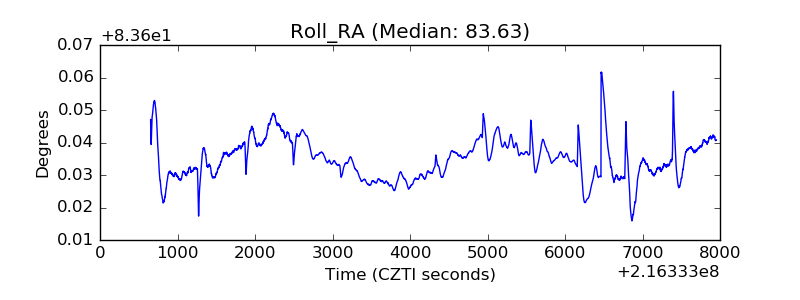 |
| Veto Counter | 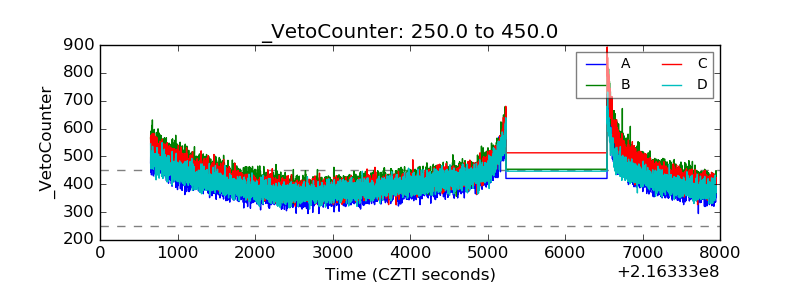 |