| Param | Original file | Final file |
|---|---|---|
| Filename | modeM0/AS1A02_090T01_9000000778_06038cztM0_level2.evt | modeM0/AS1A02_090T01_9000000778_06038cztM0_level2_quad_clean.evt |
| Size (bytes) | 554,503,680 | 98,006,400 |
| Size | 528.8 MB | 93.5 MB |
| Events in quadrant A | 6,015,370 | 617,589 |
| Events in quadrant B | 3,985,435 | 640,347 |
| Events in quadrant C | 3,143,218 | 630,794 |
| Events in quadrant D | 3,178,630 | 595,826 |
| Mode M0 | |||
|---|---|---|---|
| Quadrant | BADHDUFLAG | Total packets | Discarded packets |
| A | 0 | 22630 | 2 |
| B | 0 | 16454 | 8 |
| C | 0 | 14205 | 3 |
| D | 0 | 14436 | 5 |
| Mode SS | |||
|---|---|---|---|
| Quadrant | BADHDUFLAG | Total packets | Discarded packets |
| A | 0 | 142 | 0 |
| B | 0 | 142 | 0 |
| C | 0 | 142 | 0 |
| D | 0 | 142 | 0 |
| Mode M9 | |||
|---|---|---|---|
| Quadrant | BADHDUFLAG | Total packets | Discarded packets |
| A | 0 | 7 | 0 |
| B | 0 | 7 | 0 |
| C | 0 | 7 | 0 |
| D | 0 | 7 | 0 |
| Quadrant | Total seconds | Saturated seconds | Saturation percentage |
|---|---|---|---|
| A | 6938 | 227 | 3.271836% |
| B | 6937 | 312 | 4.497621% |
| C | 6937 | 12 | 0.172985% |
| D | 6936 | 28 | 0.403691% |
Noise dominated data is calculated using 1-second bins in cleaned event files. If a bin has >2000 counts, and if more than 50% of those come from <1% of pixels, then it is considered to be noise-dominated and hence unusable.
| Quadrant | # 1 sec bins | Bins with >0 counts | Bins with >2000 counts | High rate bins dominated by noise | Noise dominated (total time) | Noise dominated (detector-on time) | Marked lightcurve |
|---|---|---|---|---|---|---|---|
| A | 7723 | 6939 | 67 | 67 | 0.87% | 0.97% | 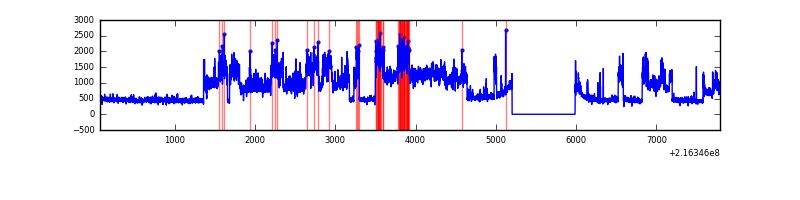 |
| B | 7723 | 6938 | 216 | 216 | 2.80% | 3.11% | 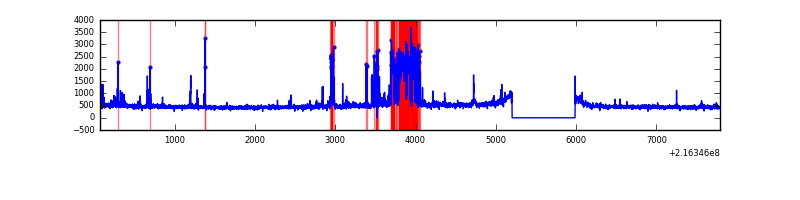 |
| C | 7723 | 6939 | 0 | 0 | 0.00% | 0.00% |  |
| D | 7723 | 6939 | 18 | 18 | 0.23% | 0.26% | 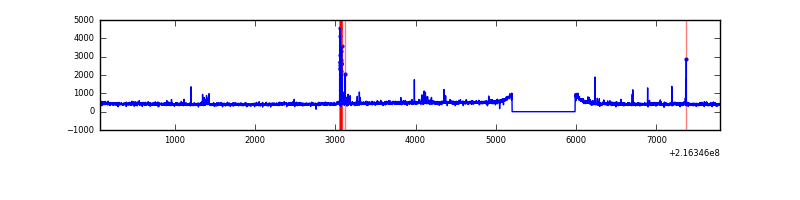 |
Top three noisy pixels from each quadrant. If the there are fewer than three noisy pixels in the level2.evt file, extra rows are filled as -1
| Pixel properties | Quadrant properties | ||||||
|---|---|---|---|---|---|---|---|
| Quadrant | DetID | PixID | Counts | Sigma | Mean | Median | Sigma |
| A | 13 | 34 | 2782875 | 16526.74 | 815 | 799 | 168.3 |
| A | 8 | 15 | 55729 | 326.31 | 815 | 799 | 168.3 |
| A | 4 | 2 | 20591 | 117.57 | 815 | 799 | 168.3 |
| B | 3 | 64 | 776710 | 4946.53 | 815 | 798 | 156.9 |
| B | 15 | 204 | 32502 | 202.12 | 815 | 798 | 156.9 |
| B | 12 | 111 | 15024 | 90.69 | 815 | 798 | 156.9 |
| C | 1 | 16 | 22533 | 116.75 | 798 | 807 | 186.1 |
| C | 13 | 61 | 6389 | 30.0 | 798 | 807 | 186.1 |
| C | 8 | 79 | 4054 | 17.45 | 798 | 807 | 186.1 |
| D | 2 | 33 | 62827 | 315.87 | 792 | 769 | 196.5 |
| D | 8 | 195 | 58520 | 293.94 | 792 | 769 | 196.5 |
| D | 2 | 16 | 39606 | 197.67 | 792 | 769 | 196.5 |
Histogram calculated using DETX and DETY for each event in the final _common_clean file
| Quadrant A |  |
 |
Quadrant B |
|---|---|---|---|
| Quadrant D | 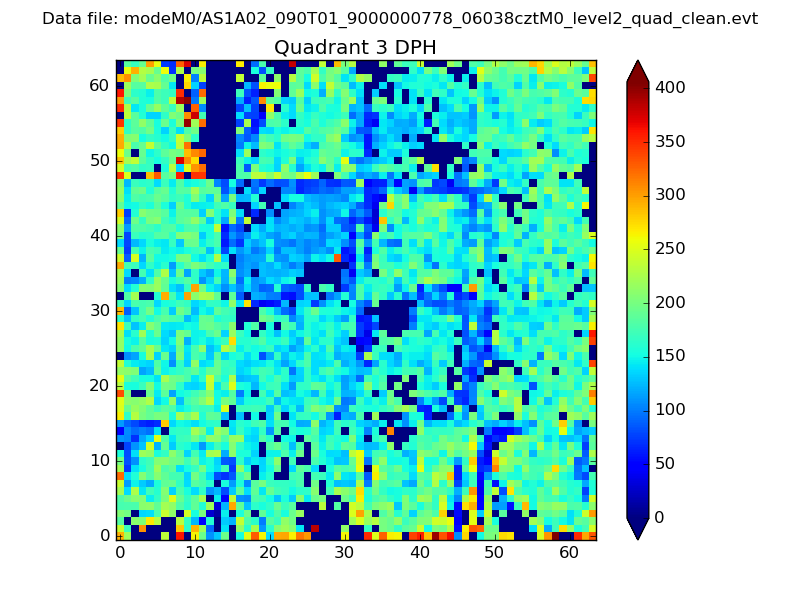 |
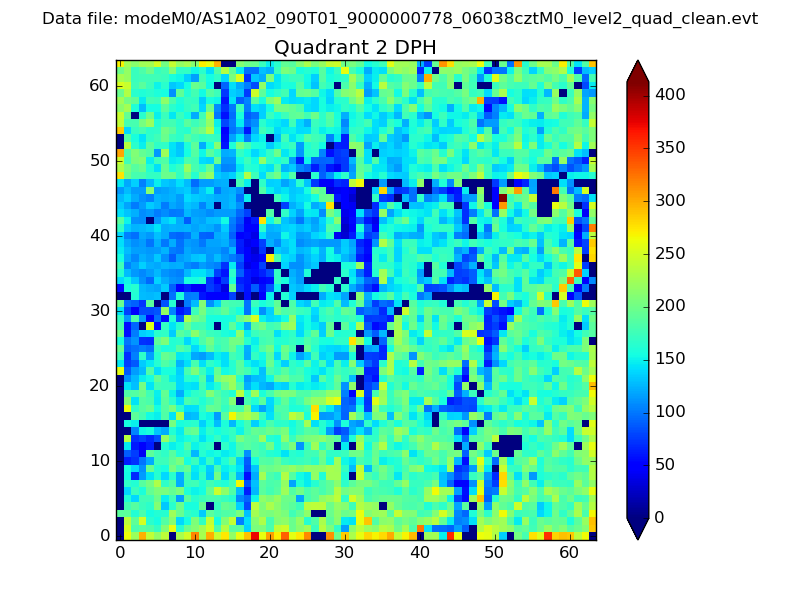 |
Quadrant C |
| Plot type | Count rate plots | Images |
|---|---|---|
| Comparison with Poisson distribution Blue bars denote a histogram of data divided into 1 sec bins. Red curve is a Poisson curve with rate = median count rate of data. |
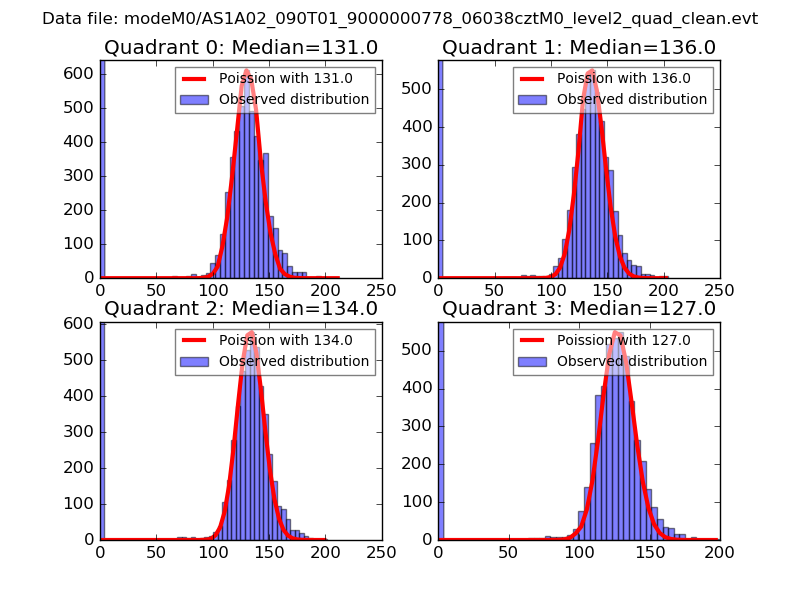 |
 |
| Quadrant-wise count rates Data is divided into 100 sec bins |
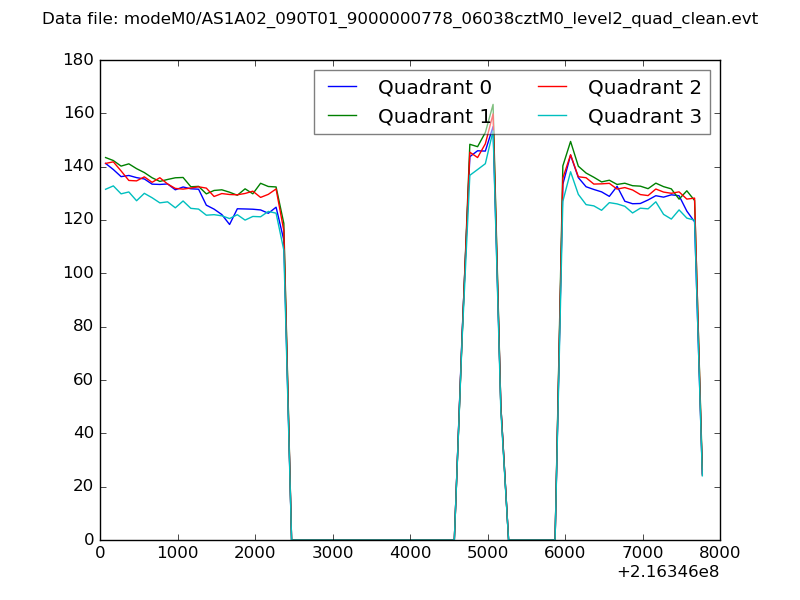 |
|
| Module-wise count rates for Quadrant A Data is divided into 100 sec bins |
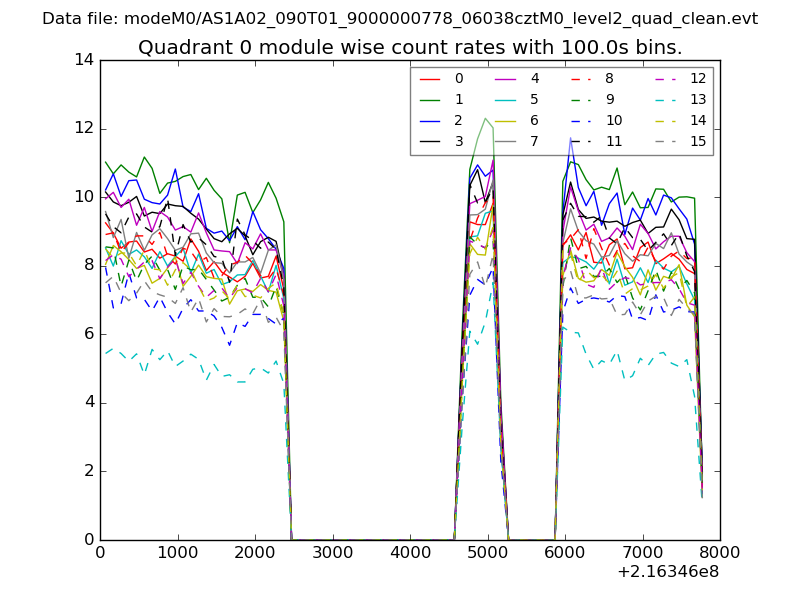 |
 |
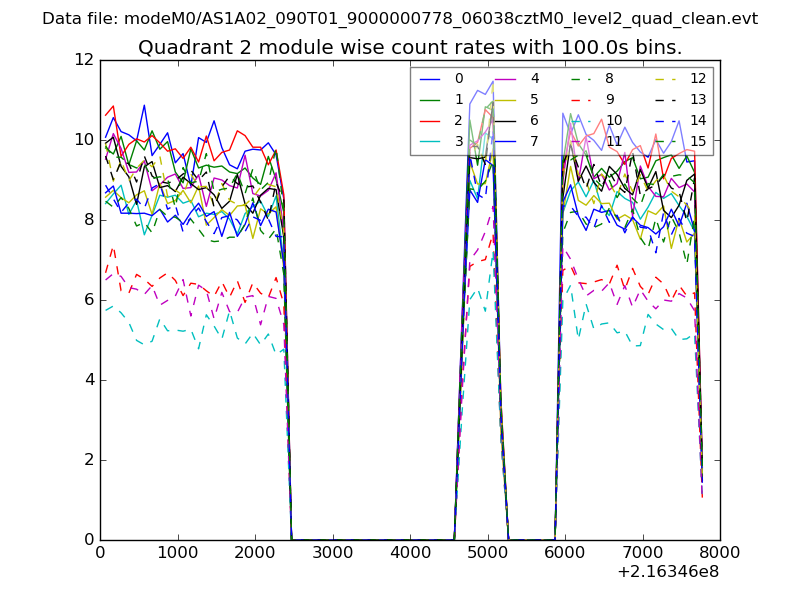
| Module-wise count rates for Quadrant B Data is divided into 100 sec bins |
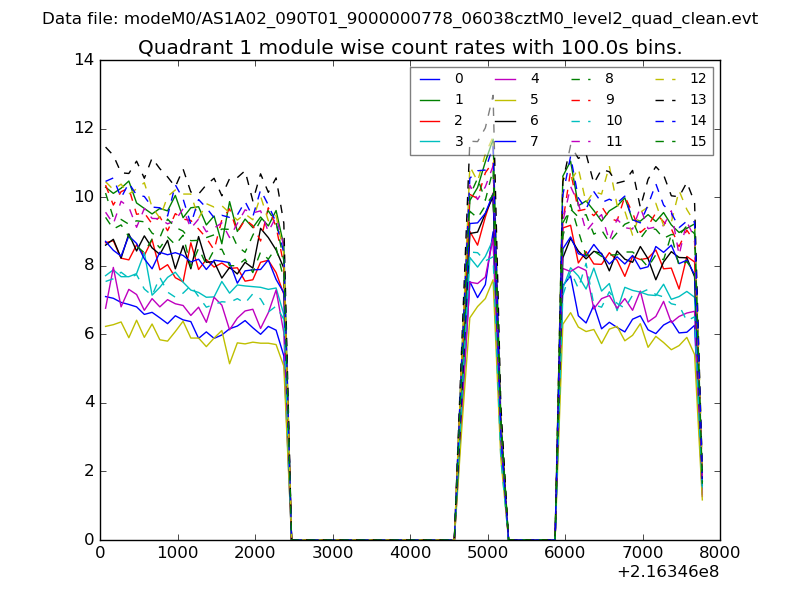 |
 |
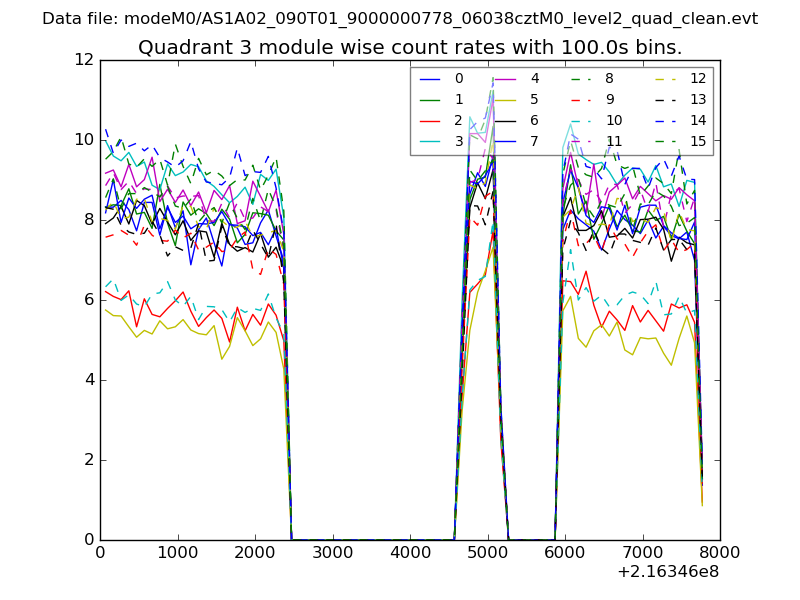
| Module-wise count rates for Quadrant C Data is divided into 100 sec bins |
 |
 |
| Module-wise count rates for Quadrant D Data is divided into 100 sec bins |
 |
 |
| Parameter | Plot |
|---|---|
| CZT HV Monitor | 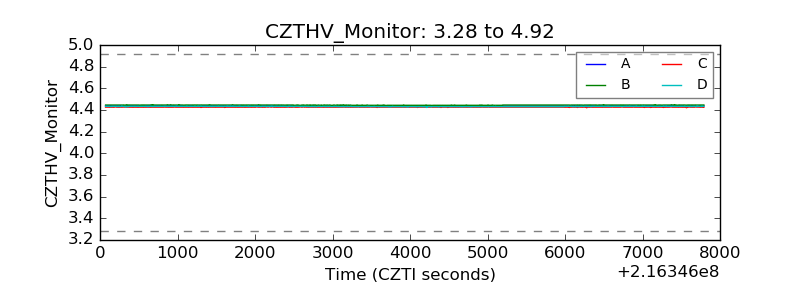 |
| D_VDD | 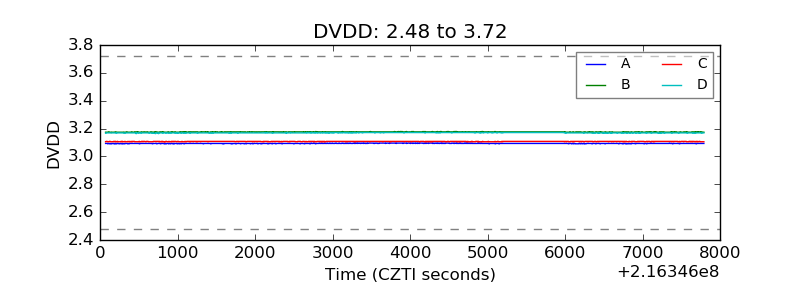 |
| Temperature 1 | 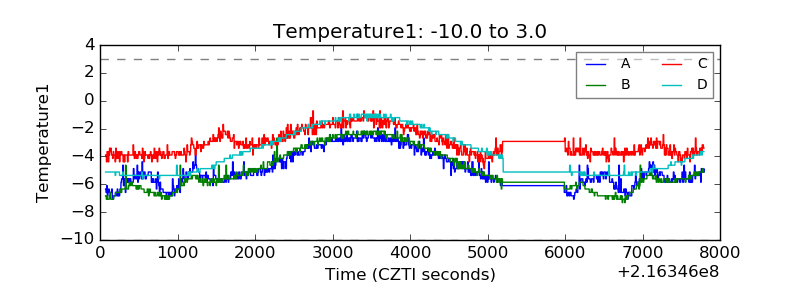 |
| Veto HV Monitor | 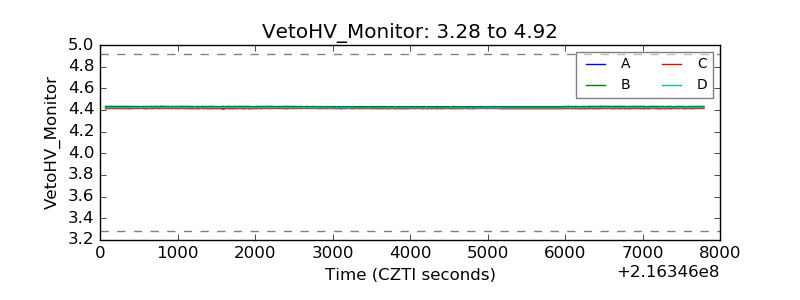 |
| Veto LLD | 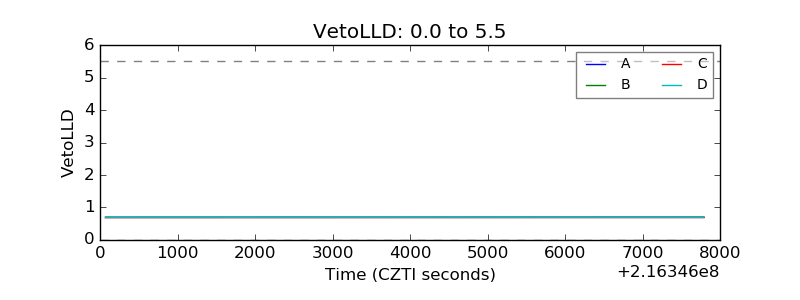 |
| Alpha Counter | 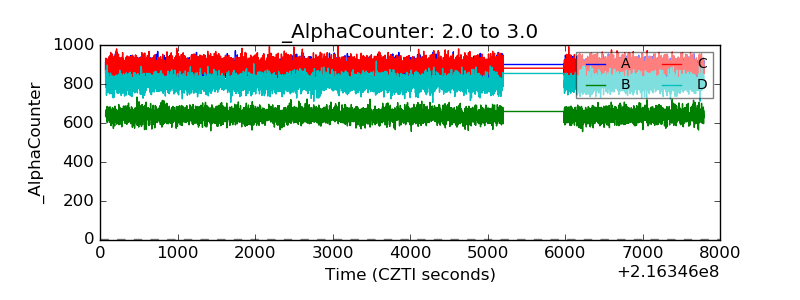 |
| _CPM_Rate | 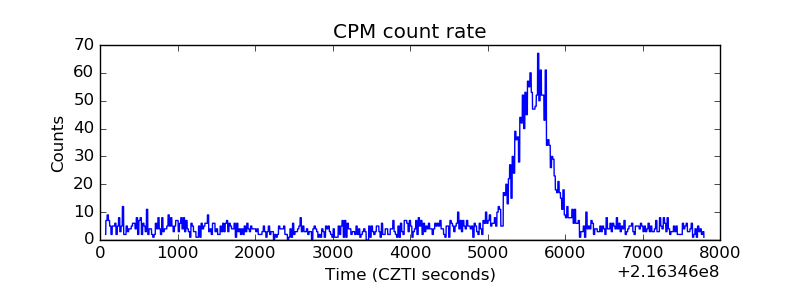 |
| CZT Counter | 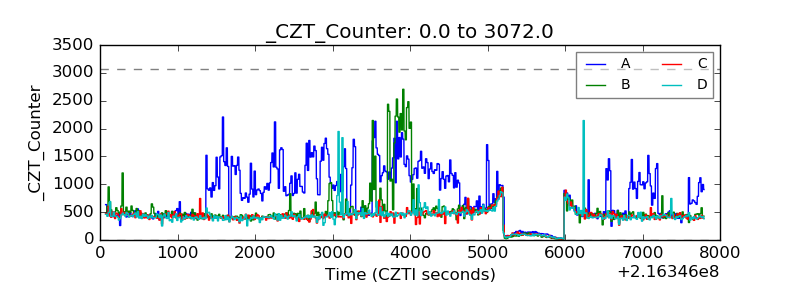 |
| +2.5 Volts monitor |  |
| +5 Volts monitor |  |
| _ROLL_ROT | 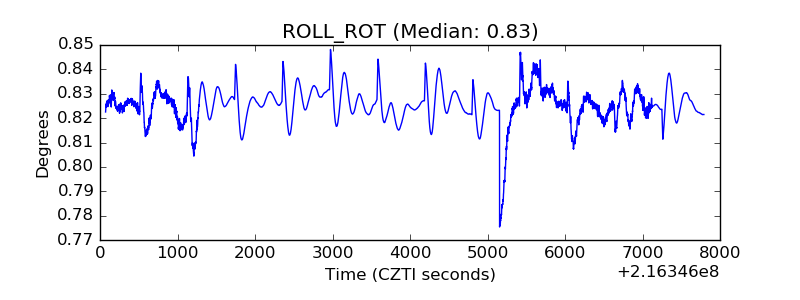 |
| _Roll_DEC | 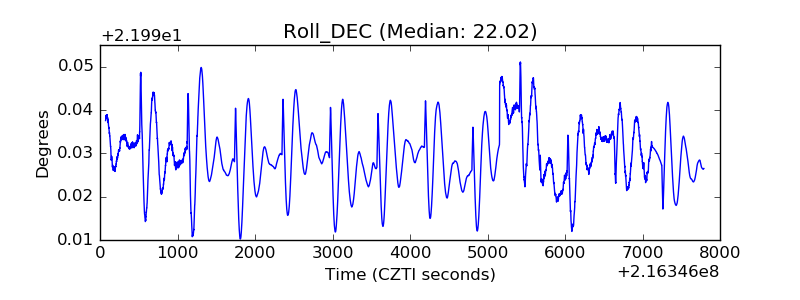 |
| _Roll_RA | 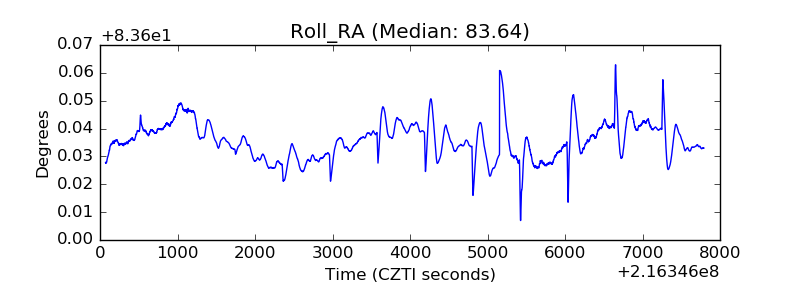 |
| Veto Counter | 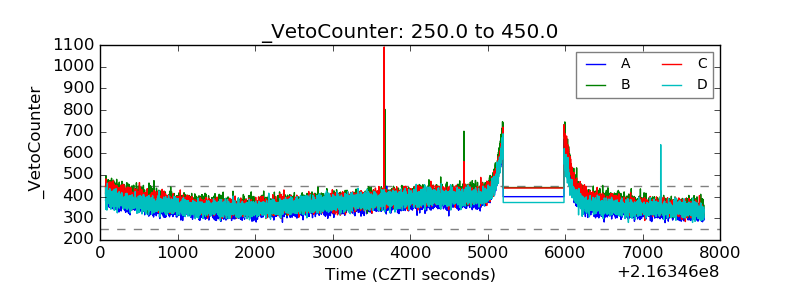 |