| Param | Original file | Final file |
|---|---|---|
| Filename | modeM0/AS1A02_090T01_9000000778_06039cztM0_level2.evt | modeM0/AS1A02_090T01_9000000778_06039cztM0_level2_quad_clean.evt |
| Size (bytes) | 546,292,800 | 89,464,320 |
| Size | 521.0 MB | 85.3 MB |
| Events in quadrant A | 4,398,595 | 552,403 |
| Events in quadrant B | 3,941,864 | 574,814 |
| Events in quadrant C | 3,024,836 | 579,162 |
| Events in quadrant D | 4,736,468 | 548,097 |
| Mode M0 | |||
|---|---|---|---|
| Quadrant | BADHDUFLAG | Total packets | Discarded packets |
| A | 0 | 18535 | 1178 |
| B | 0 | 17166 | 1179 |
| C | 0 | 14339 | 808 |
| D | 0 | 19856 | 1202 |
| Mode SS | |||
|---|---|---|---|
| Quadrant | BADHDUFLAG | Total packets | Discarded packets |
| A | 0 | 140 | 0 |
| B | 0 | 140 | 4 |
| C | 0 | 140 | 4 |
| D | 0 | 140 | 2 |
| Mode M9 | |||
|---|---|---|---|
| Quadrant | BADHDUFLAG | Total packets | Discarded packets |
| A | 0 | 2 | 0 |
| B | 0 | 2 | 0 |
| C | 0 | 2 | 0 |
| D | 0 | 2 | 0 |
| Quadrant | Total seconds | Saturated seconds | Saturation percentage |
|---|---|---|---|
| A | 6492 | 458 | 7.054837% |
| B | 6472 | 459 | 7.092089% |
| C | 6527 | 138 | 2.114294% |
| D | 6498 | 889 | 13.681133% |
Noise dominated data is calculated using 1-second bins in cleaned event files. If a bin has >2000 counts, and if more than 50% of those come from <1% of pixels, then it is considered to be noise-dominated and hence unusable.
| Quadrant | # 1 sec bins | Bins with >0 counts | Bins with >2000 counts | High rate bins dominated by noise | Noise dominated (total time) | Noise dominated (detector-on time) | Marked lightcurve |
|---|---|---|---|---|---|---|---|
| A | 7047 | 6821 | 131 | 131 | 1.86% | 1.92% | 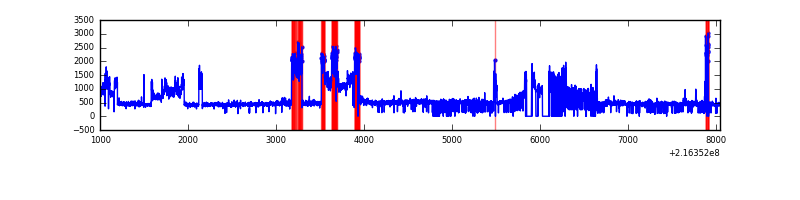 |
| B | 7047 | 6815 | 177 | 177 | 2.51% | 2.60% | 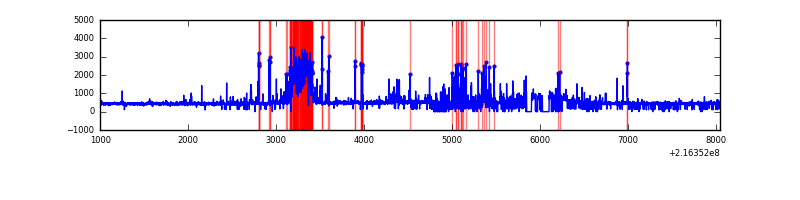 |
| C | 7047 | 6844 | 0 | 0 | 0.00% | 0.00% |  |
| D | 7047 | 6827 | 642 | 642 | 9.11% | 9.40% | 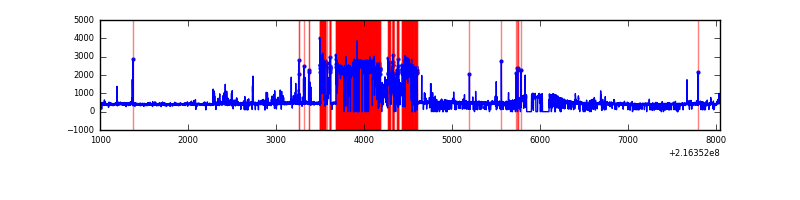 |
Top three noisy pixels from each quadrant. If the there are fewer than three noisy pixels in the level2.evt file, extra rows are filled as -1
| Pixel properties | Quadrant properties | ||||||
|---|---|---|---|---|---|---|---|
| Quadrant | DetID | PixID | Counts | Sigma | Mean | Median | Sigma |
| A | 13 | 34 | 1293276 | 8119.65 | 769 | 752 | 159.2 |
| A | 8 | 15 | 74406 | 462.69 | 769 | 752 | 159.2 |
| A | 15 | 236 | 50252 | 310.96 | 769 | 752 | 159.2 |
| B | 3 | 64 | 438722 | 2903.28 | 776 | 759 | 150.9 |
| B | 0 | 214 | 429797 | 2844.12 | 776 | 759 | 150.9 |
| B | 15 | 204 | 38841 | 252.45 | 776 | 759 | 150.9 |
| C | 1 | 16 | 18977 | 101.6 | 765 | 769 | 179.2 |
| C | 13 | 61 | 6168 | 30.13 | 765 | 769 | 179.2 |
| C | 14 | 67 | 5926 | 28.77 | 765 | 769 | 179.2 |
| D | 2 | 16 | 1932849 | 10839.82 | 719 | 696 | 178.2 |
| D | 8 | 195 | 47958 | 265.15 | 719 | 696 | 178.2 |
| D | 2 | 63 | 15256 | 81.68 | 719 | 696 | 178.2 |
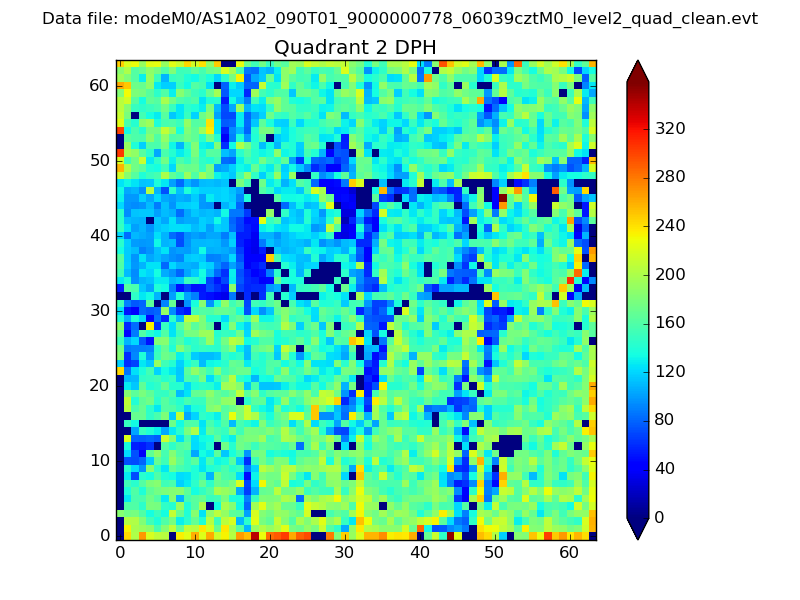
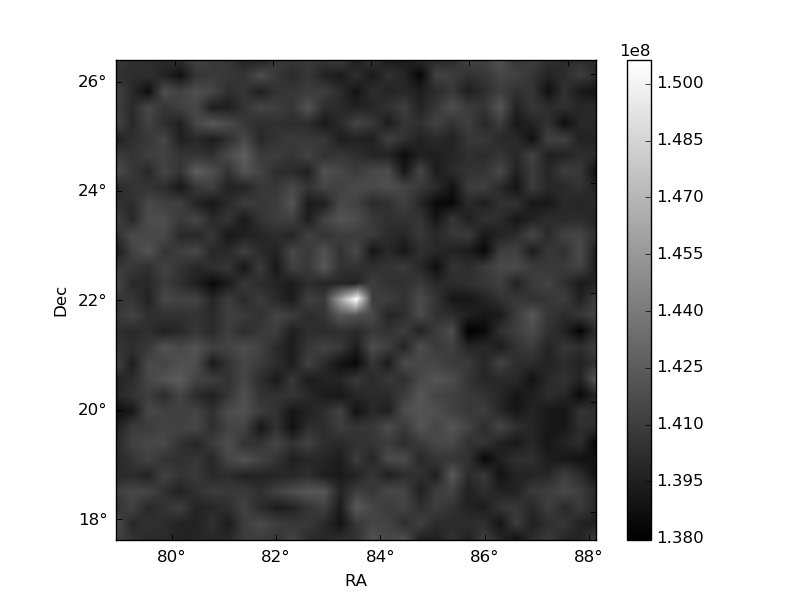
Histogram calculated using DETX and DETY for each event in the final _common_clean file
| Quadrant A | 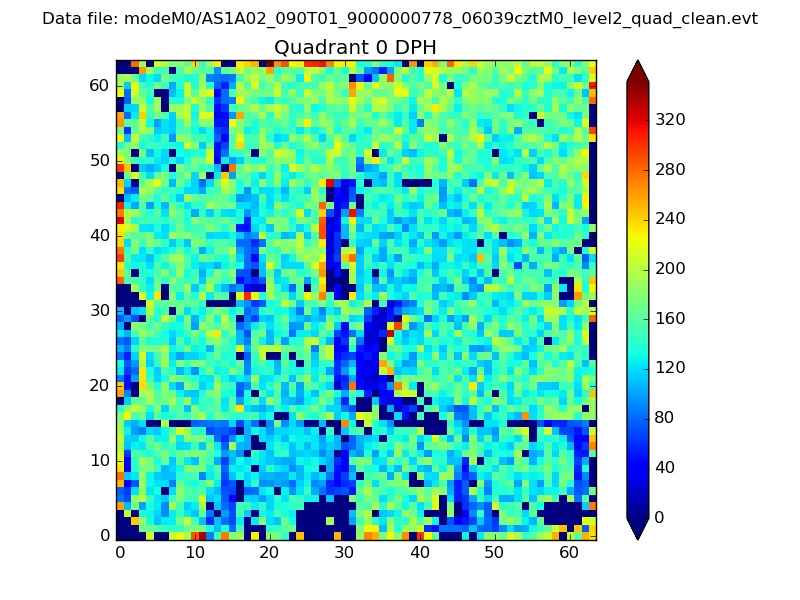 |
 |
Quadrant B |
|---|---|---|---|
| Quadrant D | 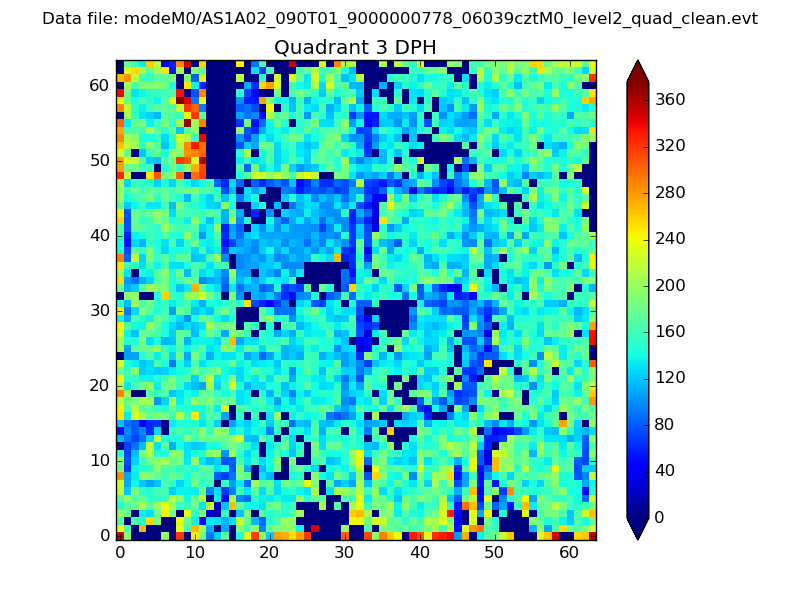 |
 |
Quadrant C |
| Plot type | Count rate plots | Images |
|---|---|---|
| Comparison with Poisson distribution Blue bars denote a histogram of data divided into 1 sec bins. Red curve is a Poisson curve with rate = median count rate of data. |
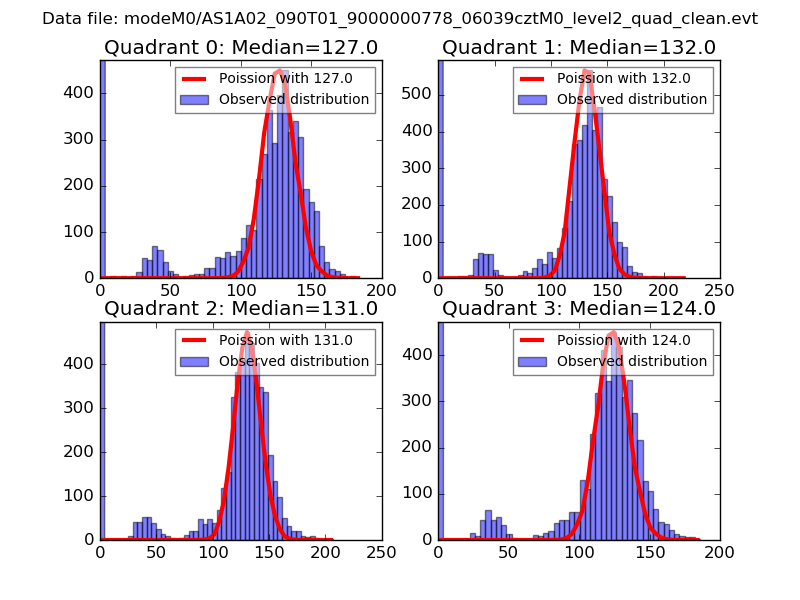 |
 |
| Quadrant-wise count rates Data is divided into 100 sec bins |
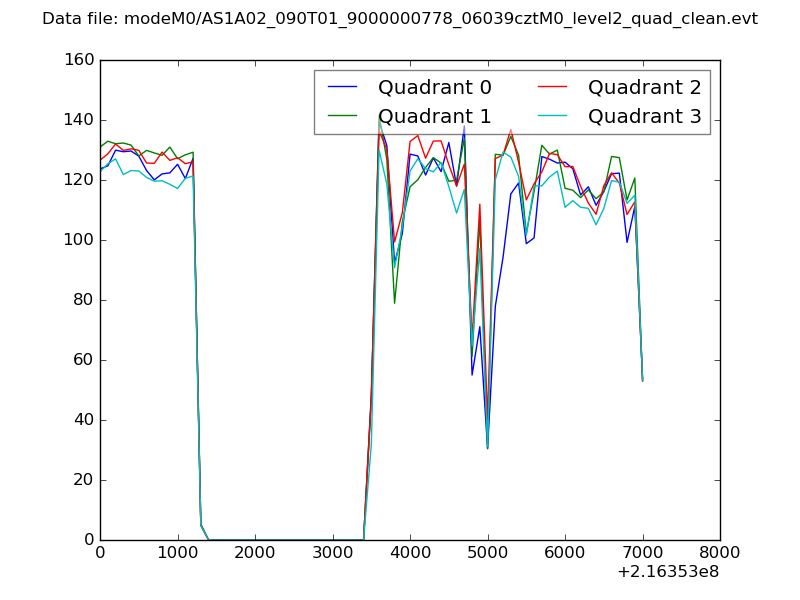 |
|
| Module-wise count rates for Quadrant A Data is divided into 100 sec bins |
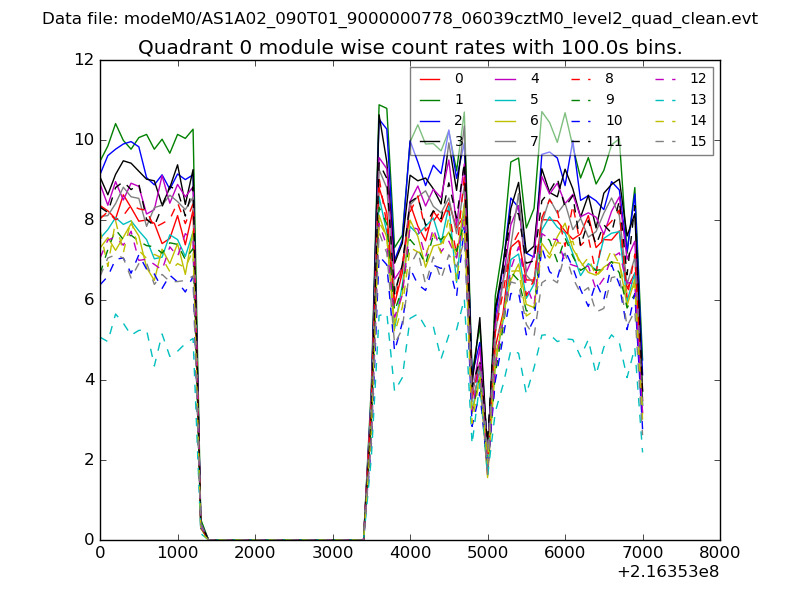 |
 |
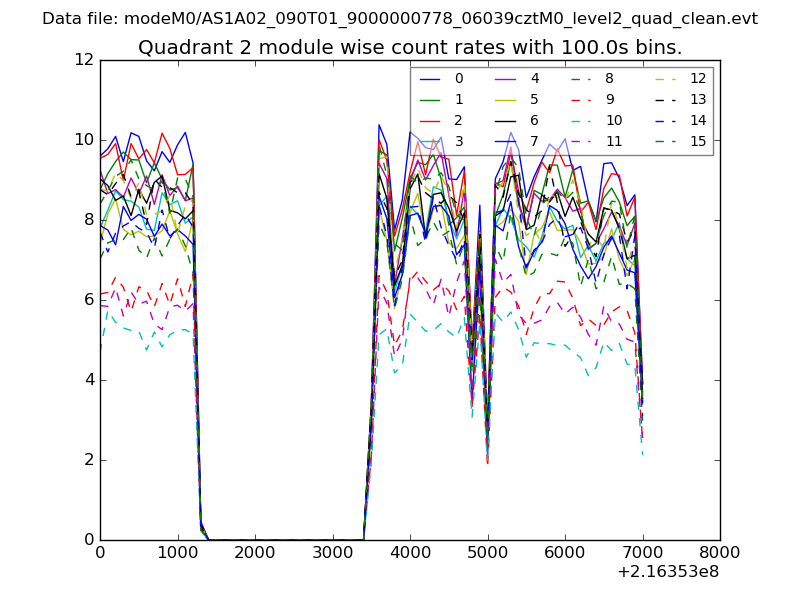
| Module-wise count rates for Quadrant B Data is divided into 100 sec bins |
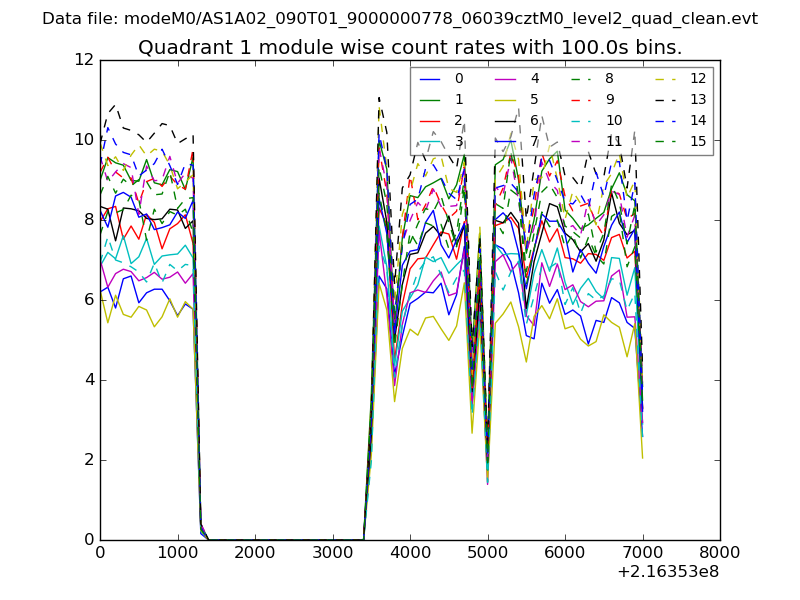 |
 |
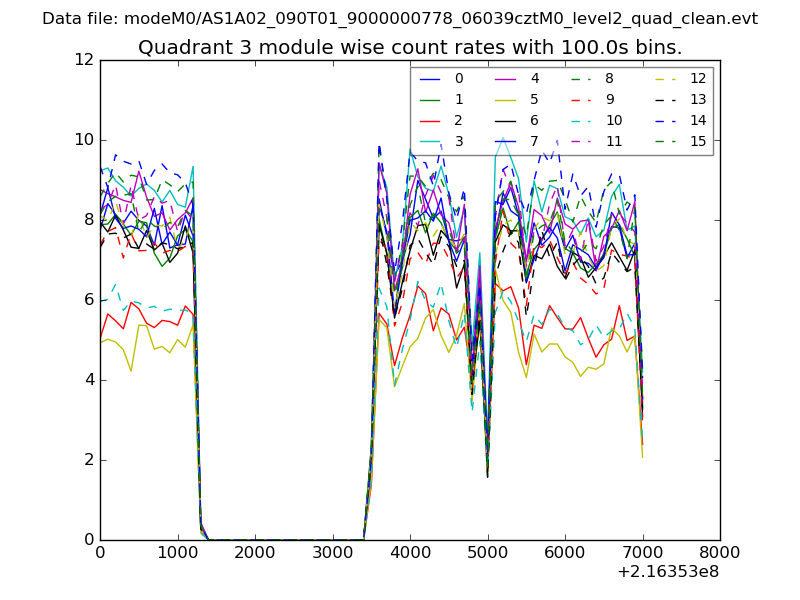
| Module-wise count rates for Quadrant C Data is divided into 100 sec bins |
 |
 |
| Module-wise count rates for Quadrant D Data is divided into 100 sec bins |
 |
 |
| Parameter | Plot |
|---|---|
| CZT HV Monitor | 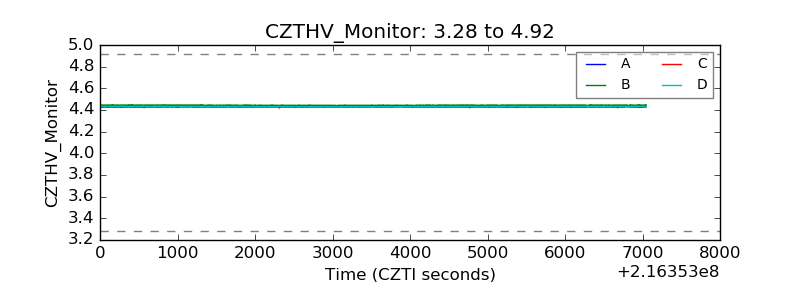 |
| D_VDD | 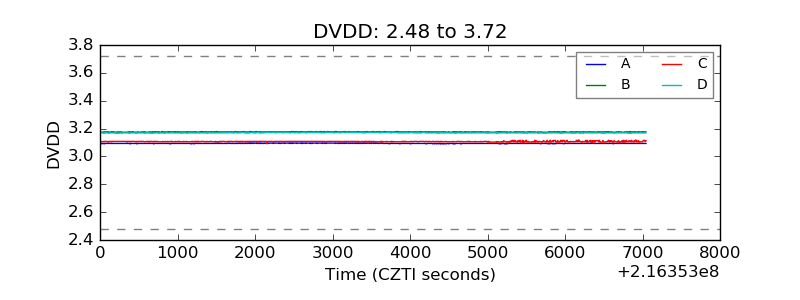 |
| Temperature 1 | 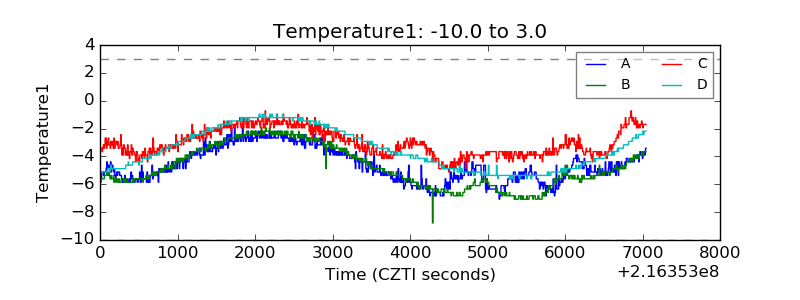 |
| Veto HV Monitor | 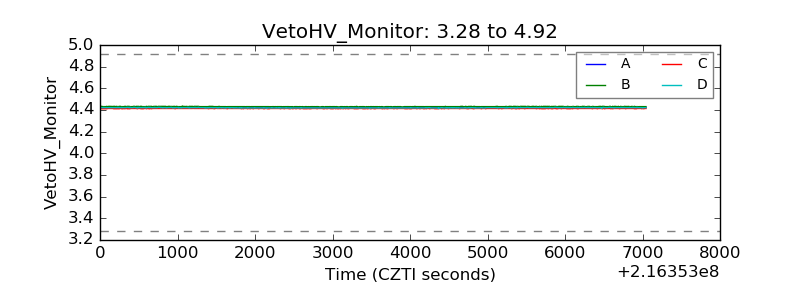 |
| Veto LLD | 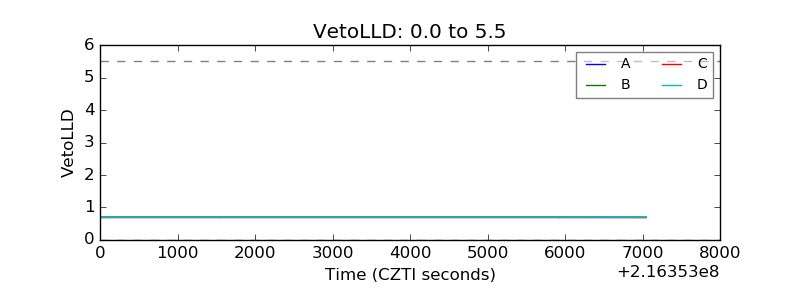 |
| Alpha Counter | 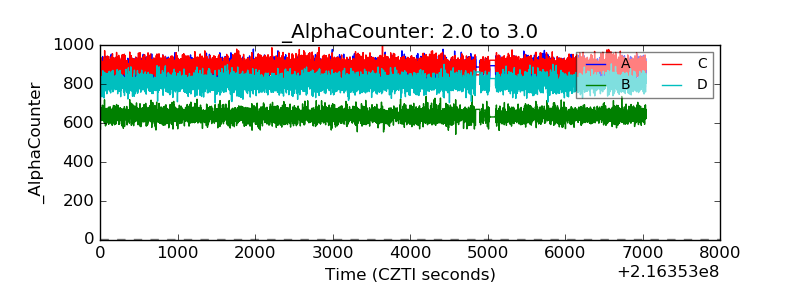 |
| _CPM_Rate | 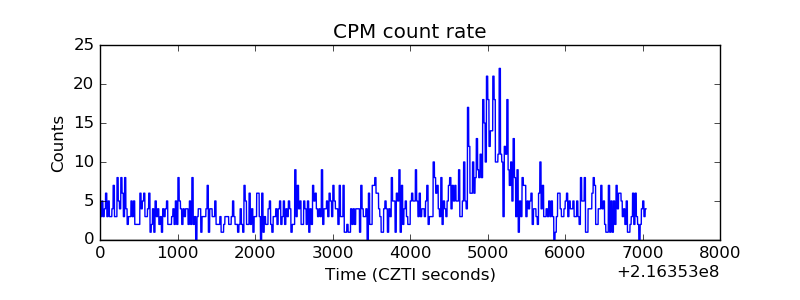 |
| CZT Counter | 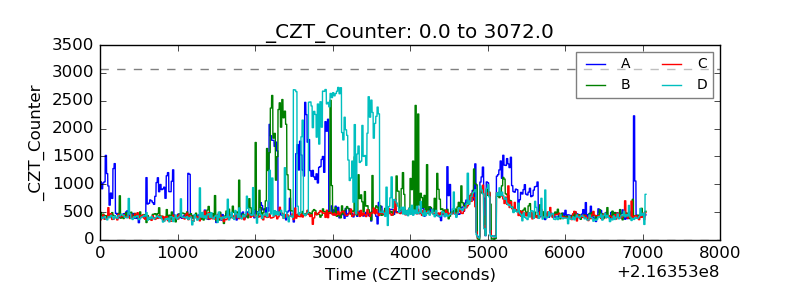 |
| +2.5 Volts monitor |  |
| +5 Volts monitor |  |
| _ROLL_ROT | 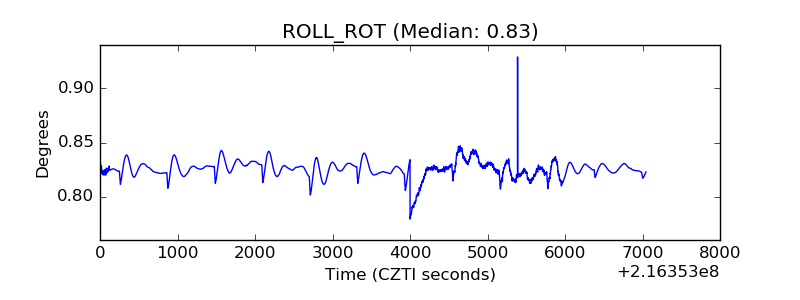 |
| _Roll_DEC | 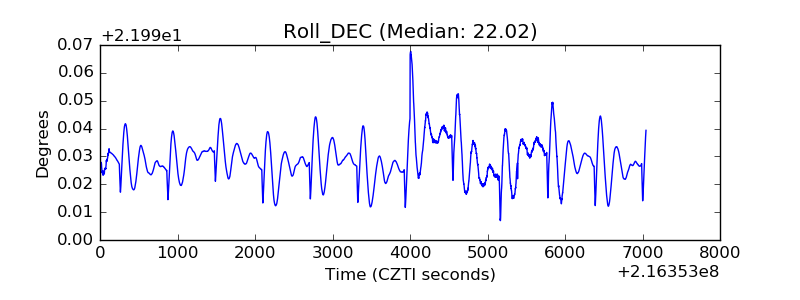 |
| _Roll_RA | 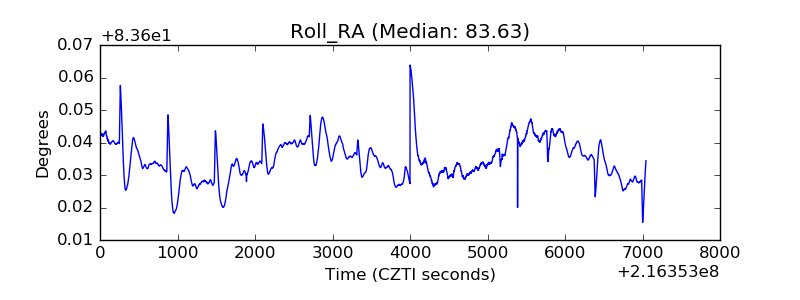 |
| Veto Counter | 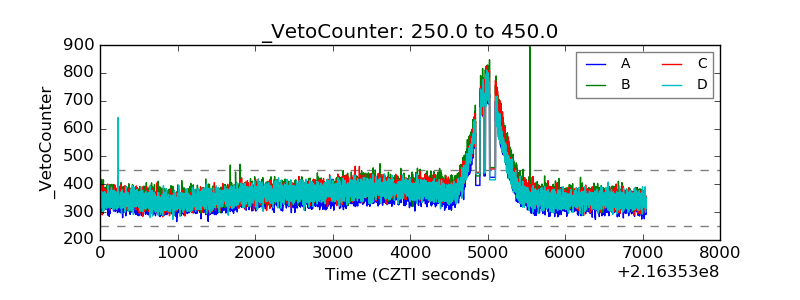 |