| Param | Original file | Final file |
|---|---|---|
| Filename | modeM0/AS1A02_090T01_9000000778_06047cztM0_level2.evt | modeM0/AS1A02_090T01_9000000778_06047cztM0_level2_quad_clean.evt |
| Size (bytes) | 428,299,200 | 79,493,760 |
| Size | 408.5 MB | 75.8 MB |
| Events in quadrant A | 3,036,303 | 501,880 |
| Events in quadrant B | 3,662,692 | 502,143 |
| Events in quadrant C | 2,955,179 | 500,218 |
| Events in quadrant D | 2,904,749 | 480,283 |
| Mode M0 | |||
|---|---|---|---|
| Quadrant | BADHDUFLAG | Total packets | Discarded packets |
| A | 0 | 13869 | 863 |
| B | 0 | 16278 | 1361 |
| C | 0 | 13514 | 849 |
| D | 0 | 13576 | 835 |
| Mode SS | |||
|---|---|---|---|
| Quadrant | BADHDUFLAG | Total packets | Discarded packets |
| A | 0 | 132 | 16 |
| B | 0 | 132 | 12 |
| C | 0 | 132 | 6 |
| D | 0 | 132 | 14 |
| Mode M9 | |||
|---|---|---|---|
| Quadrant | BADHDUFLAG | Total packets | Discarded packets |
| A | 0 | 16 | 0 |
| B | 0 | 16 | 0 |
| C | 0 | 16 | 0 |
| D | 0 | 17 | 0 |
| Quadrant | Total seconds | Saturated seconds | Saturation percentage |
|---|---|---|---|
| A | 6077 | 42 | 0.691130% |
| B | 6009 | 194 | 3.228491% |
| C | 6069 | 41 | 0.675564% |
| D | 6075 | 34 | 0.559671% |
Noise dominated data is calculated using 1-second bins in cleaned event files. If a bin has >2000 counts, and if more than 50% of those come from <1% of pixels, then it is considered to be noise-dominated and hence unusable.
| Quadrant | # 1 sec bins | Bins with >0 counts | Bins with >2000 counts | High rate bins dominated by noise | Noise dominated (total time) | Noise dominated (detector-on time) | Marked lightcurve |
|---|---|---|---|---|---|---|---|
| A | 7585 | 6401 | 1 | 1 | 0.01% | 0.02% | 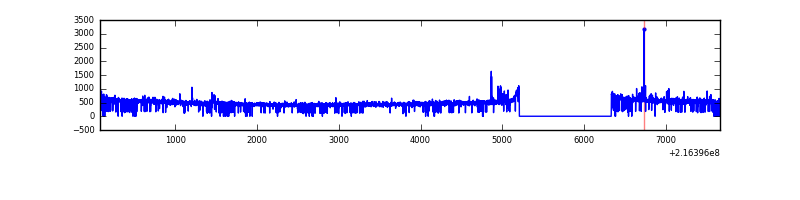 |
| B | 7585 | 6385 | 80 | 80 | 1.05% | 1.25% | 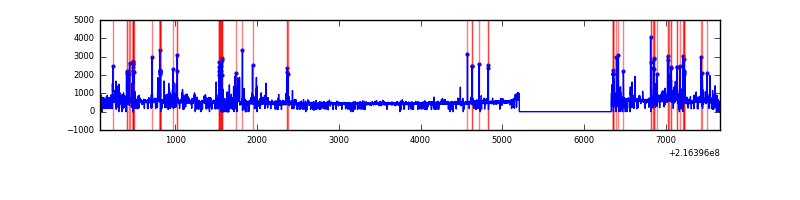 |
| C | 7585 | 6408 | 0 | 0 | 0.00% | 0.00% |  |
| D | 7584 | 6413 | 2 | 2 | 0.03% | 0.03% | 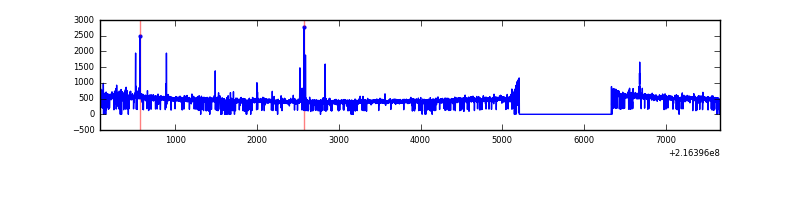 |
Top three noisy pixels from each quadrant. If the there are fewer than three noisy pixels in the level2.evt file, extra rows are filled as -1
| Pixel properties | Quadrant properties | ||||||
|---|---|---|---|---|---|---|---|
| Quadrant | DetID | PixID | Counts | Sigma | Mean | Median | Sigma |
| A | 8 | 15 | 103444 | 655.8 | 762 | 749 | 156.6 |
| A | 12 | 194 | 7322 | 41.97 | 762 | 749 | 156.6 |
| A | 0 | 226 | 7290 | 41.77 | 762 | 749 | 156.6 |
| B | 3 | 64 | 433899 | 3002.5 | 754 | 737 | 144.3 |
| B | 4 | 81 | 140360 | 967.81 | 754 | 737 | 144.3 |
| B | 15 | 204 | 119088 | 820.36 | 754 | 737 | 144.3 |
| C | 1 | 16 | 25445 | 141.11 | 748 | 754 | 175.0 |
| C | 9 | 54 | 6314 | 31.77 | 748 | 754 | 175.0 |
| C | 13 | 61 | 5971 | 29.81 | 748 | 754 | 175.0 |
| D | 8 | 195 | 46742 | 249.96 | 746 | 726 | 184.1 |
| D | 13 | 238 | 19288 | 100.83 | 746 | 726 | 184.1 |
| D | 2 | 14 | 13262 | 68.09 | 746 | 726 | 184.1 |
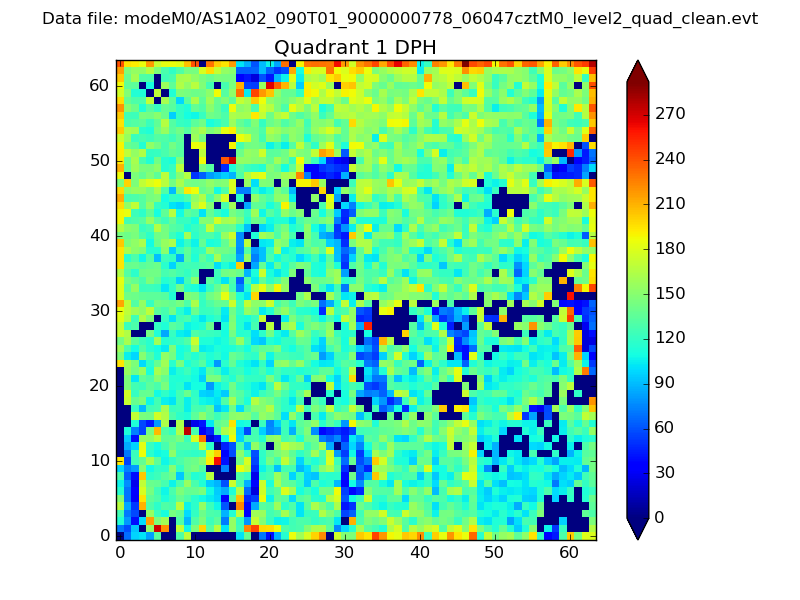
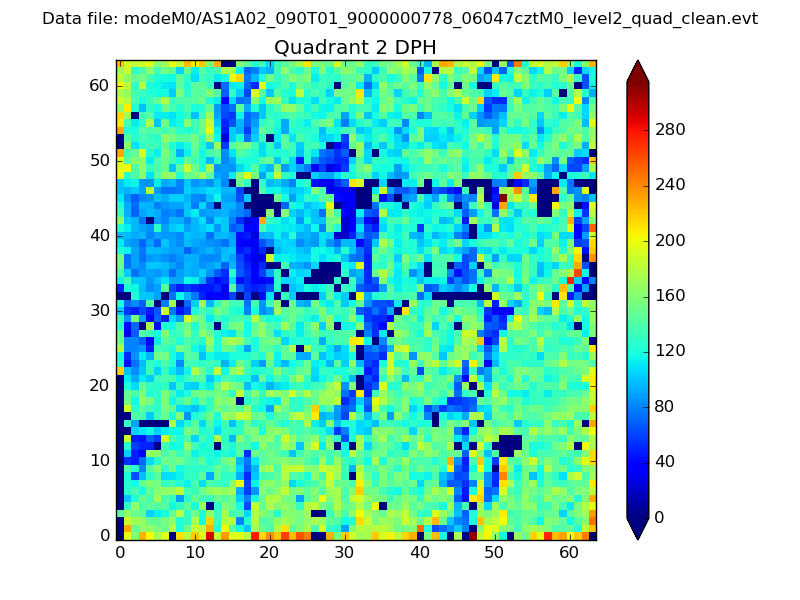
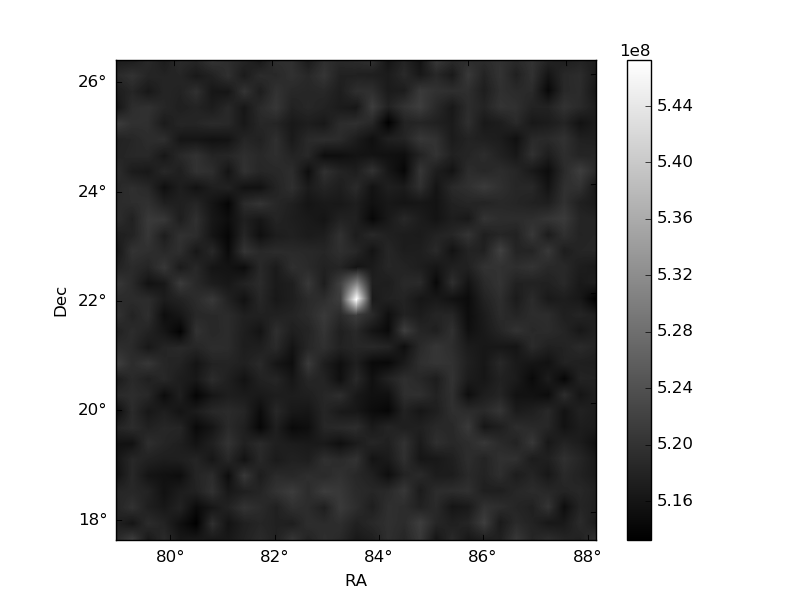
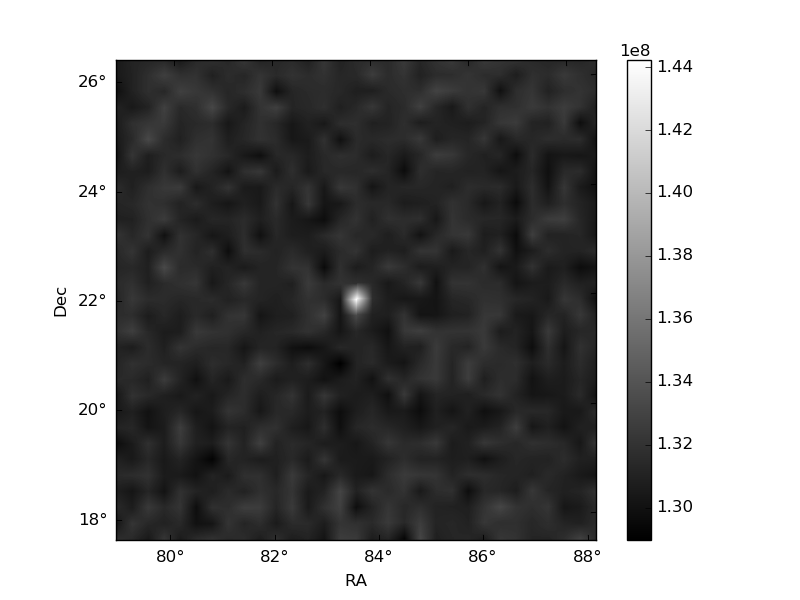
Histogram calculated using DETX and DETY for each event in the final _common_clean file
| Quadrant A | 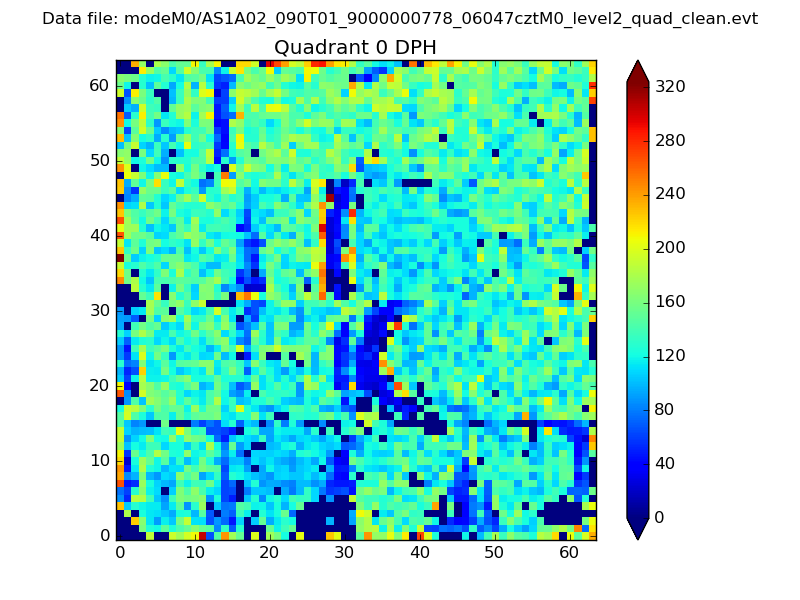 |
 |
Quadrant B |
|---|---|---|---|
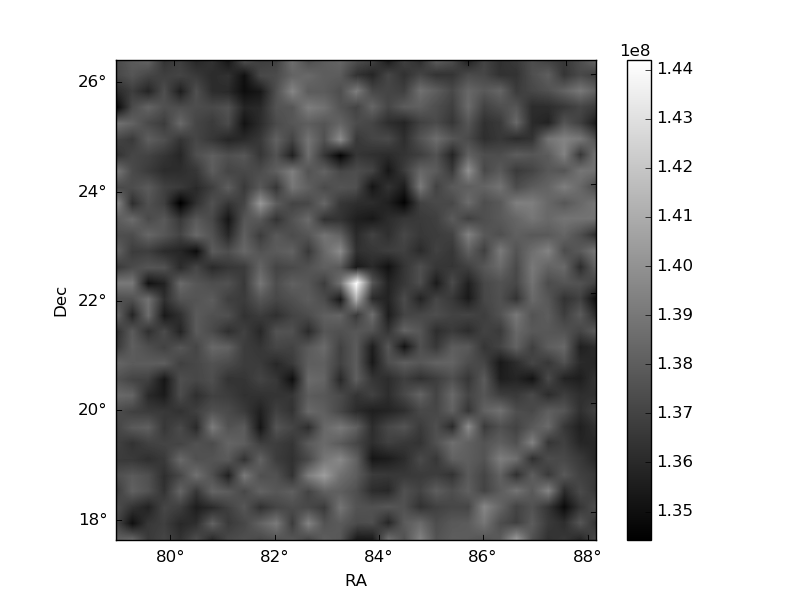
| Quadrant D | 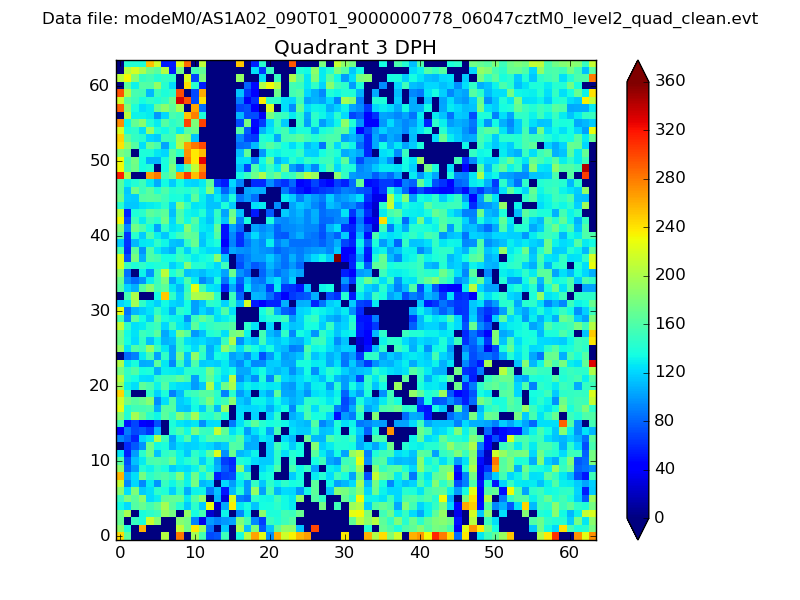 |
 |
Quadrant C |
| Plot type | Count rate plots | Images |
|---|---|---|
| Comparison with Poisson distribution Blue bars denote a histogram of data divided into 1 sec bins. Red curve is a Poisson curve with rate = median count rate of data. |
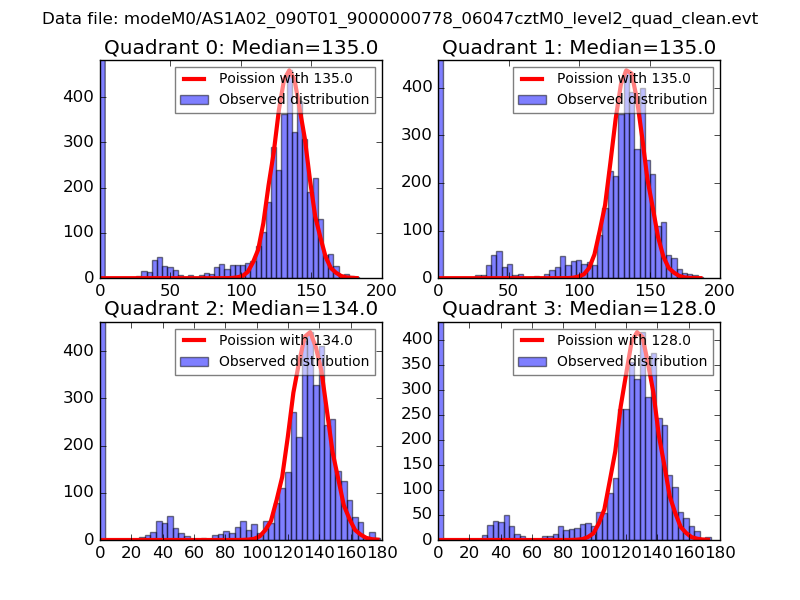 |
 |
| Quadrant-wise count rates Data is divided into 100 sec bins |
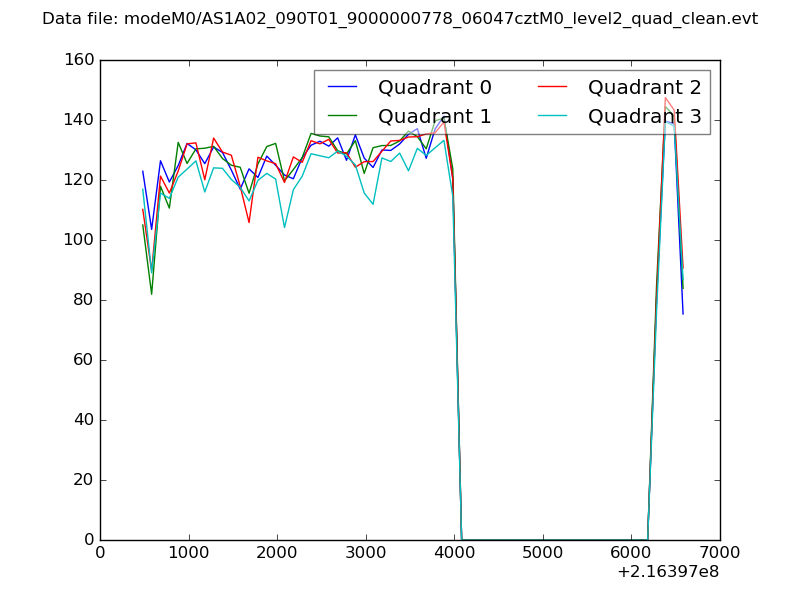 |
|
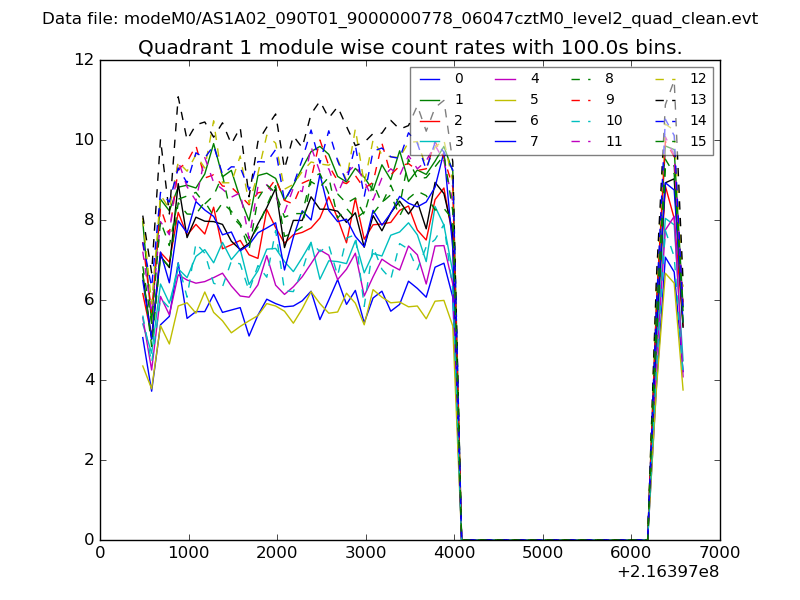
| Module-wise count rates for Quadrant A Data is divided into 100 sec bins |
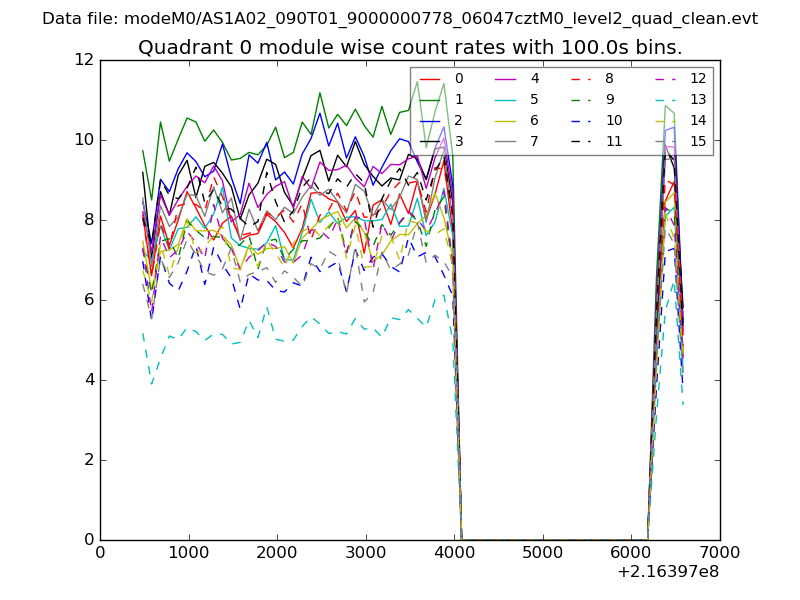 |
 |
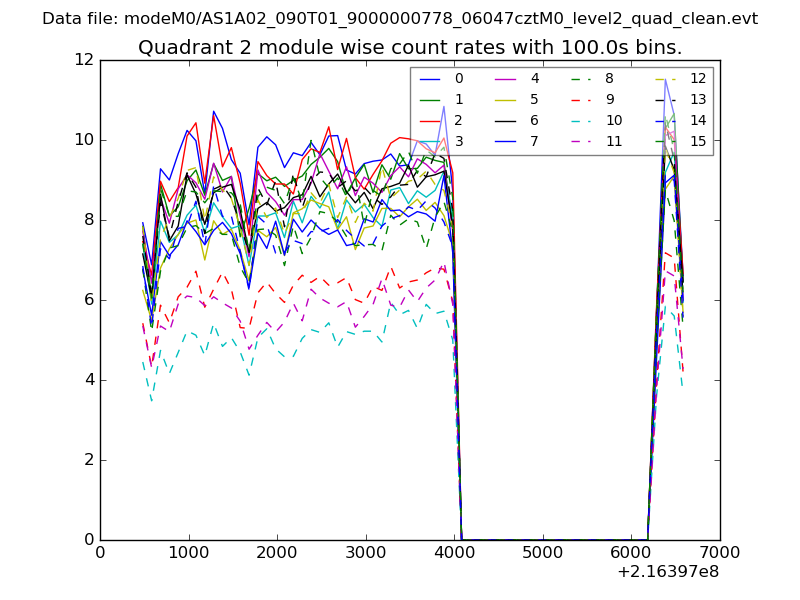
| Module-wise count rates for Quadrant B Data is divided into 100 sec bins |
 |
 |
| Module-wise count rates for Quadrant C Data is divided into 100 sec bins |
 |
 |
| Module-wise count rates for Quadrant D Data is divided into 100 sec bins |
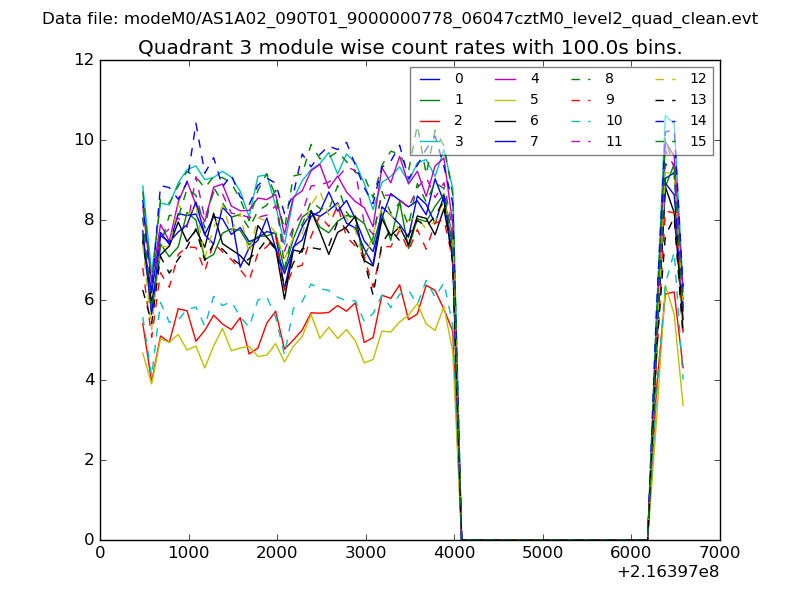 |
 |
| Parameter | Plot |
|---|---|
| CZT HV Monitor | 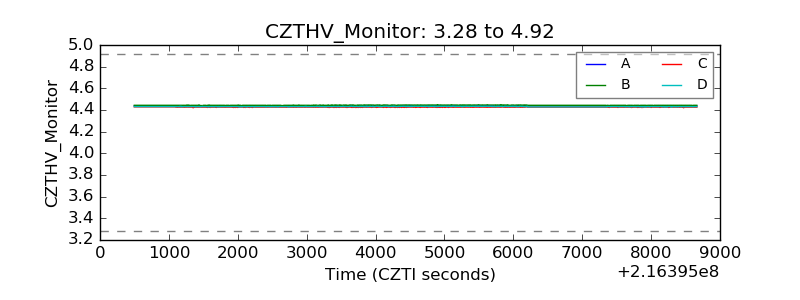 |
| D_VDD | 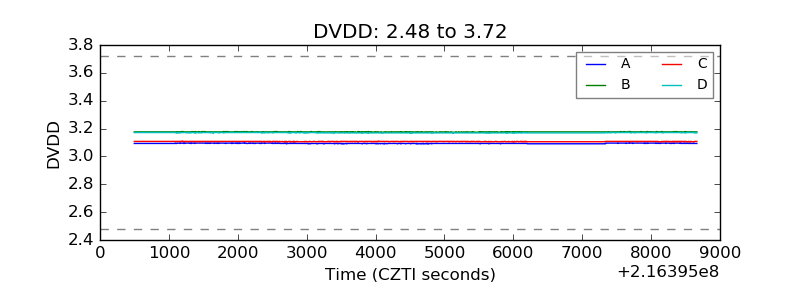 |
| Temperature 1 | 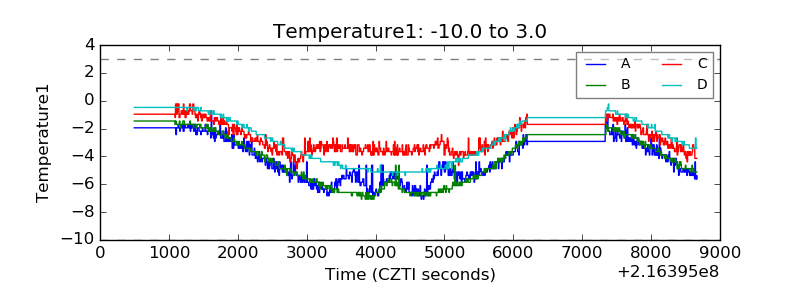 |
| Veto HV Monitor | 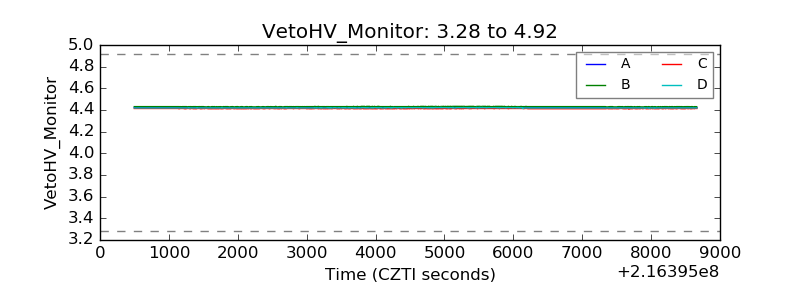 |
| Veto LLD | 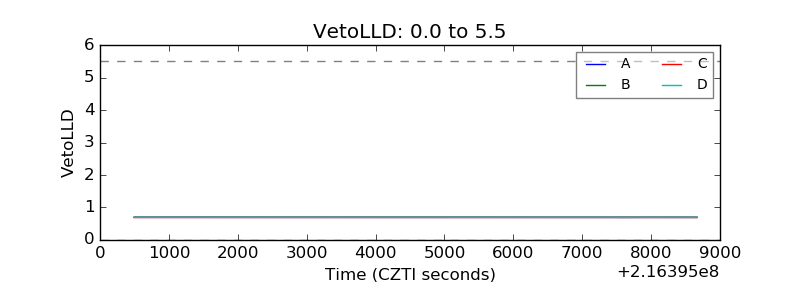 |
| Alpha Counter | 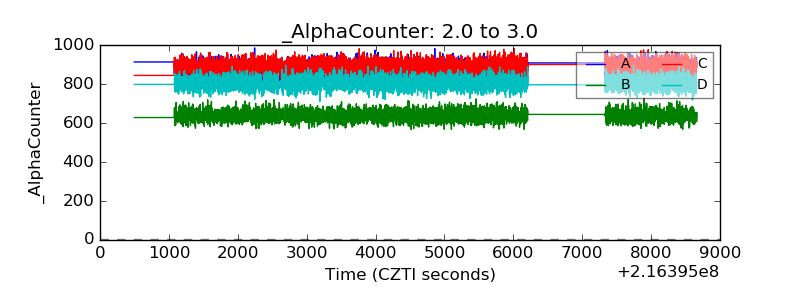 |
| _CPM_Rate | 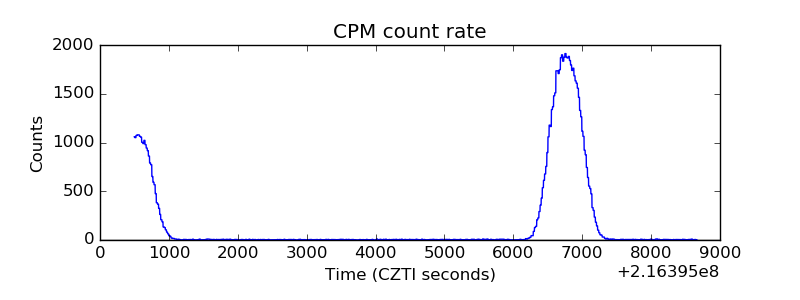 |
| CZT Counter | 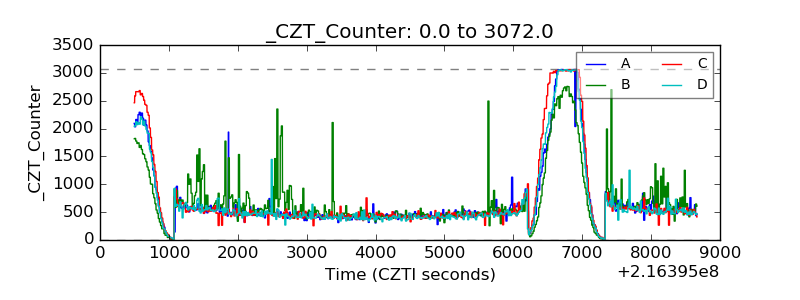 |
| +2.5 Volts monitor |  |
| +5 Volts monitor |  |
| _ROLL_ROT | 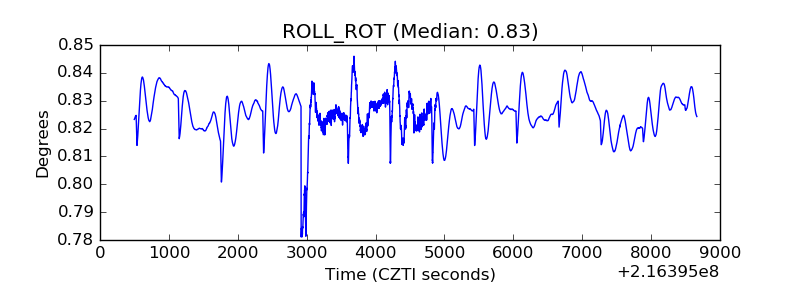 |
| _Roll_DEC | 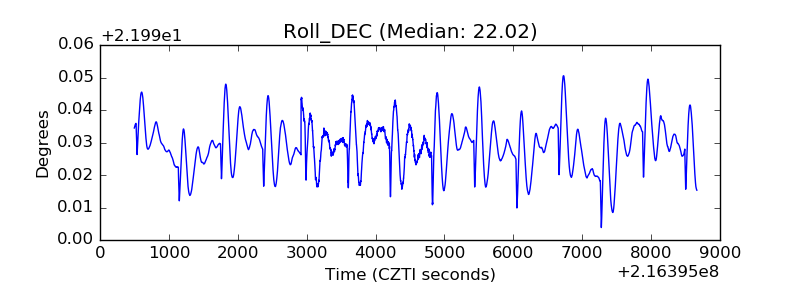 |
| _Roll_RA | 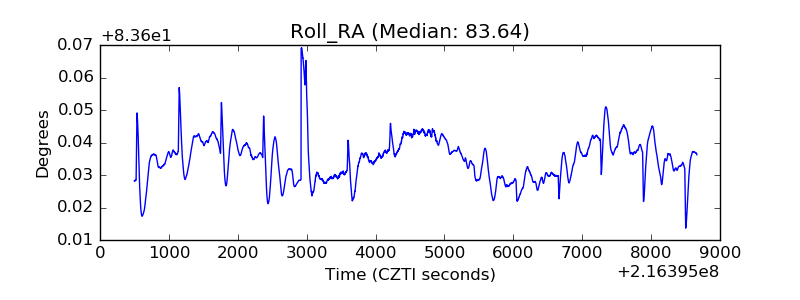 |
| Veto Counter | 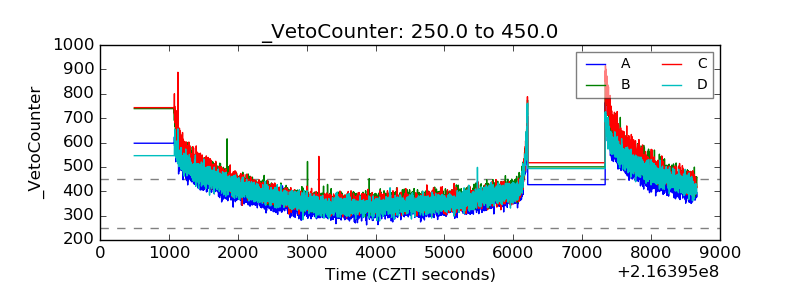 |