| Param | Original file | Final file |
|---|---|---|
| Filename | modeM0/AS1A02_090T01_9000000778_06049cztM0_level2.evt | modeM0/AS1A02_090T01_9000000778_06049cztM0_level2_quad_clean.evt |
| Size (bytes) | 405,774,720 | 104,497,920 |
| Size | 387.0 MB | 99.7 MB |
| Events in quadrant A | 2,822,714 | 694,969 |
| Events in quadrant B | 3,412,491 | 706,618 |
| Events in quadrant C | 2,816,162 | 700,826 |
| Events in quadrant D | 2,847,492 | 661,529 |
| Mode M0 | |||
|---|---|---|---|
| Quadrant | BADHDUFLAG | Total packets | Discarded packets |
| A | 0 | 11972 | 14 |
| B | 0 | 13852 | 20 |
| C | 0 | 11948 | 19 |
| D | 0 | 12324 | 15 |
| Mode SS | |||
|---|---|---|---|
| Quadrant | BADHDUFLAG | Total packets | Discarded packets |
| A | 0 | 116 | 0 |
| B | 0 | 116 | 0 |
| C | 0 | 116 | 0 |
| D | 0 | 116 | 0 |
| Mode M9 | |||
|---|---|---|---|
| Quadrant | BADHDUFLAG | Total packets | Discarded packets |
| A | 0 | 13 | 0 |
| B | 0 | 13 | 0 |
| C | 0 | 13 | 0 |
| D | 0 | 13 | 0 |
| Quadrant | Total seconds | Saturated seconds | Saturation percentage |
|---|---|---|---|
| A | 5738 | 24 | 0.418264% |
| B | 5736 | 131 | 2.283821% |
| C | 5735 | 17 | 0.296425% |
| D | 5737 | 43 | 0.749521% |
Noise dominated data is calculated using 1-second bins in cleaned event files. If a bin has >2000 counts, and if more than 50% of those come from <1% of pixels, then it is considered to be noise-dominated and hence unusable.
| Quadrant | # 1 sec bins | Bins with >0 counts | Bins with >2000 counts | High rate bins dominated by noise | Noise dominated (total time) | Noise dominated (detector-on time) | Marked lightcurve |
|---|---|---|---|---|---|---|---|
| A | 7054 | 5745 | 0 | 0 | 0.00% | 0.00% | 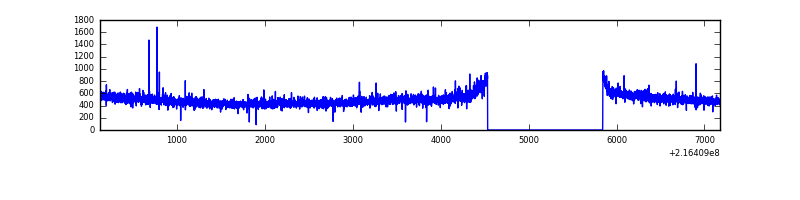 |
| B | 7054 | 5745 | 63 | 63 | 0.89% | 1.10% | 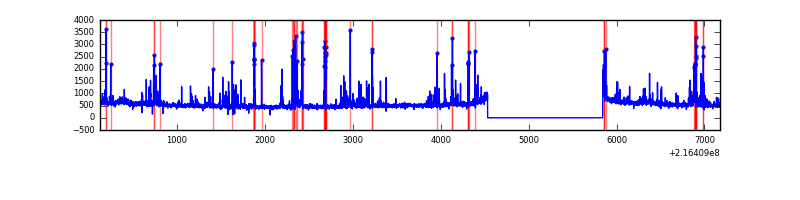 |
| C | 7054 | 5744 | 0 | 0 | 0.00% | 0.00% | 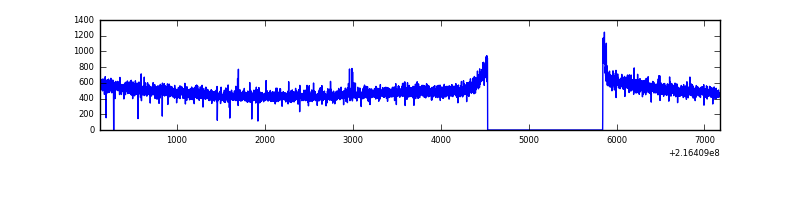 |
| D | 7054 | 5745 | 19 | 19 | 0.27% | 0.33% | 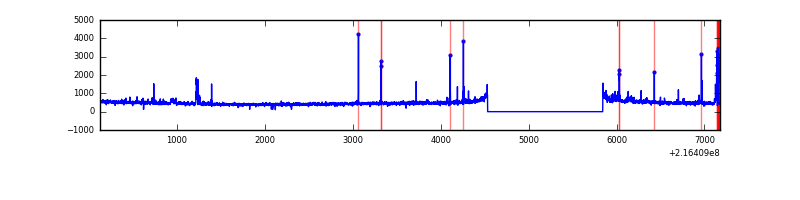 |
Top three noisy pixels from each quadrant. If the there are fewer than three noisy pixels in the level2.evt file, extra rows are filled as -1
| Pixel properties | Quadrant properties | ||||||
|---|---|---|---|---|---|---|---|
| Quadrant | DetID | PixID | Counts | Sigma | Mean | Median | Sigma |
| A | 8 | 15 | 18245 | 117.36 | 723 | 710 | 149.4 |
| A | 13 | 251 | 13971 | 88.75 | 723 | 710 | 149.4 |
| A | 15 | 234 | 8229 | 50.32 | 723 | 710 | 149.4 |
| B | 3 | 64 | 384991 | 2758.61 | 732 | 717 | 139.3 |
| B | 0 | 219 | 59019 | 418.54 | 732 | 717 | 139.3 |
| B | 4 | 81 | 49668 | 351.41 | 732 | 717 | 139.3 |
| C | 1 | 16 | 12128 | 69.27 | 712 | 720 | 164.7 |
| C | 8 | 128 | 10419 | 58.89 | 712 | 720 | 164.7 |
| C | 9 | 54 | 5707 | 30.28 | 712 | 720 | 164.7 |
| D | 2 | 33 | 71424 | 409.47 | 702 | 684 | 172.8 |
| D | 5 | 97 | 30472 | 172.42 | 702 | 684 | 172.8 |
| D | 2 | 14 | 25140 | 141.56 | 702 | 684 | 172.8 |
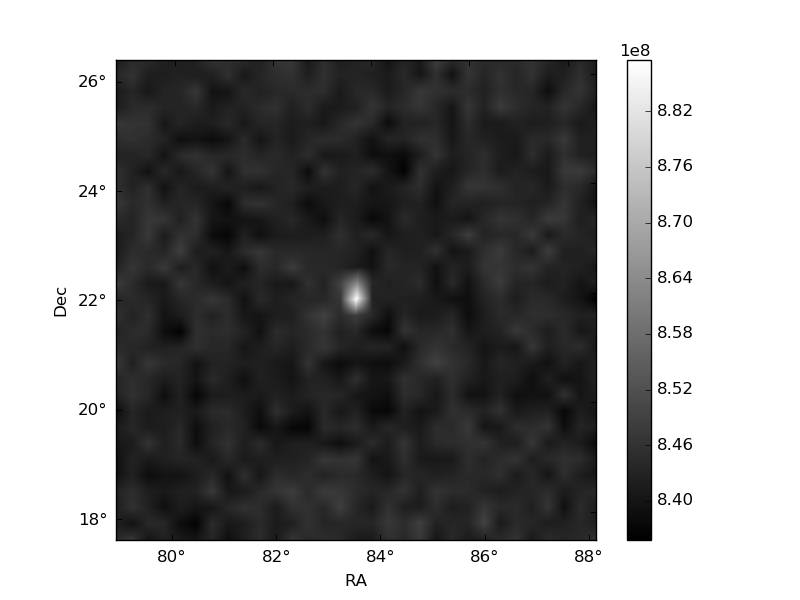
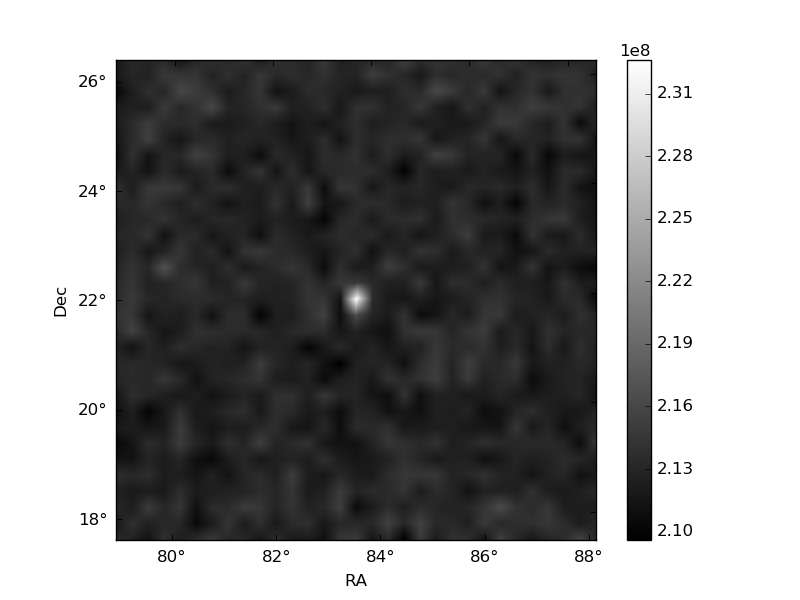
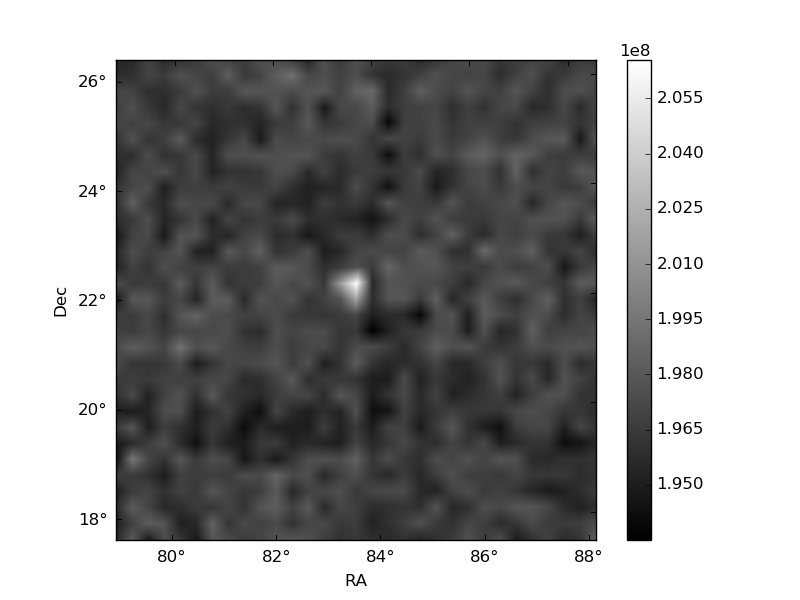
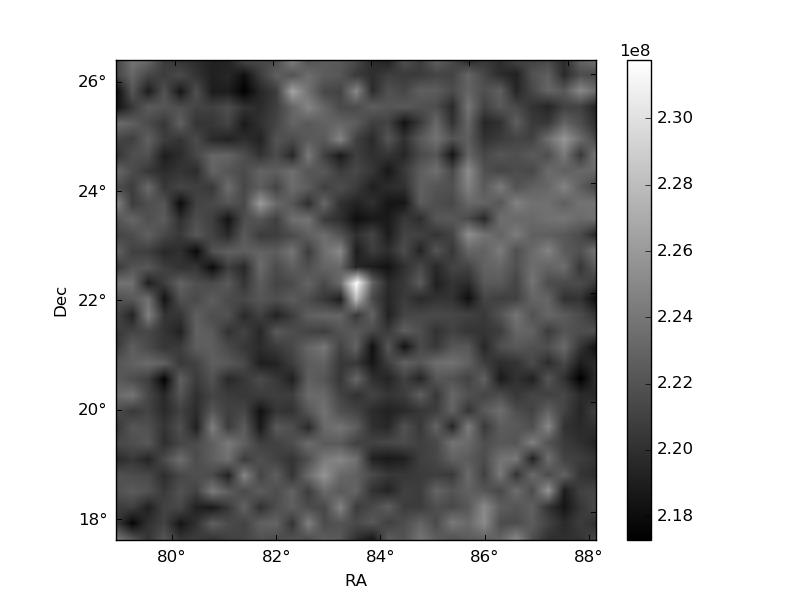
Histogram calculated using DETX and DETY for each event in the final _common_clean file
| Quadrant A | 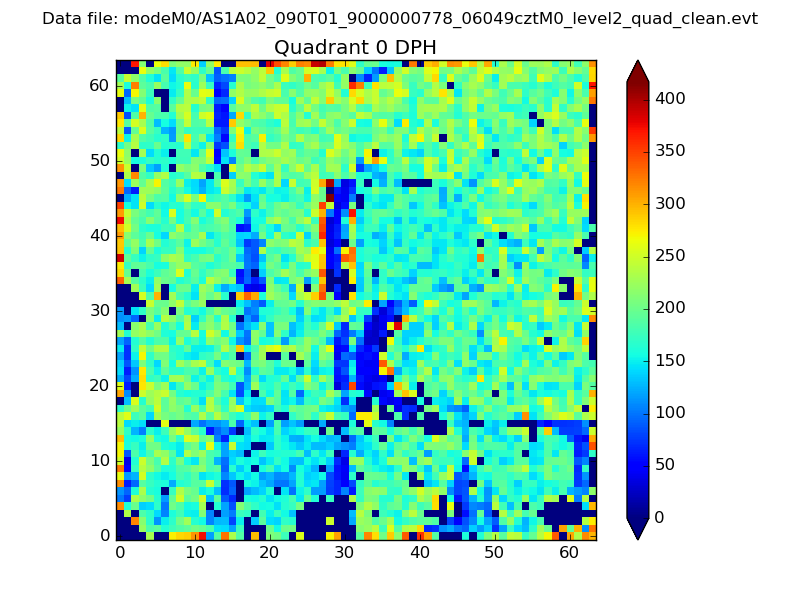 |
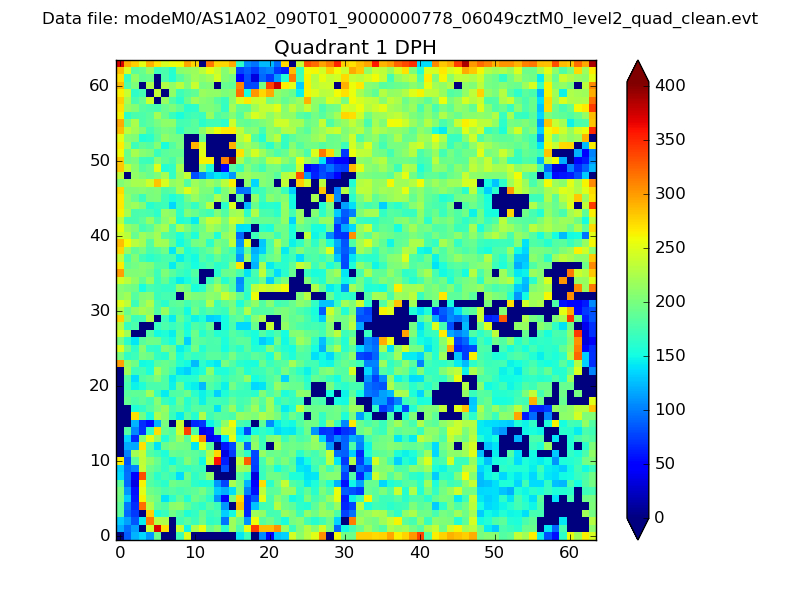 |
Quadrant B |
|---|---|---|---|
| Quadrant D | 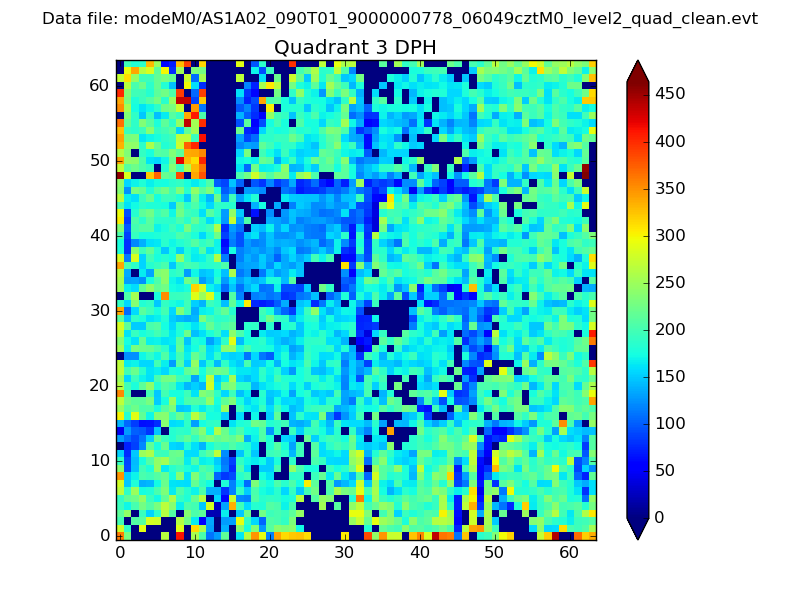 |
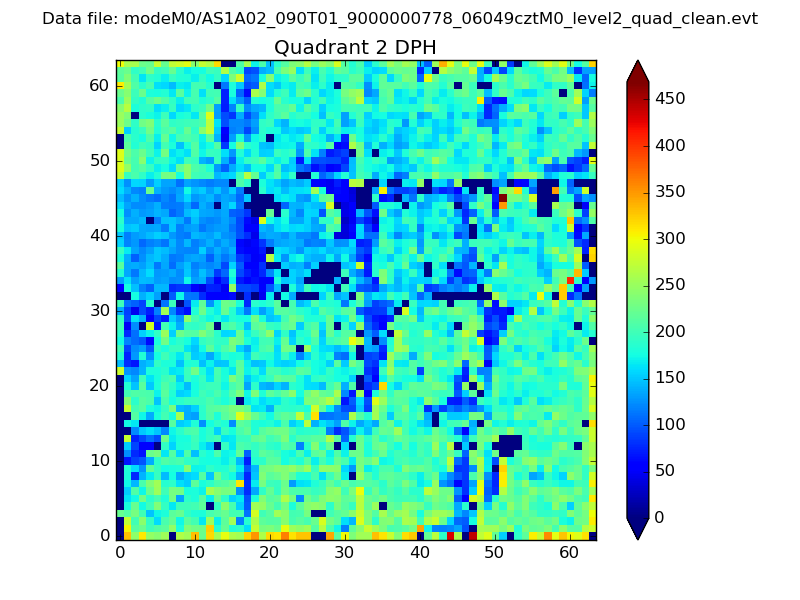 |
Quadrant C |
| Plot type | Count rate plots | Images |
|---|---|---|
| Comparison with Poisson distribution Blue bars denote a histogram of data divided into 1 sec bins. Red curve is a Poisson curve with rate = median count rate of data. |
 |
 |
| Quadrant-wise count rates Data is divided into 100 sec bins |
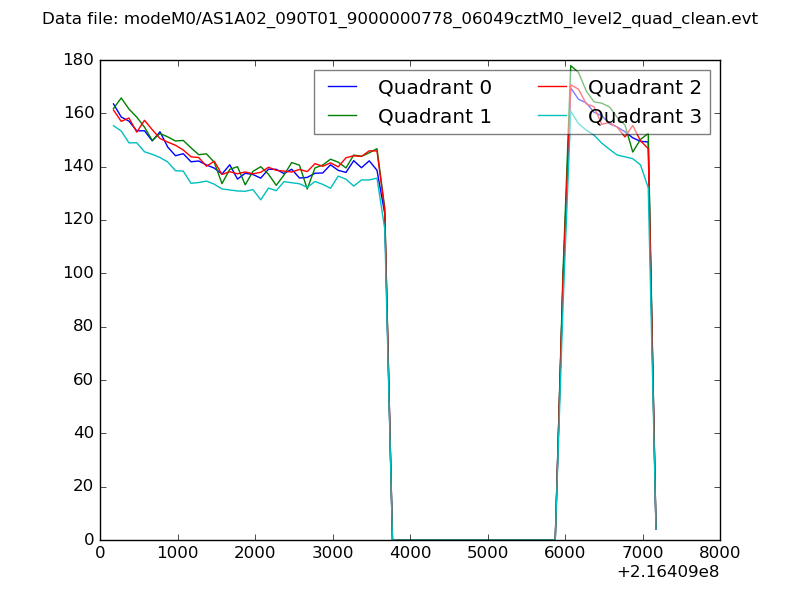 |
|
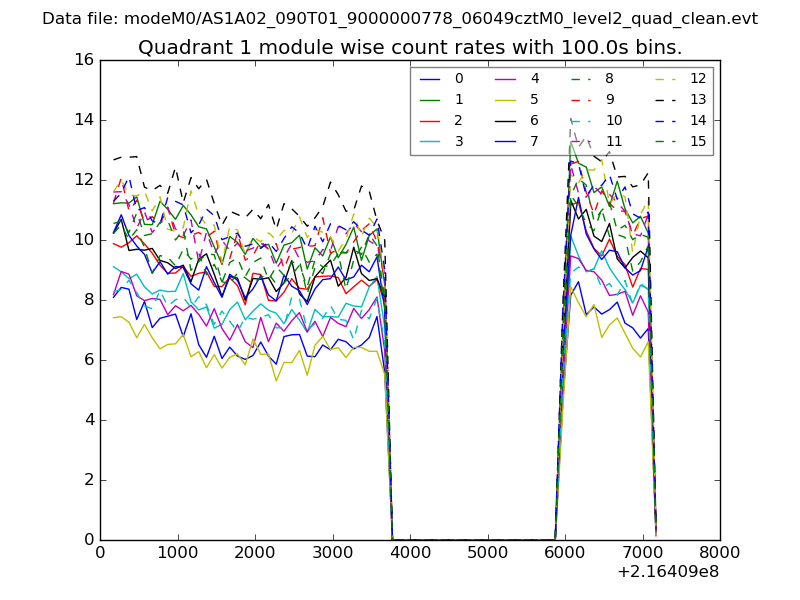
| Module-wise count rates for Quadrant A Data is divided into 100 sec bins |
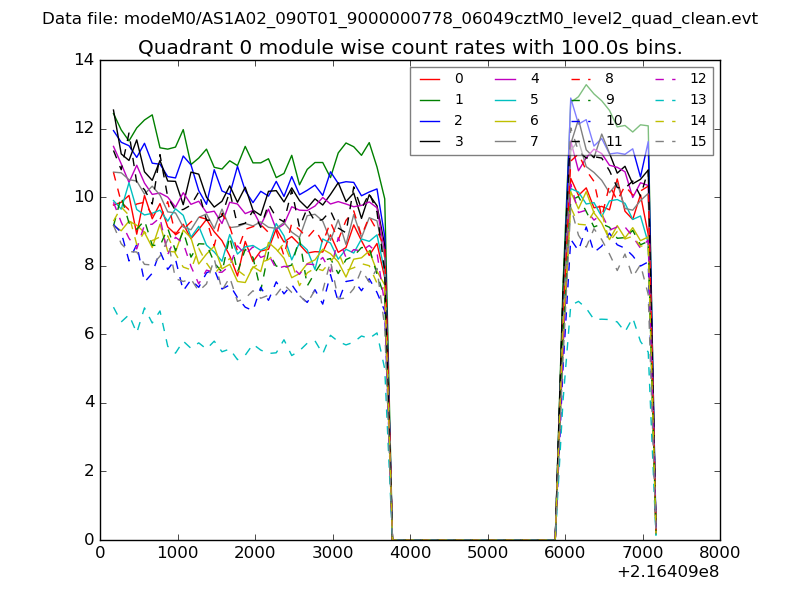 |
 |
| Module-wise count rates for Quadrant B Data is divided into 100 sec bins |
 |
 |
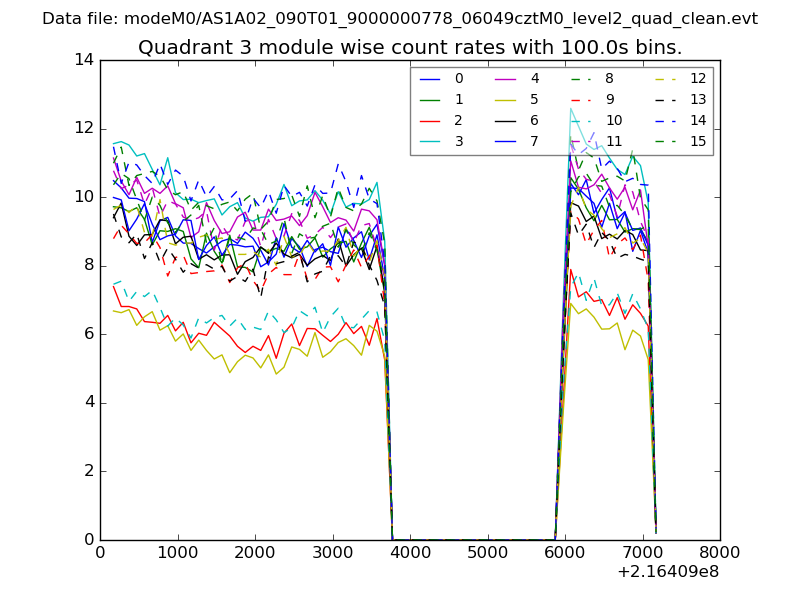
| Module-wise count rates for Quadrant C Data is divided into 100 sec bins |
 |
 |
| Module-wise count rates for Quadrant D Data is divided into 100 sec bins |
 |
 |
| Parameter | Plot |
|---|---|
| CZT HV Monitor | 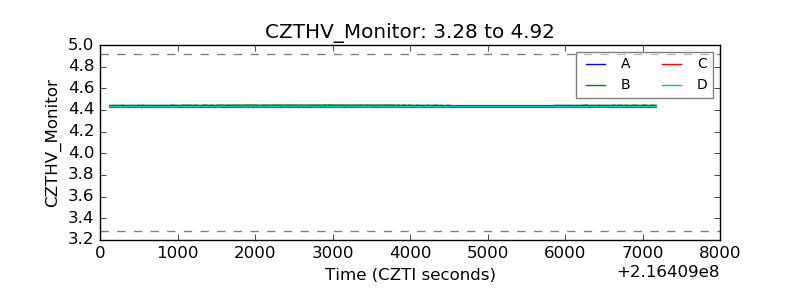 |
| D_VDD | 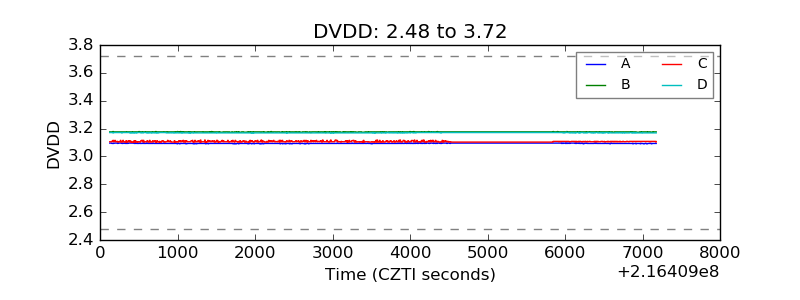 |
| Temperature 1 | 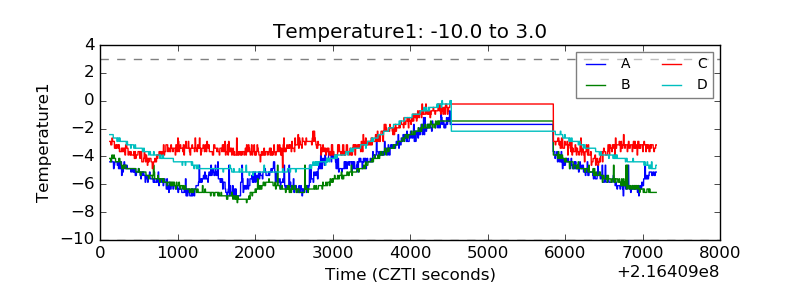 |
| Veto HV Monitor | 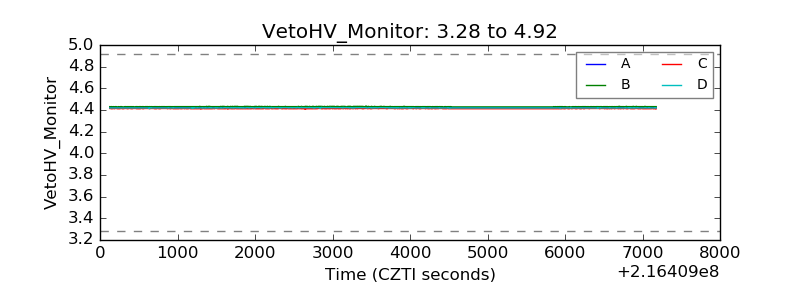 |
| Veto LLD | 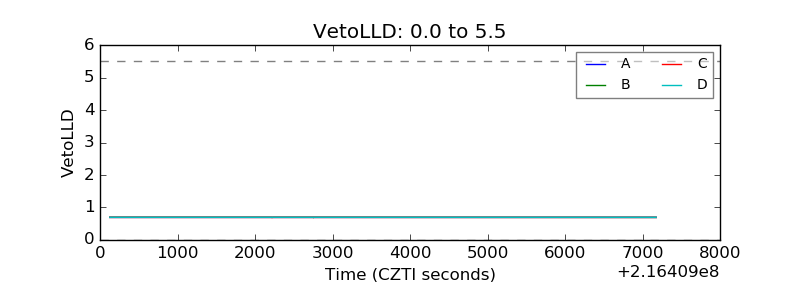 |
| Alpha Counter | 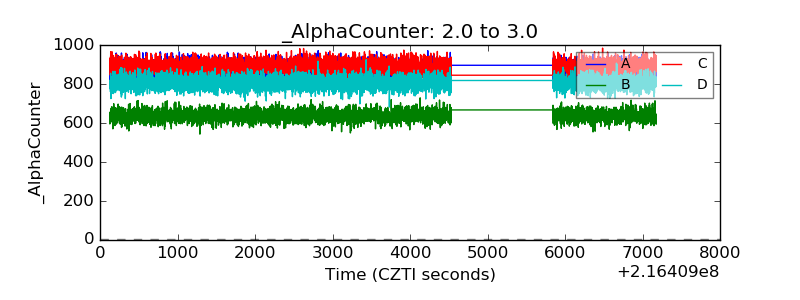 |
| _CPM_Rate | 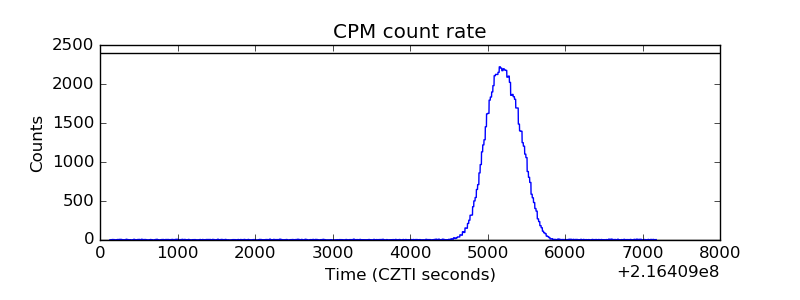 |
| CZT Counter | 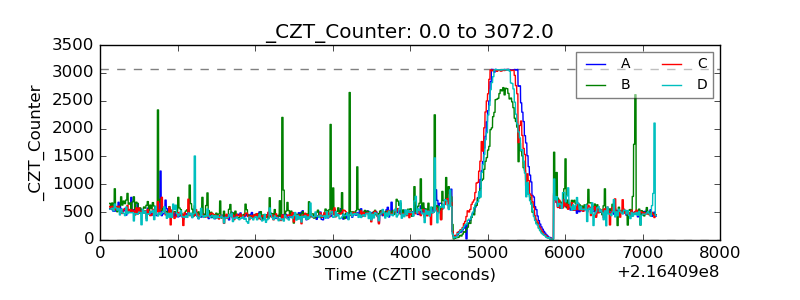 |
| +2.5 Volts monitor |  |
| +5 Volts monitor |  |
| _ROLL_ROT | 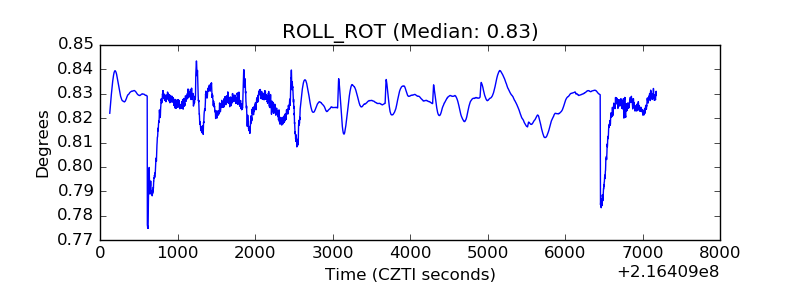 |
| _Roll_DEC | 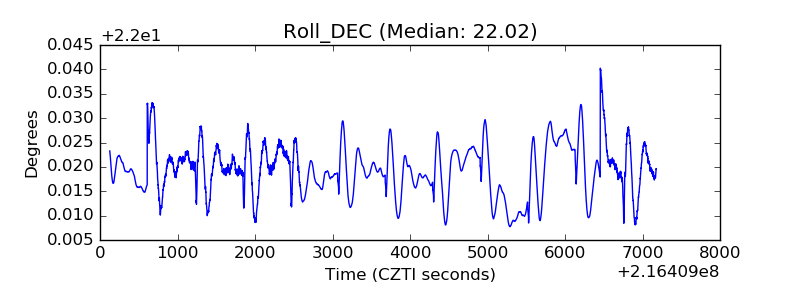 |
| _Roll_RA | 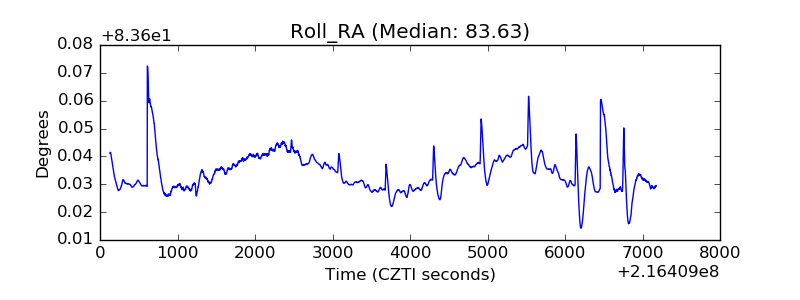 |
| Veto Counter |  |