| Param | Original file | Final file |
|---|---|---|
| Filename | modeM0/AS1A02_090T01_9000000778_06050cztM0_level2.evt | modeM0/AS1A02_090T01_9000000778_06050cztM0_level2_quad_clean.evt |
| Size (bytes) | 441,023,040 | 109,664,640 |
| Size | 420.6 MB | 104.6 MB |
| Events in quadrant A | 3,075,690 | 726,248 |
| Events in quadrant B | 3,508,100 | 746,783 |
| Events in quadrant C | 3,046,929 | 732,092 |
| Events in quadrant D | 3,301,322 | 680,417 |
| Mode M0 | |||
|---|---|---|---|
| Quadrant | BADHDUFLAG | Total packets | Discarded packets |
| A | 0 | 13102 | 5 |
| B | 0 | 14446 | 2 |
| C | 0 | 13083 | 4 |
| D | 0 | 14006 | 2 |
| Mode SS | |||
|---|---|---|---|
| Quadrant | BADHDUFLAG | Total packets | Discarded packets |
| A | 0 | 126 | 0 |
| B | 0 | 126 | 0 |
| C | 0 | 126 | 0 |
| D | 0 | 126 | 0 |
| Mode M9 | |||
|---|---|---|---|
| Quadrant | BADHDUFLAG | Total packets | Discarded packets |
| A | 0 | 15 | 0 |
| B | 0 | 15 | 0 |
| C | 0 | 15 | 0 |
| D | 0 | 16 | 0 |
| Quadrant | Total seconds | Saturated seconds | Saturation percentage |
|---|---|---|---|
| A | 6249 | 20 | 0.320051% |
| B | 6250 | 100 | 1.600000% |
| C | 6249 | 17 | 0.272044% |
| D | 6250 | 113 | 1.808000% |
Noise dominated data is calculated using 1-second bins in cleaned event files. If a bin has >2000 counts, and if more than 50% of those come from <1% of pixels, then it is considered to be noise-dominated and hence unusable.
| Quadrant | # 1 sec bins | Bins with >0 counts | Bins with >2000 counts | High rate bins dominated by noise | Noise dominated (total time) | Noise dominated (detector-on time) | Marked lightcurve |
|---|---|---|---|---|---|---|---|
| A | 7605 | 6251 | 0 | 0 | 0.00% | 0.00% | 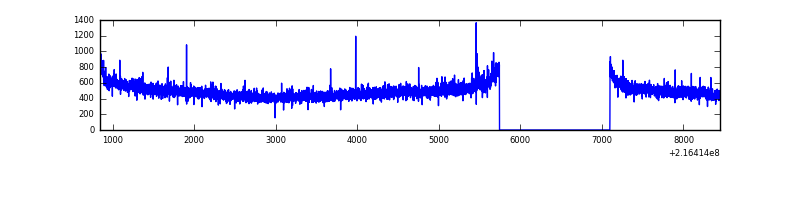 |
| B | 7605 | 6251 | 35 | 35 | 0.46% | 0.56% | 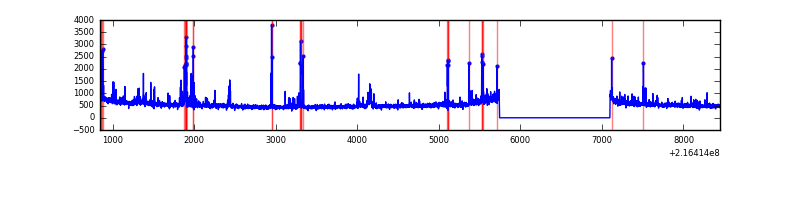 |
| C | 7605 | 6251 | 0 | 0 | 0.00% | 0.00% | 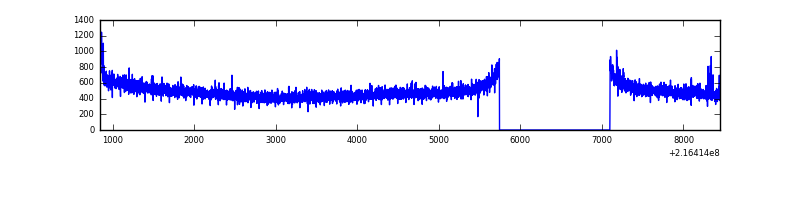 |
| D | 7605 | 6251 | 80 | 80 | 1.05% | 1.28% | 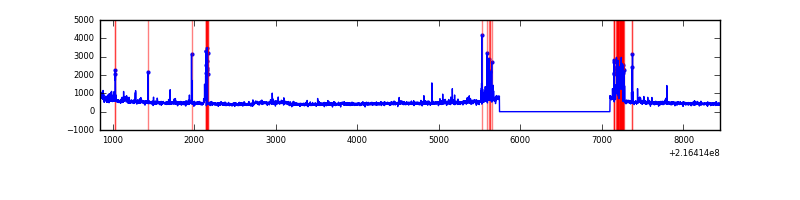 |
Top three noisy pixels from each quadrant. If the there are fewer than three noisy pixels in the level2.evt file, extra rows are filled as -1
| Pixel properties | Quadrant properties | ||||||
|---|---|---|---|---|---|---|---|
| Quadrant | DetID | PixID | Counts | Sigma | Mean | Median | Sigma |
| A | 8 | 15 | 19025 | 112.52 | 790 | 777 | 162.2 |
| A | 0 | 254 | 9022 | 50.84 | 790 | 777 | 162.2 |
| A | 0 | 226 | 7617 | 42.18 | 790 | 777 | 162.2 |
| B | 3 | 64 | 265930 | 1730.96 | 805 | 790 | 153.2 |
| B | 0 | 214 | 34922 | 222.83 | 805 | 790 | 153.2 |
| B | 15 | 204 | 27751 | 176.01 | 805 | 790 | 153.2 |
| C | 1 | 16 | 28066 | 151.78 | 774 | 781 | 179.8 |
| C | 13 | 61 | 6239 | 30.36 | 774 | 781 | 179.8 |
| C | 8 | 79 | 2535 | 9.76 | 774 | 781 | 179.8 |
| D | 13 | 169 | 206154 | 1094.6 | 758 | 736 | 187.7 |
| D | 5 | 97 | 80513 | 425.1 | 758 | 736 | 187.7 |
| D | 2 | 33 | 47975 | 251.72 | 758 | 736 | 187.7 |
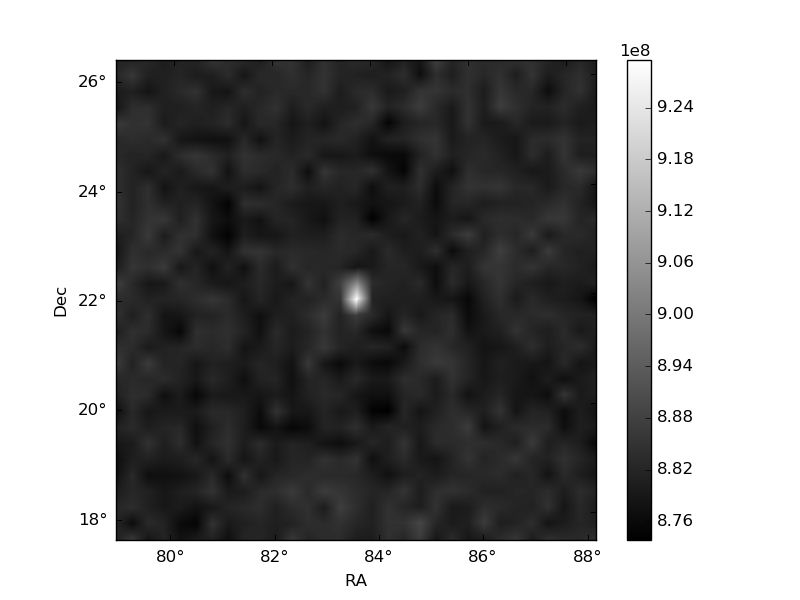
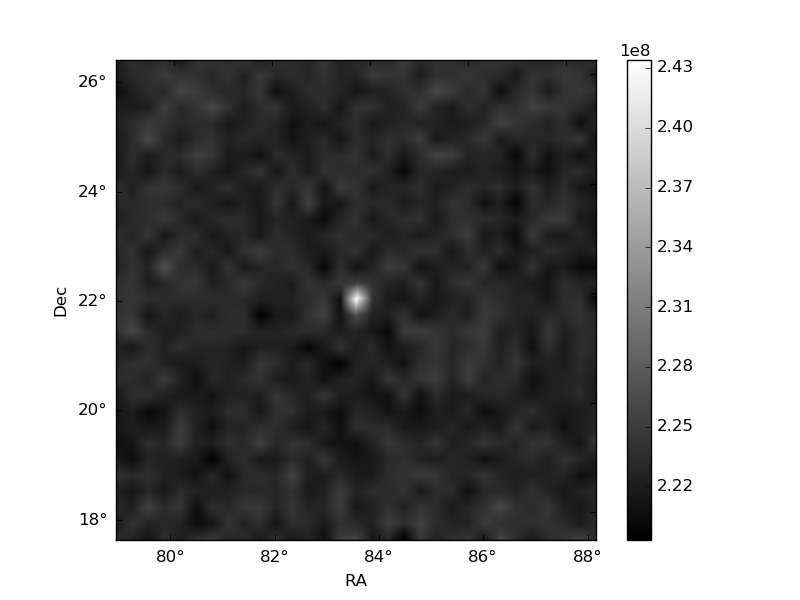
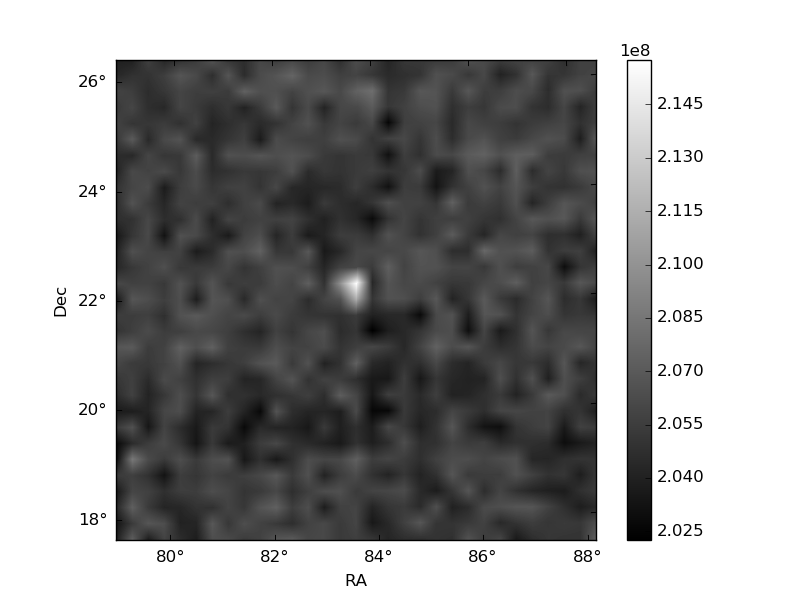
Histogram calculated using DETX and DETY for each event in the final _common_clean file
| Quadrant A | 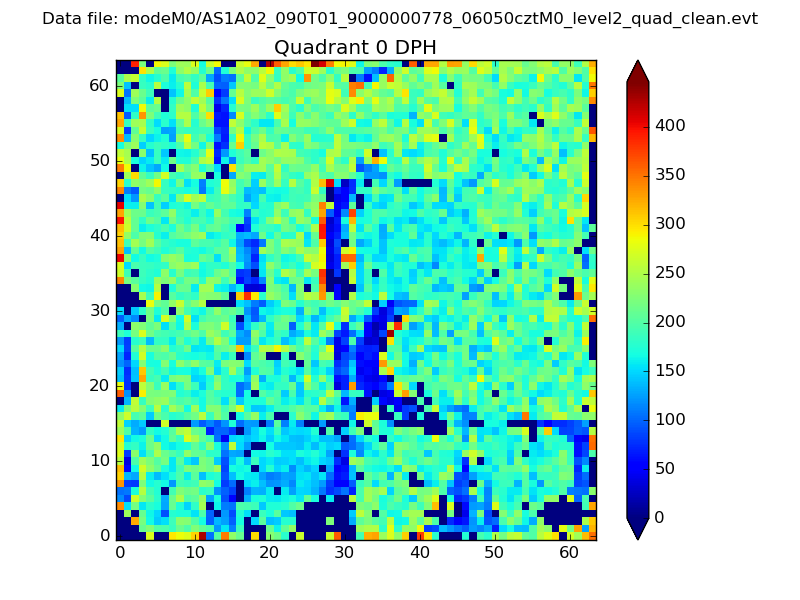 |
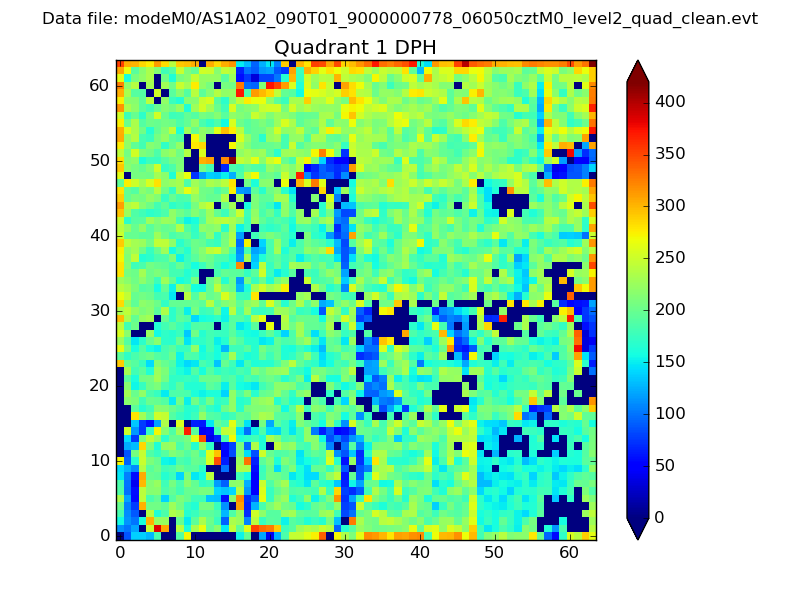 |
Quadrant B |
|---|---|---|---|
| Quadrant D | 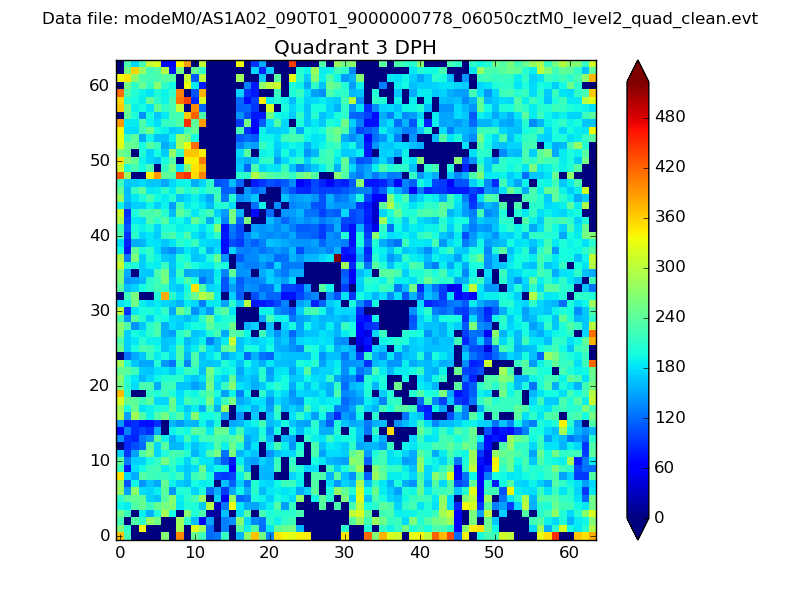 |
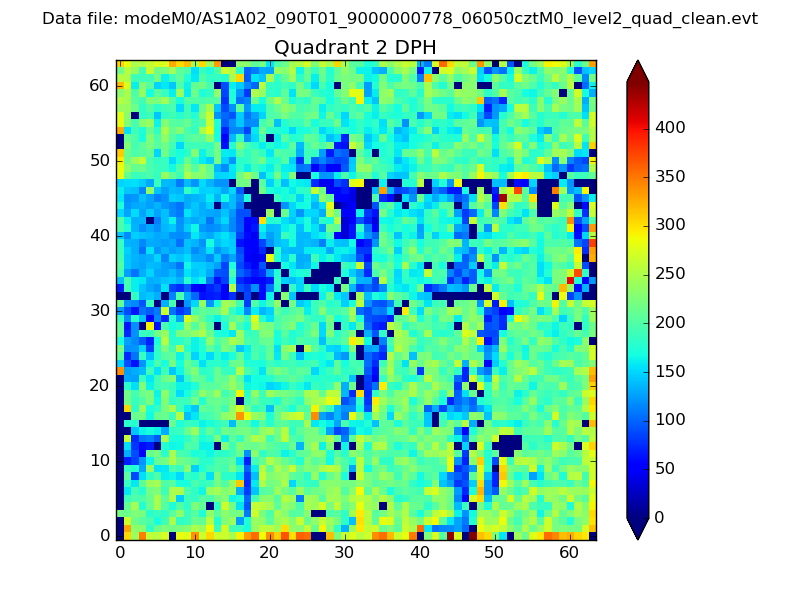 |
Quadrant C |
| Plot type | Count rate plots | Images |
|---|---|---|
| Comparison with Poisson distribution Blue bars denote a histogram of data divided into 1 sec bins. Red curve is a Poisson curve with rate = median count rate of data. |
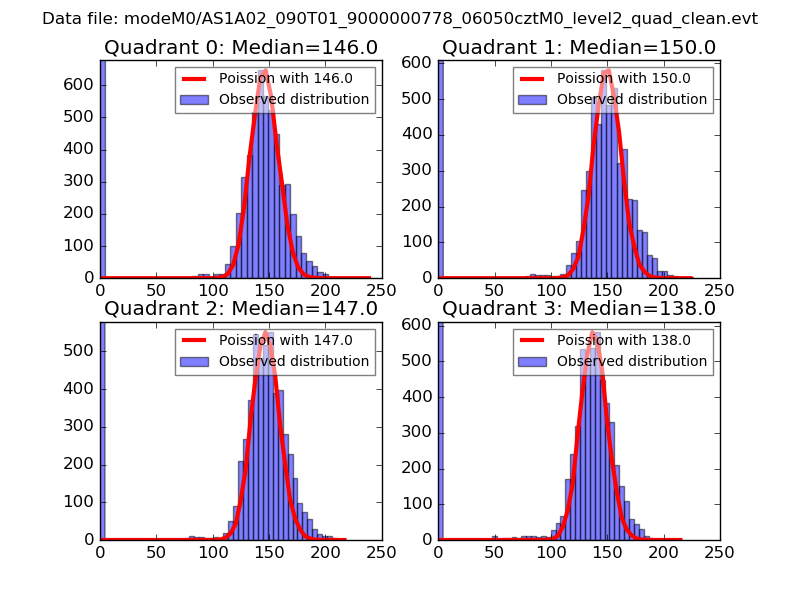 |
 |
| Quadrant-wise count rates Data is divided into 100 sec bins |
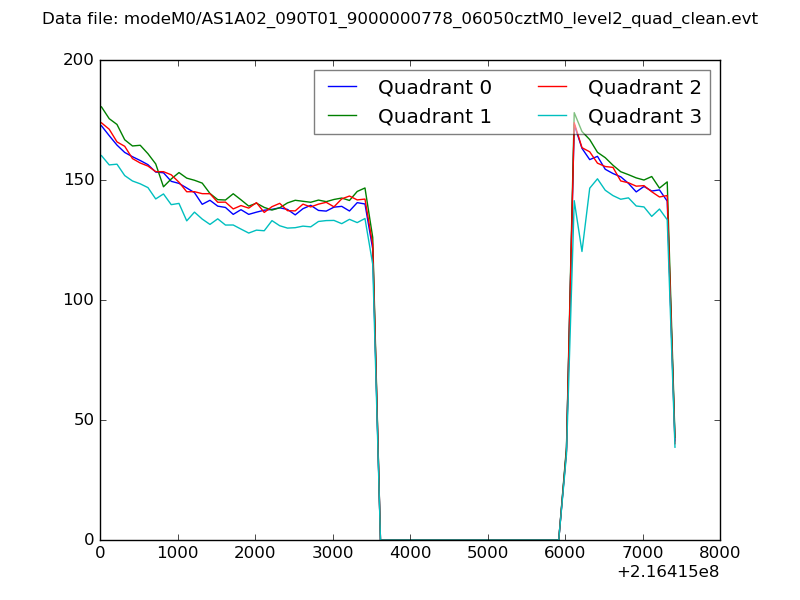 |
|
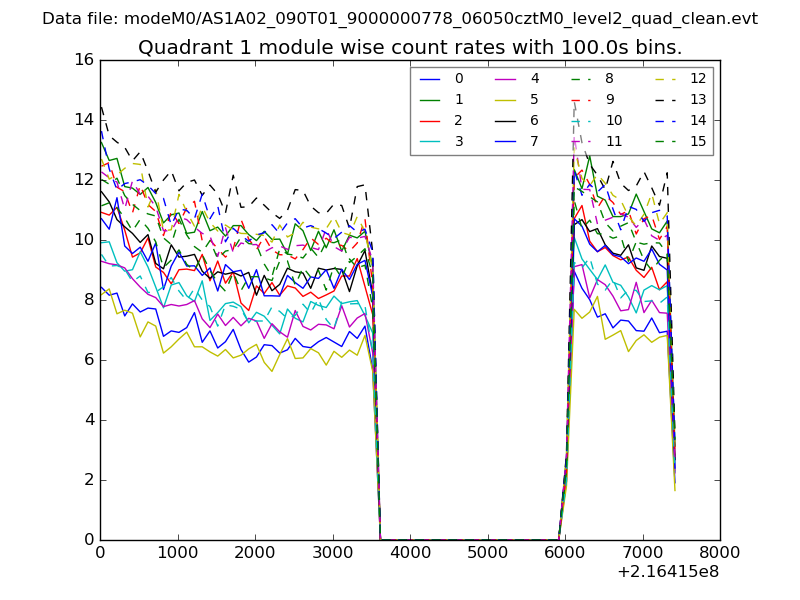
| Module-wise count rates for Quadrant A Data is divided into 100 sec bins |
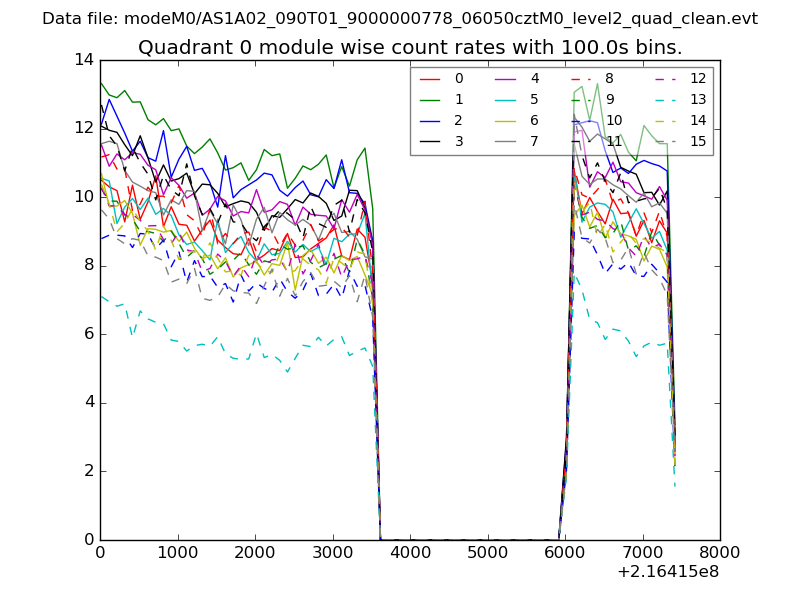 |
 |
| Module-wise count rates for Quadrant B Data is divided into 100 sec bins |
 |
 |
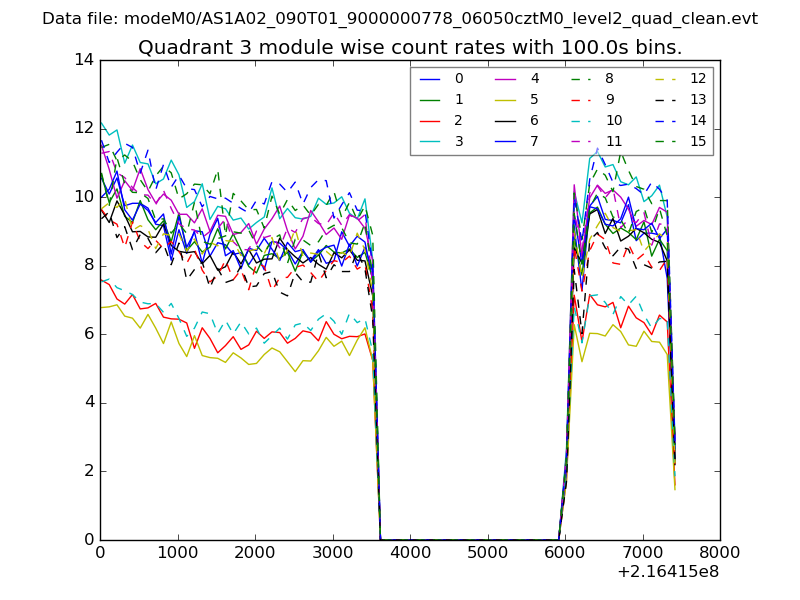
| Module-wise count rates for Quadrant C Data is divided into 100 sec bins |
 |
 |
| Module-wise count rates for Quadrant D Data is divided into 100 sec bins |
 |
 |
| Parameter | Plot |
|---|---|
| CZT HV Monitor | 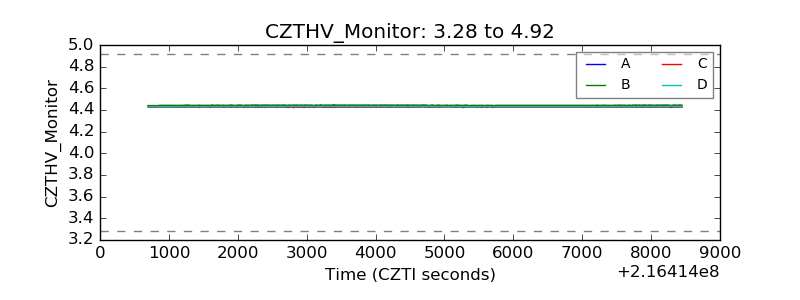 |
| D_VDD | 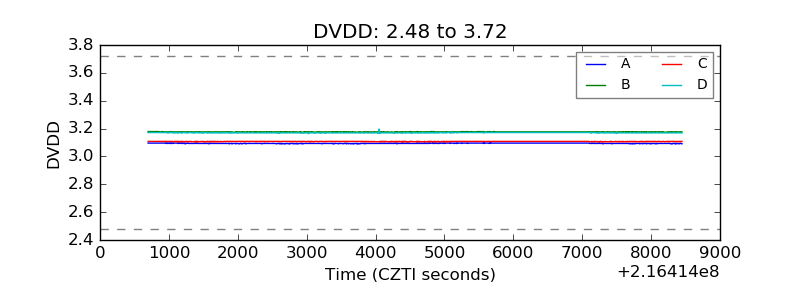 |
| Temperature 1 | 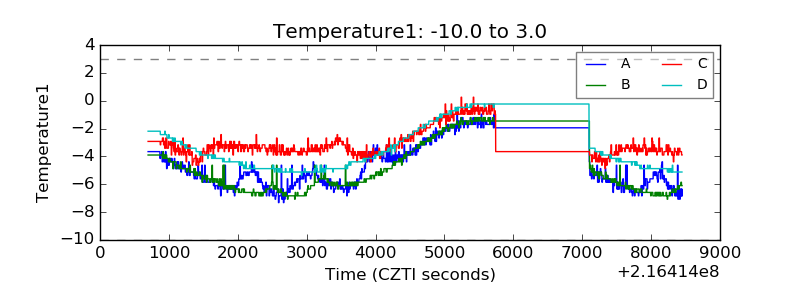 |
| Veto HV Monitor | 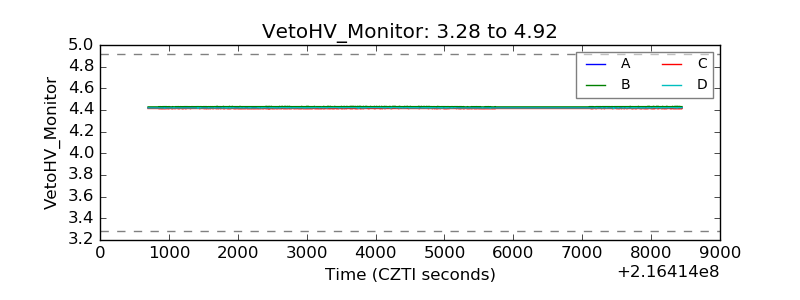 |
| Veto LLD | 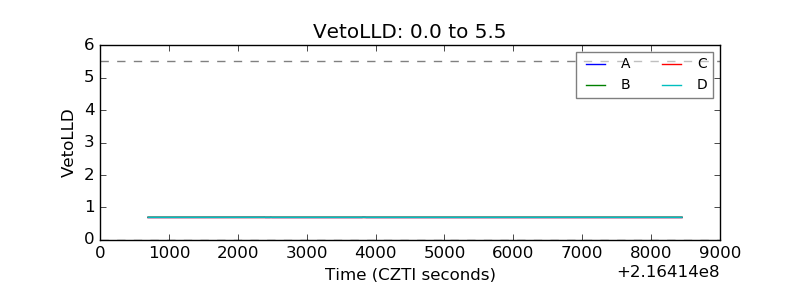 |
| Alpha Counter | 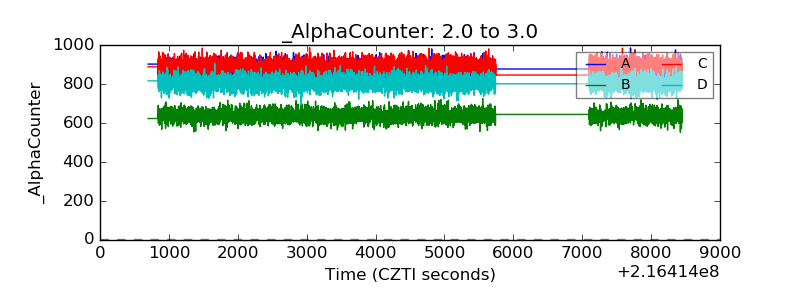 |
| _CPM_Rate | 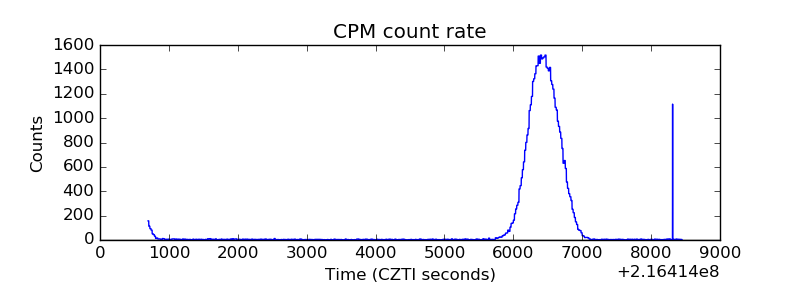 |
| CZT Counter | 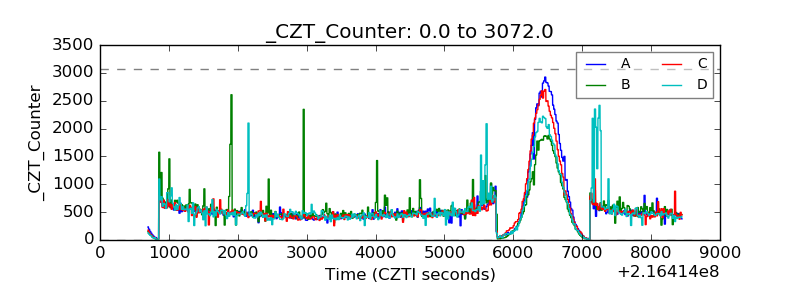 |
| +2.5 Volts monitor |  |
| +5 Volts monitor |  |
| _ROLL_ROT | 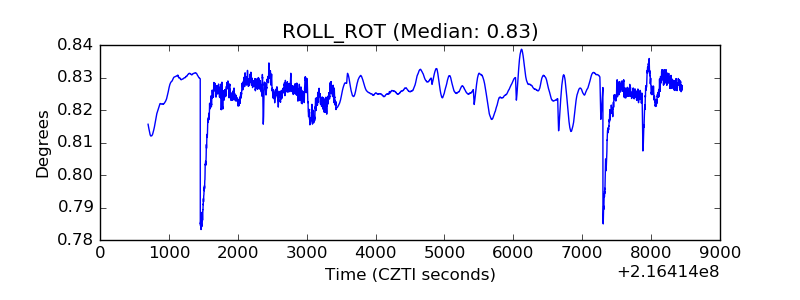 |
| _Roll_DEC | 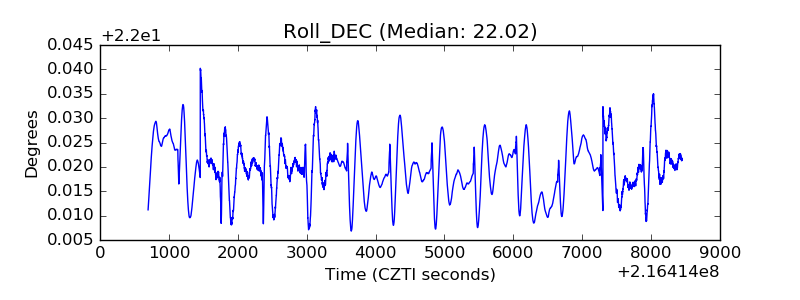 |
| _Roll_RA | 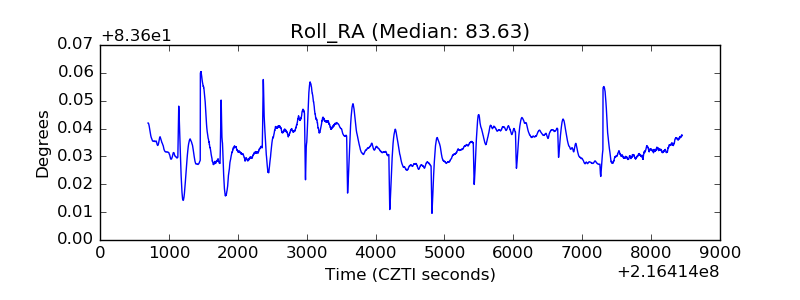 |
| Veto Counter |  |