| Param | Original file | Final file |
|---|---|---|
| Filename | modeM0/AS1A02_090T01_9000000778_06051cztM0_level2.evt | modeM0/AS1A02_090T01_9000000778_06051cztM0_level2_quad_clean.evt |
| Size (bytes) | 420,062,400 | 98,017,920 |
| Size | 400.6 MB | 93.5 MB |
| Events in quadrant A | 2,993,087 | 638,930 |
| Events in quadrant B | 3,439,140 | 653,835 |
| Events in quadrant C | 2,911,461 | 641,713 |
| Events in quadrant D | 2,960,086 | 605,006 |
| Mode M0 | |||
|---|---|---|---|
| Quadrant | BADHDUFLAG | Total packets | Discarded packets |
| A | 0 | 12872 | 2 |
| B | 0 | 14166 | 4 |
| C | 0 | 12761 | 1 |
| D | 0 | 13151 | 1 |
| Mode SS | |||
|---|---|---|---|
| Quadrant | BADHDUFLAG | Total packets | Discarded packets |
| A | 0 | 122 | 0 |
| B | 0 | 122 | 0 |
| C | 0 | 122 | 0 |
| D | 0 | 122 | 0 |
| Mode M9 | |||
|---|---|---|---|
| Quadrant | BADHDUFLAG | Total packets | Discarded packets |
| A | 0 | 13 | 0 |
| B | 0 | 13 | 0 |
| C | 0 | 13 | 0 |
| D | 0 | 13 | 0 |
| Quadrant | Total seconds | Saturated seconds | Saturation percentage |
|---|---|---|---|
| A | 6156 | 32 | 0.519818% |
| B | 6155 | 121 | 1.965881% |
| C | 6156 | 17 | 0.276153% |
| D | 6156 | 32 | 0.519818% |
Noise dominated data is calculated using 1-second bins in cleaned event files. If a bin has >2000 counts, and if more than 50% of those come from <1% of pixels, then it is considered to be noise-dominated and hence unusable.
| Quadrant | # 1 sec bins | Bins with >0 counts | Bins with >2000 counts | High rate bins dominated by noise | Noise dominated (total time) | Noise dominated (detector-on time) | Marked lightcurve |
|---|---|---|---|---|---|---|---|
| A | 7381 | 6157 | 2 | 2 | 0.03% | 0.03% | 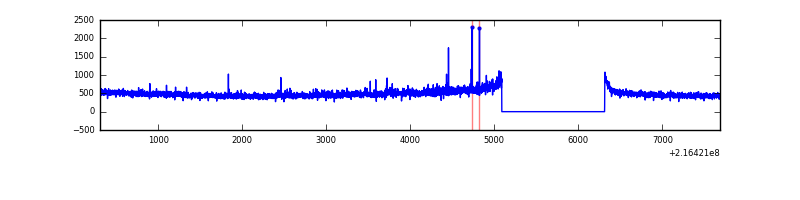 |
| B | 7381 | 6157 | 29 | 29 | 0.39% | 0.47% | 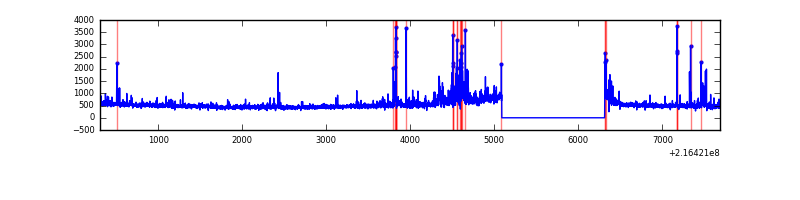 |
| C | 7381 | 6157 | 0 | 0 | 0.00% | 0.00% | 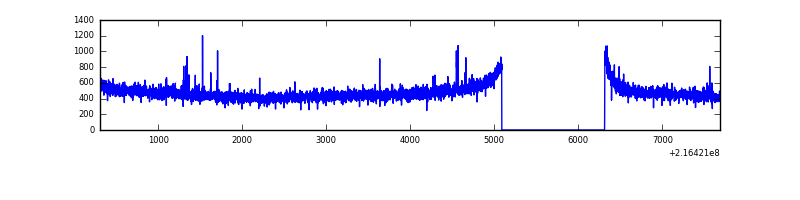 |
| D | 7381 | 6157 | 17 | 17 | 0.23% | 0.28% | 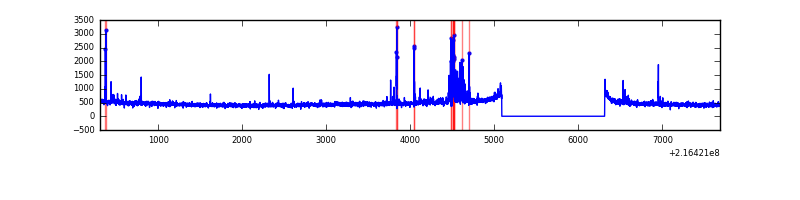 |
Top three noisy pixels from each quadrant. If the there are fewer than three noisy pixels in the level2.evt file, extra rows are filled as -1
| Pixel properties | Quadrant properties | ||||||
|---|---|---|---|---|---|---|---|
| Quadrant | DetID | PixID | Counts | Sigma | Mean | Median | Sigma |
| A | 8 | 15 | 104754 | 673.53 | 748 | 733 | 154.4 |
| A | 0 | 226 | 7185 | 41.78 | 748 | 733 | 154.4 |
| A | 12 | 194 | 7041 | 40.84 | 748 | 733 | 154.4 |
| B | 3 | 64 | 259772 | 1768.71 | 763 | 748 | 146.4 |
| B | 15 | 204 | 94060 | 637.17 | 763 | 748 | 146.4 |
| B | 0 | 214 | 62289 | 420.22 | 763 | 748 | 146.4 |
| C | 1 | 16 | 30134 | 172.43 | 736 | 743 | 170.4 |
| C | 9 | 54 | 9482 | 51.27 | 736 | 743 | 170.4 |
| C | 13 | 61 | 5893 | 30.21 | 736 | 743 | 170.4 |
| D | 5 | 97 | 119818 | 657.94 | 726 | 705 | 181.0 |
| D | 8 | 195 | 40103 | 217.62 | 726 | 705 | 181.0 |
| D | 2 | 206 | 19975 | 106.44 | 726 | 705 | 181.0 |
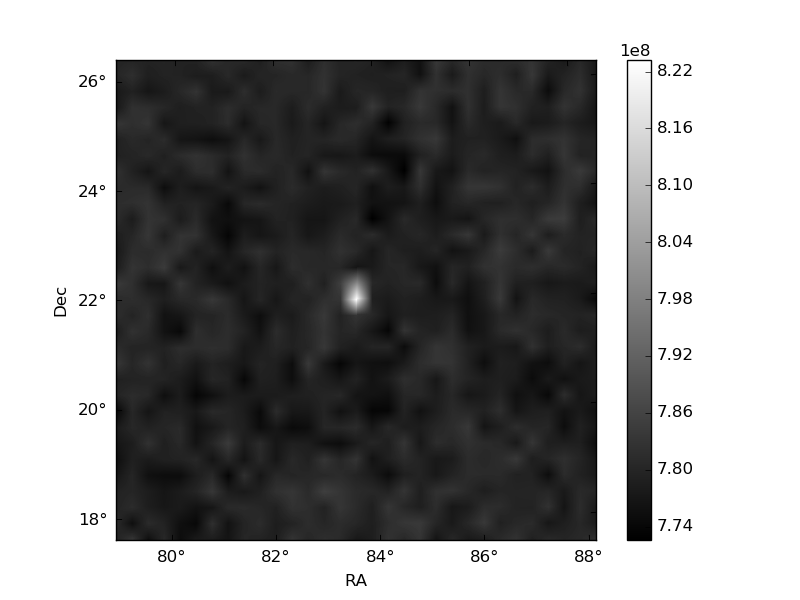
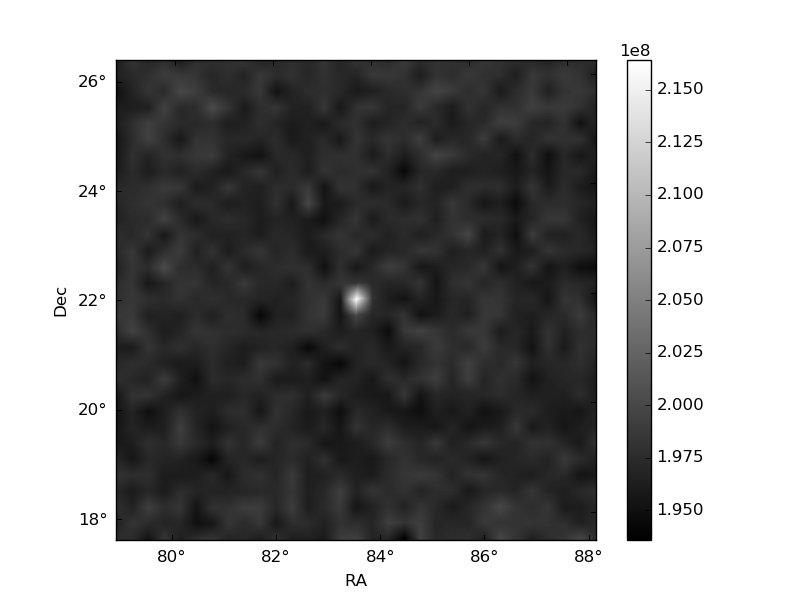
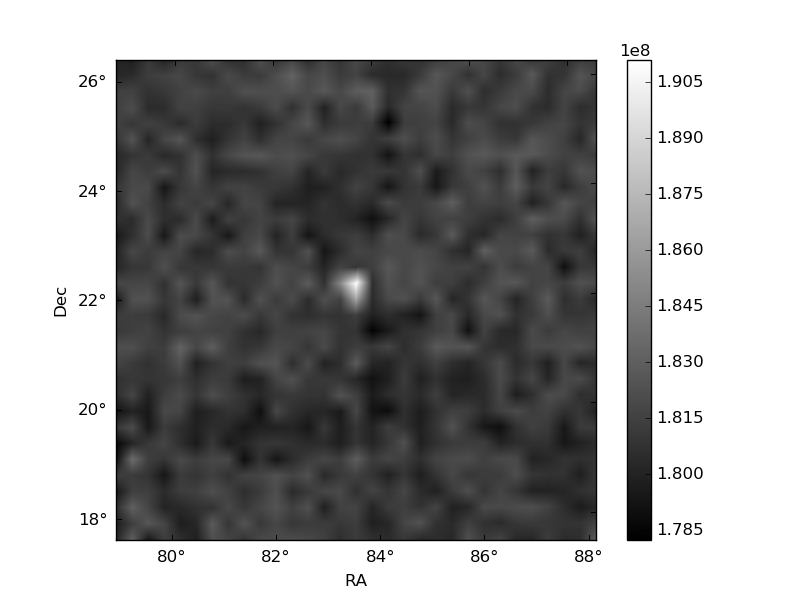
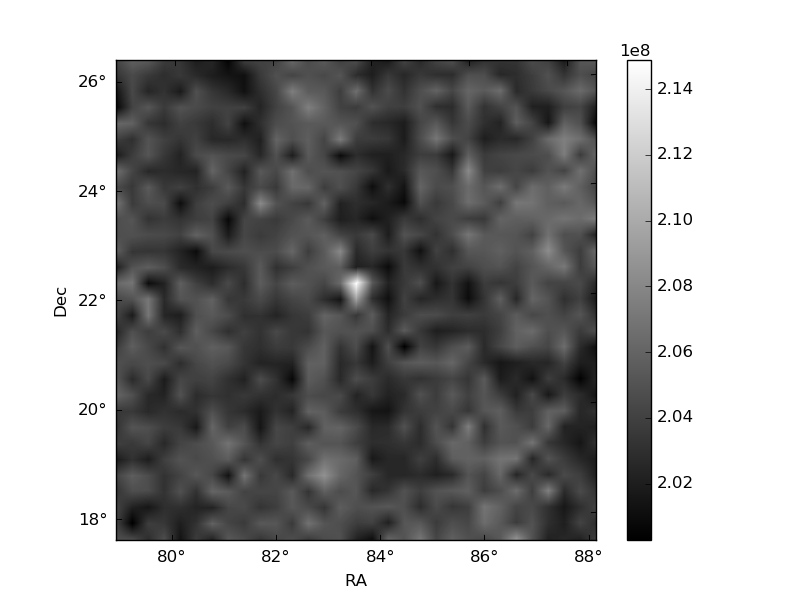
Histogram calculated using DETX and DETY for each event in the final _common_clean file
| Quadrant A | 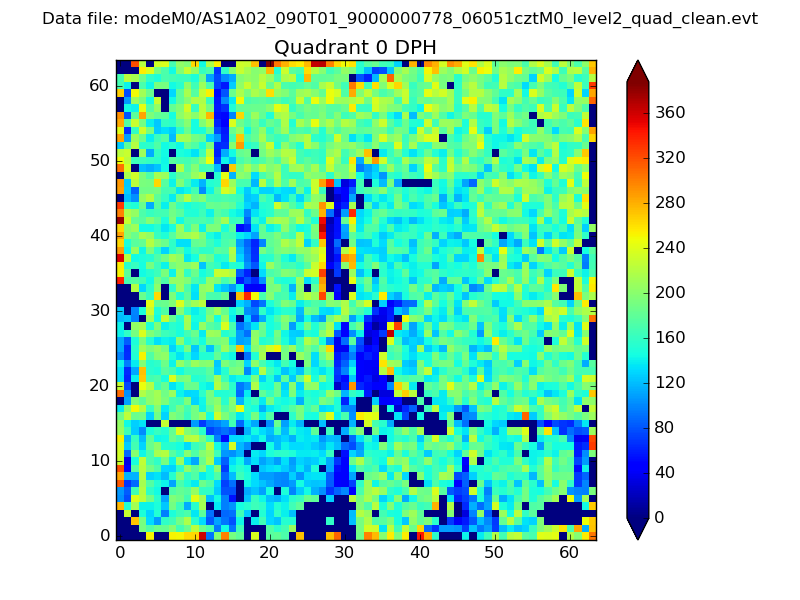 |
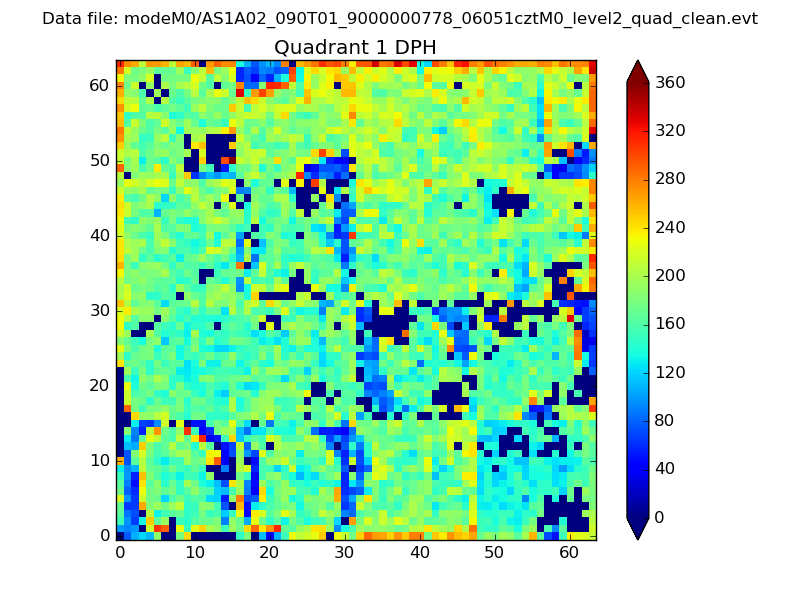 |
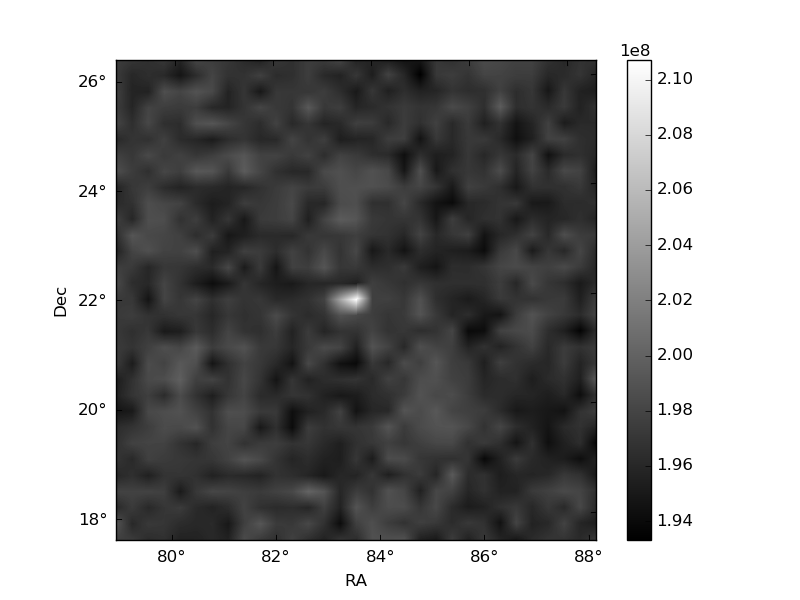
Quadrant B |
|---|---|---|---|
| Quadrant D | 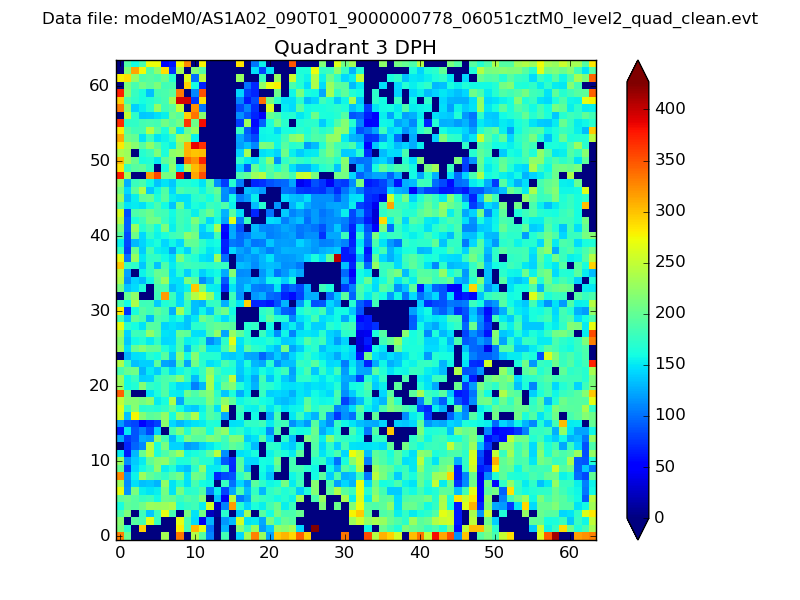 |
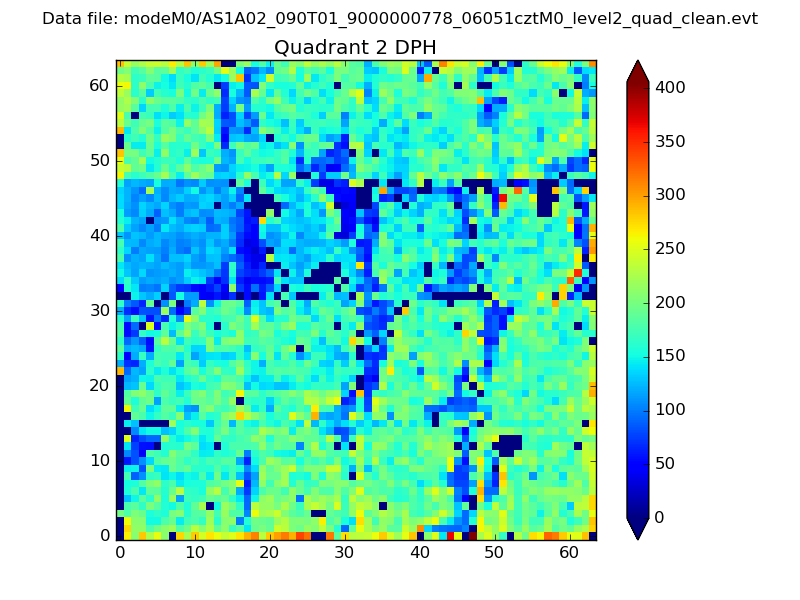 |
Quadrant C |
| Plot type | Count rate plots | Images |
|---|---|---|
| Comparison with Poisson distribution Blue bars denote a histogram of data divided into 1 sec bins. Red curve is a Poisson curve with rate = median count rate of data. |
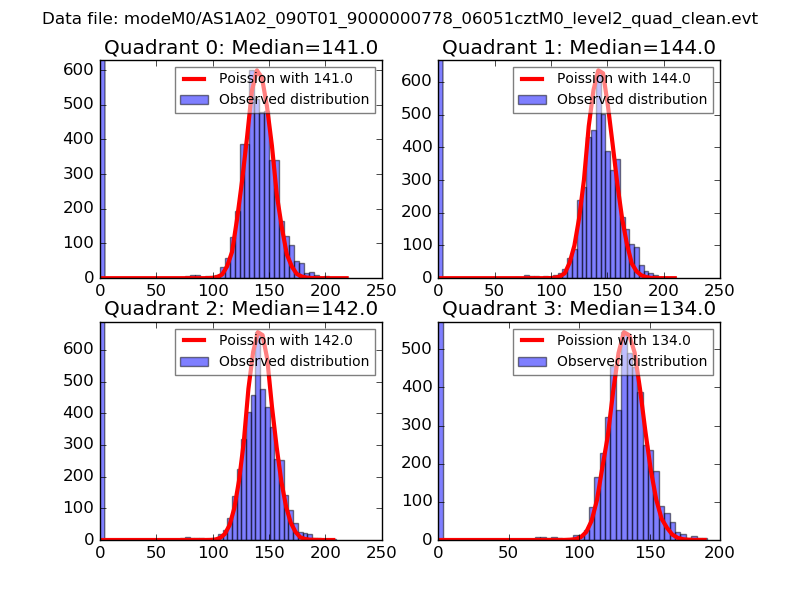 |
 |
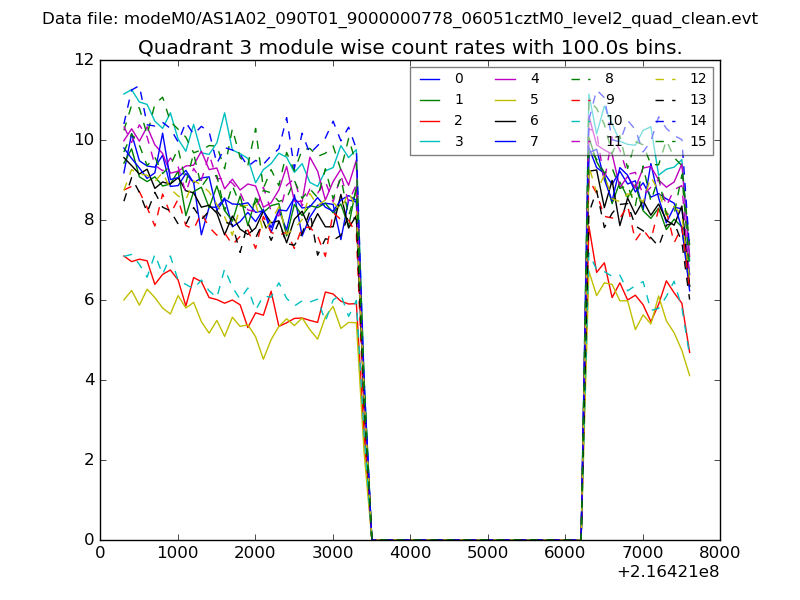
| Quadrant-wise count rates Data is divided into 100 sec bins |
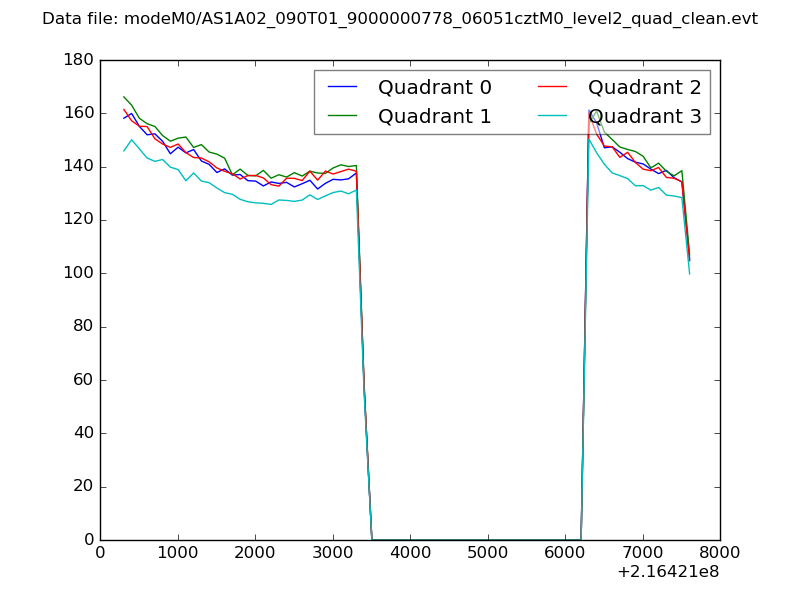 |
|
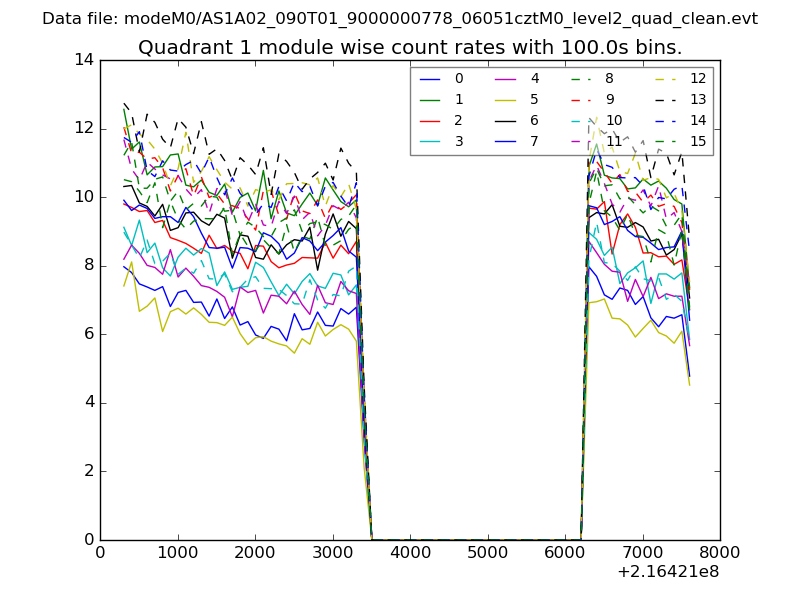
| Module-wise count rates for Quadrant A Data is divided into 100 sec bins |
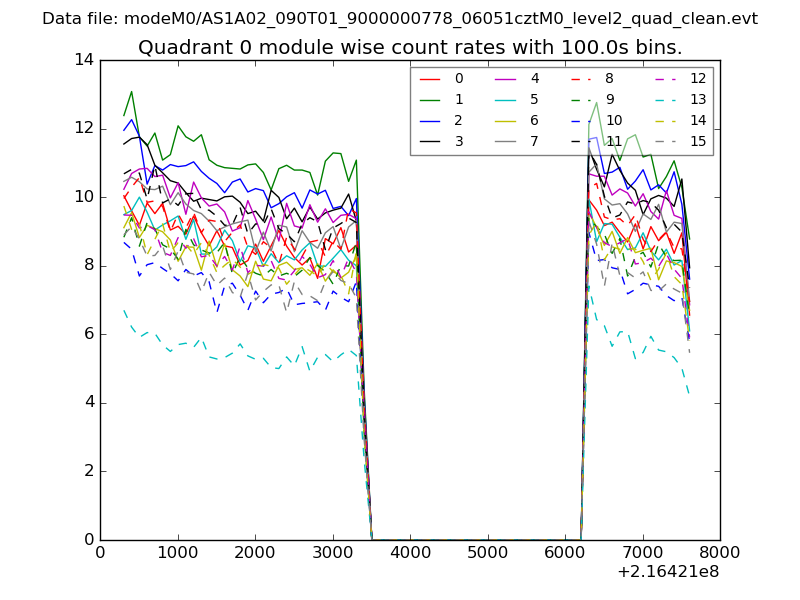 |
 |
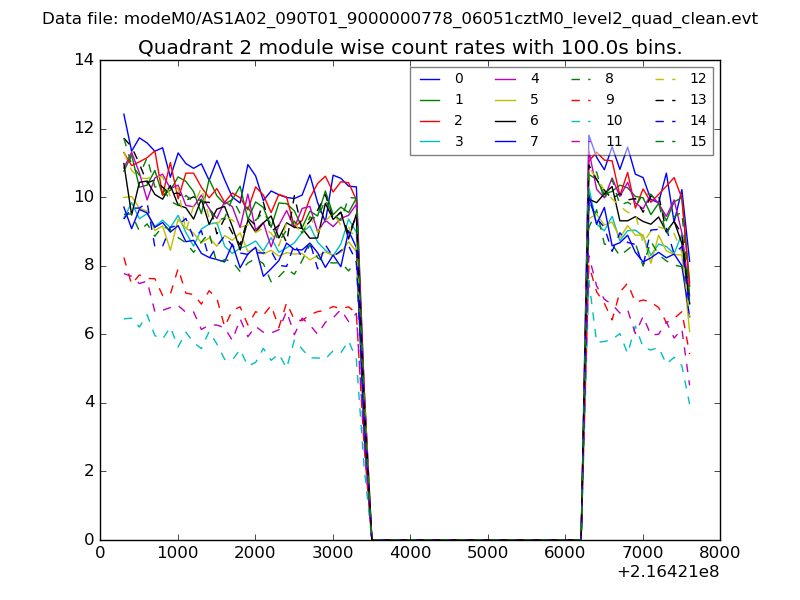
| Module-wise count rates for Quadrant B Data is divided into 100 sec bins |
 |
 |
| Module-wise count rates for Quadrant C Data is divided into 100 sec bins |
 |
 |
| Module-wise count rates for Quadrant D Data is divided into 100 sec bins |
 |
 |
| Parameter | Plot |
|---|---|
| CZT HV Monitor | 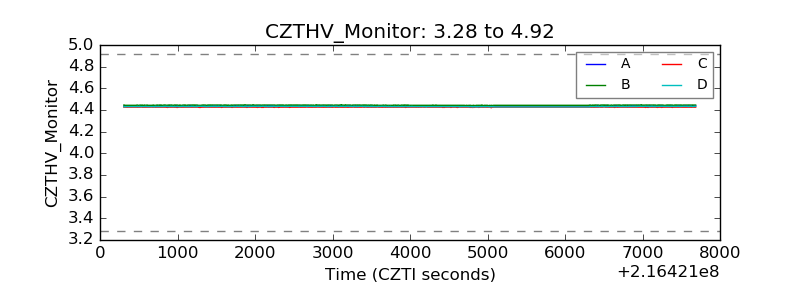 |
| D_VDD | 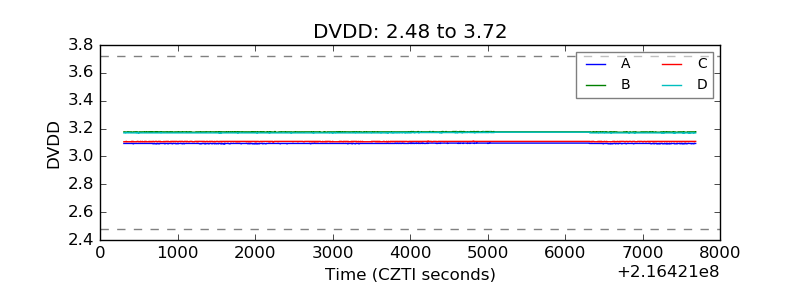 |
| Temperature 1 | 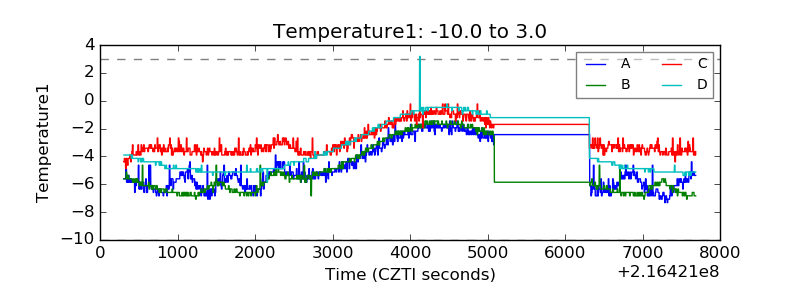 |
| Veto HV Monitor | 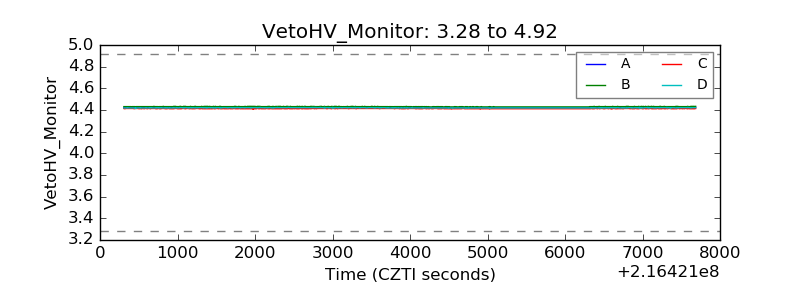 |
| Veto LLD | 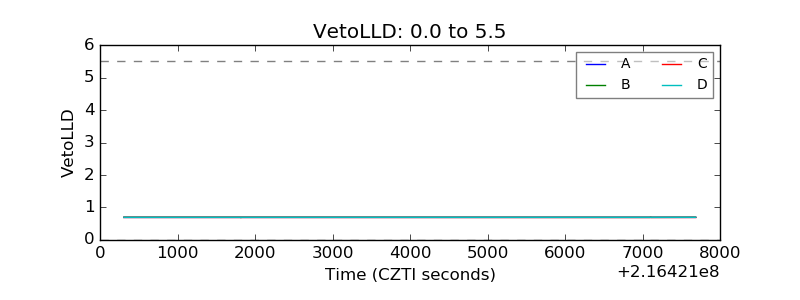 |
| Alpha Counter | 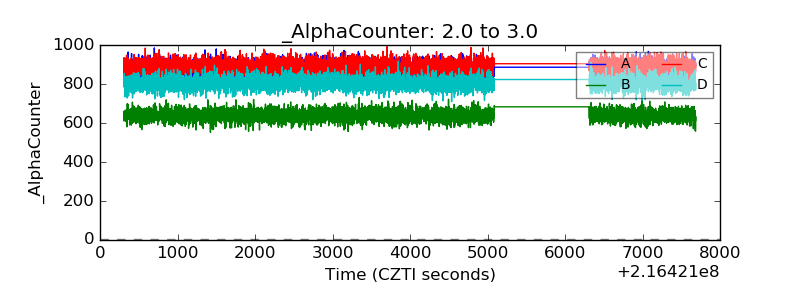 |
| _CPM_Rate | 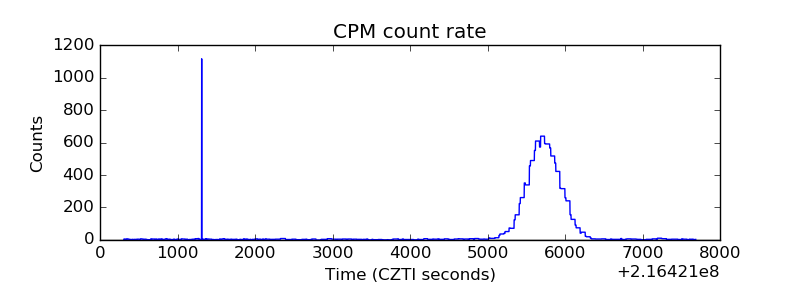 |
| CZT Counter | 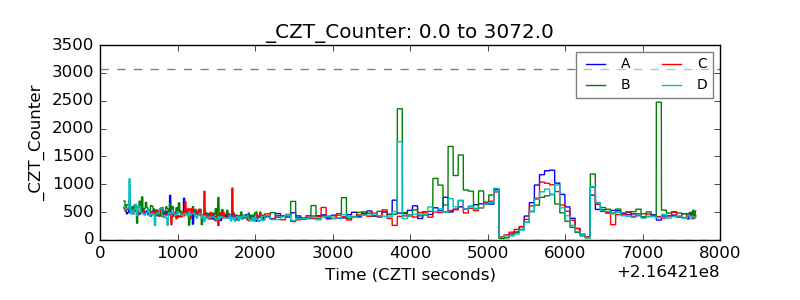 |
| +2.5 Volts monitor |  |
| +5 Volts monitor |  |
| _ROLL_ROT | 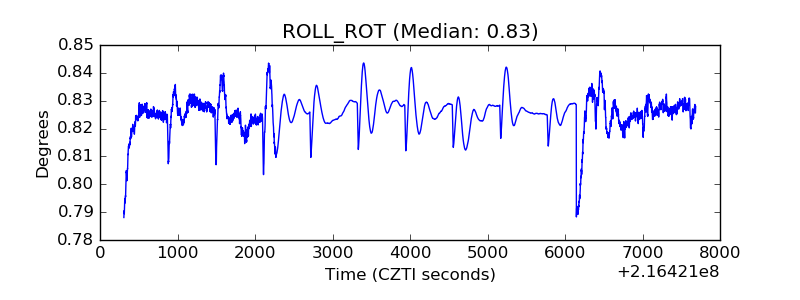 |
| _Roll_DEC | 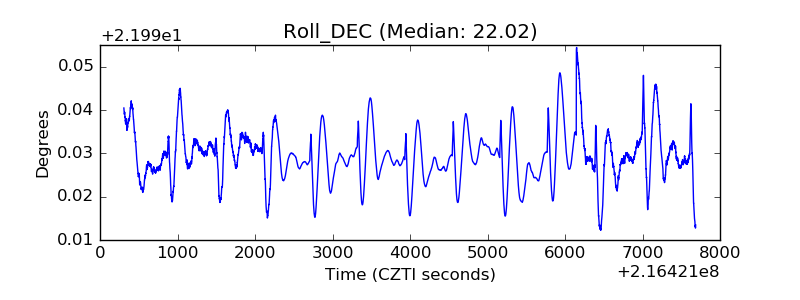 |
| _Roll_RA | 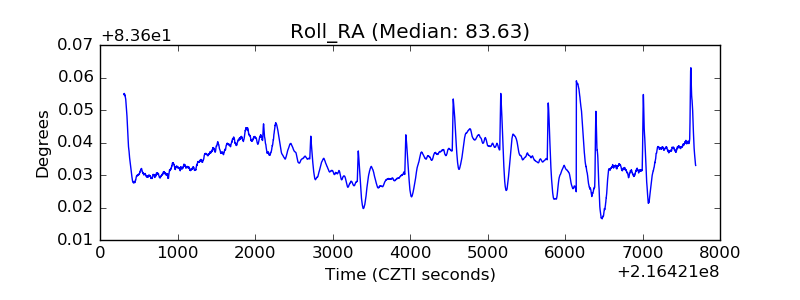 |
| Veto Counter | 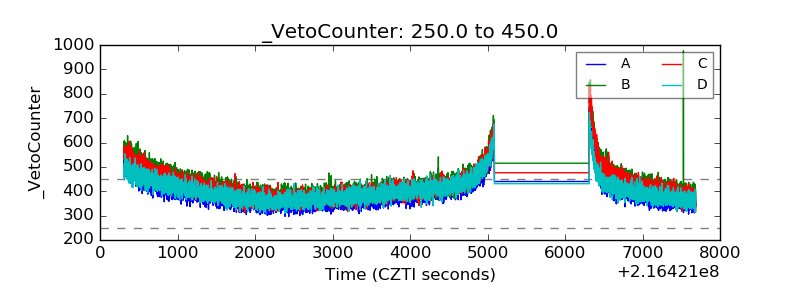 |