| Param | Original file | Final file |
|---|---|---|
| Filename | modeM0/AS1A02_090T01_9000000778_06052cztM0_level2.evt | modeM0/AS1A02_090T01_9000000778_06052cztM0_level2_quad_clean.evt |
| Size (bytes) | 467,579,520 | 101,995,200 |
| Size | 445.9 MB | 97.3 MB |
| Events in quadrant A | 3,368,311 | 653,649 |
| Events in quadrant B | 3,781,778 | 666,606 |
| Events in quadrant C | 3,245,373 | 656,087 |
| Events in quadrant D | 3,284,940 | 620,505 |
| Mode M0 | |||
|---|---|---|---|
| Quadrant | BADHDUFLAG | Total packets | Discarded packets |
| A | 0 | 14698 | 3 |
| B | 0 | 15959 | 2 |
| C | 0 | 14582 | 2 |
| D | 0 | 14937 | 2 |
| Mode SS | |||
|---|---|---|---|
| Quadrant | BADHDUFLAG | Total packets | Discarded packets |
| A | 0 | 144 | 0 |
| B | 0 | 144 | 0 |
| C | 0 | 144 | 0 |
| D | 0 | 144 | 0 |
| Mode M9 | |||
|---|---|---|---|
| Quadrant | BADHDUFLAG | Total packets | Discarded packets |
| A | 0 | 13 | 0 |
| B | 0 | 13 | 0 |
| C | 0 | 13 | 0 |
| D | 0 | 14 | 0 |
| Quadrant | Total seconds | Saturated seconds | Saturation percentage |
|---|---|---|---|
| A | 7065 | 34 | 0.481246% |
| B | 7065 | 119 | 1.684360% |
| C | 7065 | 23 | 0.325548% |
| D | 7065 | 24 | 0.339703% |
Noise dominated data is calculated using 1-second bins in cleaned event files. If a bin has >2000 counts, and if more than 50% of those come from <1% of pixels, then it is considered to be noise-dominated and hence unusable.
| Quadrant | # 1 sec bins | Bins with >0 counts | Bins with >2000 counts | High rate bins dominated by noise | Noise dominated (total time) | Noise dominated (detector-on time) | Marked lightcurve |
|---|---|---|---|---|---|---|---|
| A | 8025 | 7066 | 0 | 0 | 0.00% | 0.00% | 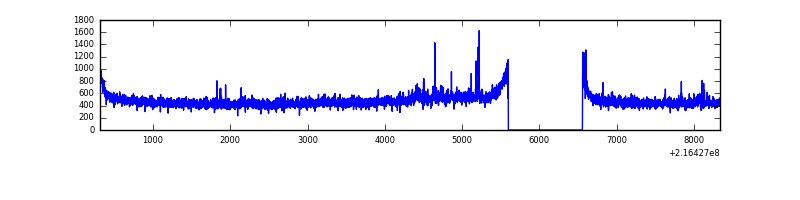 |
| B | 8025 | 7066 | 43 | 43 | 0.54% | 0.61% | 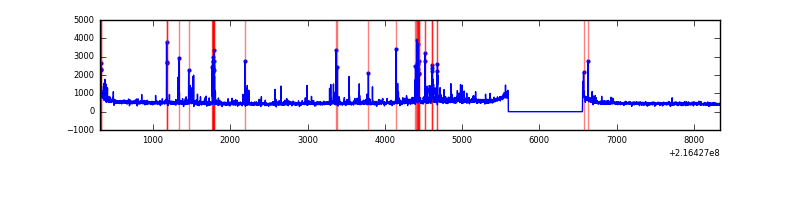 |
| C | 8025 | 7065 | 0 | 0 | 0.00% | 0.00% | 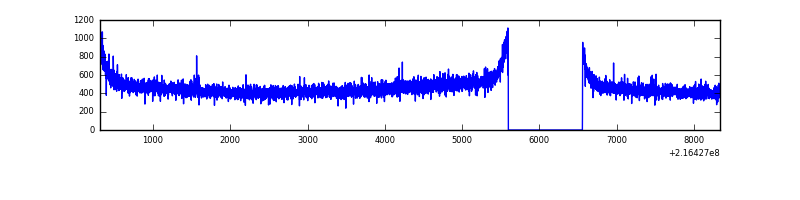 |
| D | 8025 | 7066 | 8 | 8 | 0.10% | 0.11% | 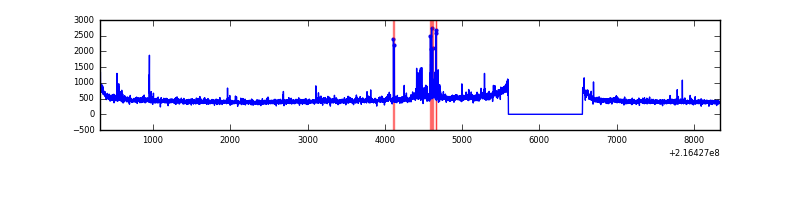 |
Top three noisy pixels from each quadrant. If the there are fewer than three noisy pixels in the level2.evt file, extra rows are filled as -1
| Pixel properties | Quadrant properties | ||||||
|---|---|---|---|---|---|---|---|
| Quadrant | DetID | PixID | Counts | Sigma | Mean | Median | Sigma |
| A | 8 | 15 | 76270 | 431.27 | 846 | 831 | 174.9 |
| A | 7 | 16 | 30777 | 171.2 | 846 | 831 | 174.9 |
| A | 0 | 226 | 8104 | 41.58 | 846 | 831 | 174.9 |
| B | 3 | 64 | 306862 | 1853.66 | 857 | 838 | 165.1 |
| B | 0 | 214 | 64662 | 386.6 | 857 | 838 | 165.1 |
| B | 4 | 48 | 43741 | 259.87 | 857 | 838 | 165.1 |
| C | 1 | 16 | 18853 | 93.08 | 827 | 838 | 193.5 |
| C | 13 | 61 | 6446 | 28.98 | 827 | 838 | 193.5 |
| C | 3 | 202 | 2136 | 6.71 | 827 | 838 | 193.5 |
| D | 5 | 97 | 69263 | 336.75 | 818 | 794 | 203.3 |
| D | 8 | 195 | 45701 | 220.87 | 818 | 794 | 203.3 |
| D | 11 | 241 | 44190 | 213.43 | 818 | 794 | 203.3 |
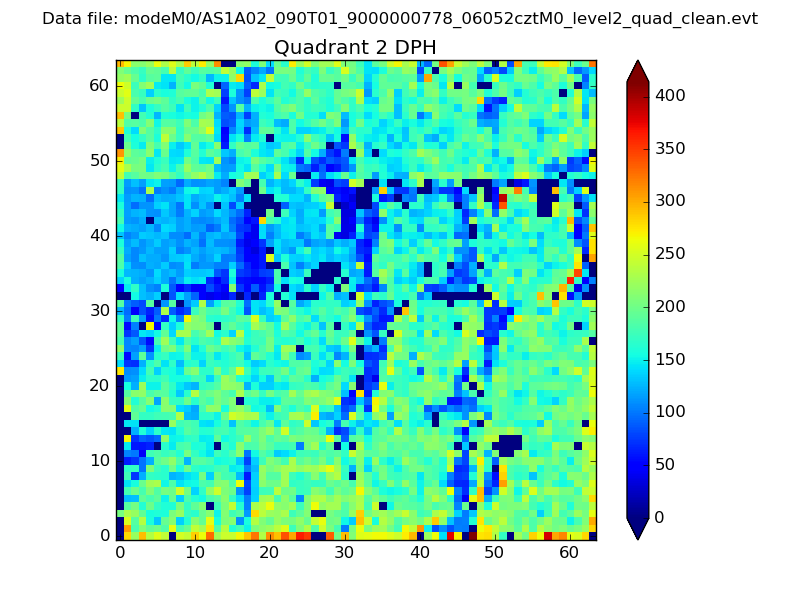
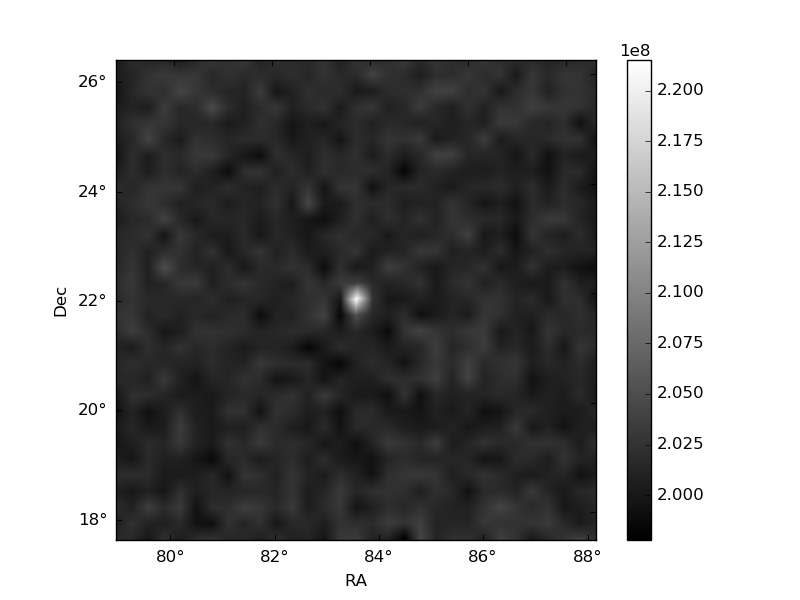
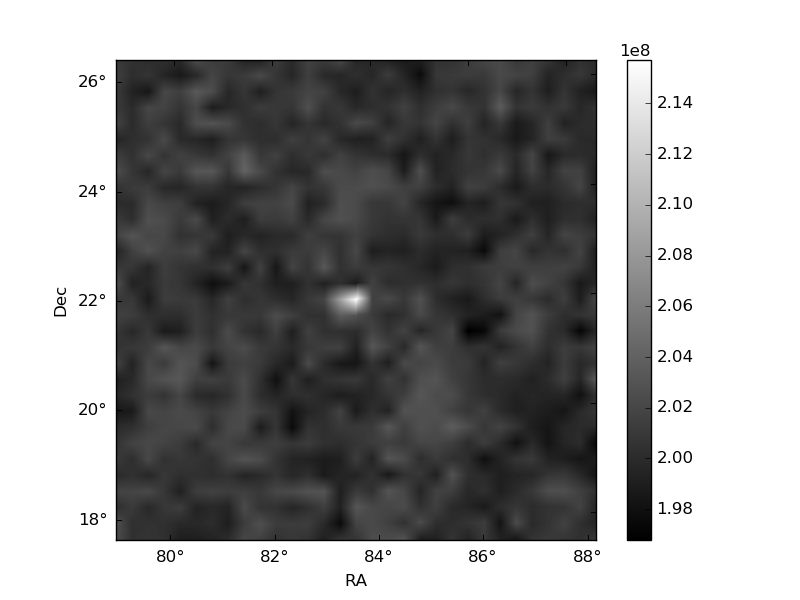
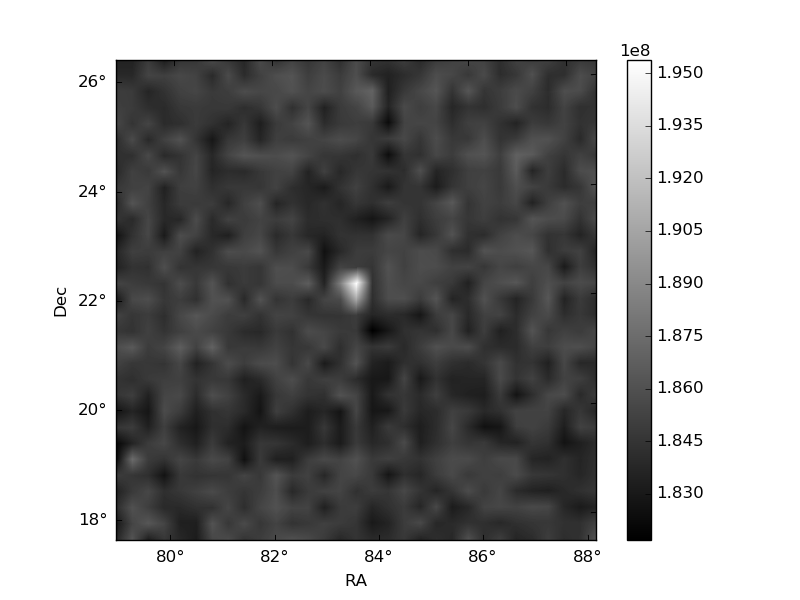
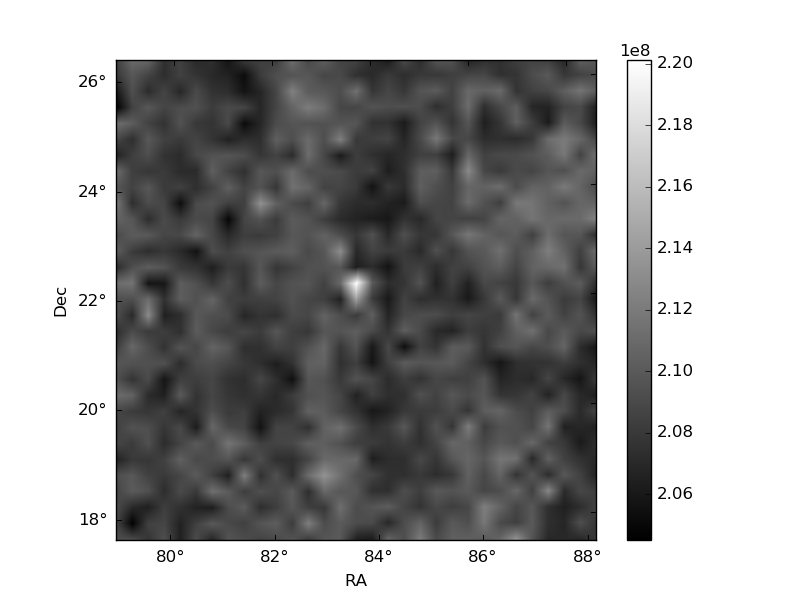
Histogram calculated using DETX and DETY for each event in the final _common_clean file
| Quadrant A | 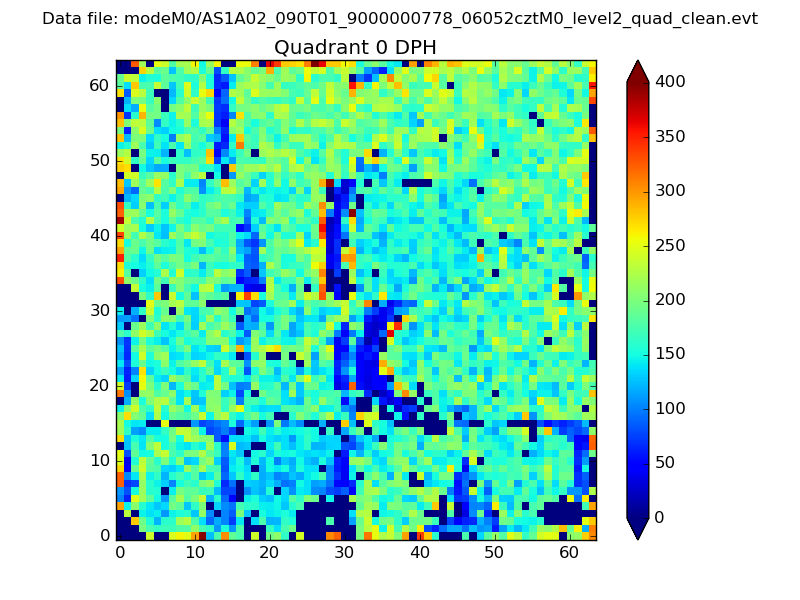 |
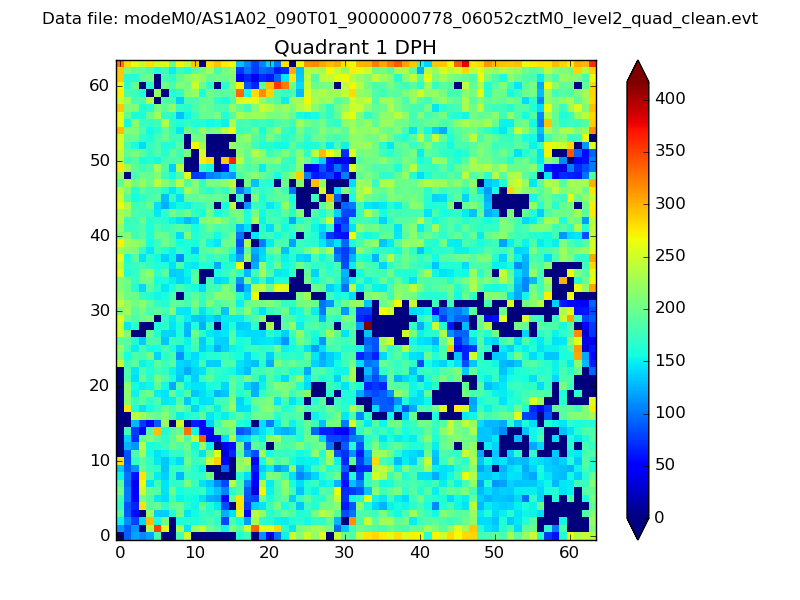 |
Quadrant B |
|---|---|---|---|
| Quadrant D | 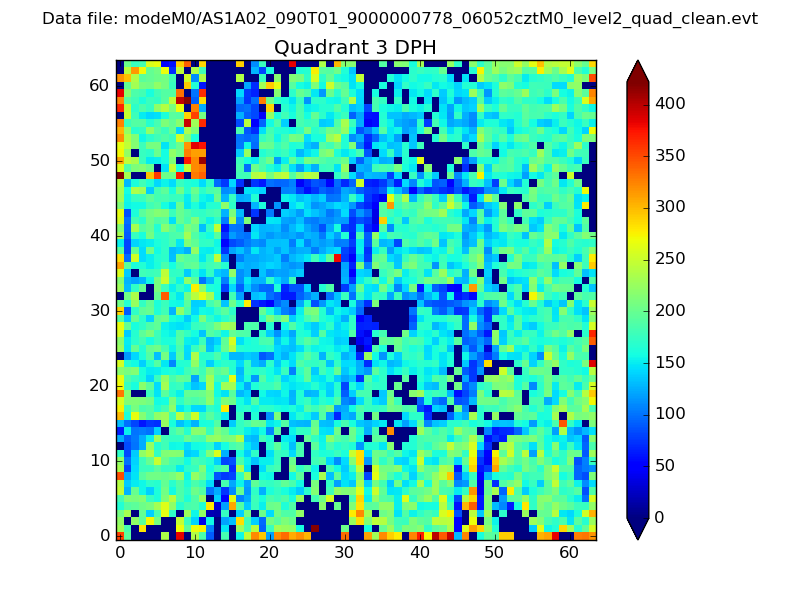 |
 |
Quadrant C |
| Plot type | Count rate plots | Images |
|---|---|---|
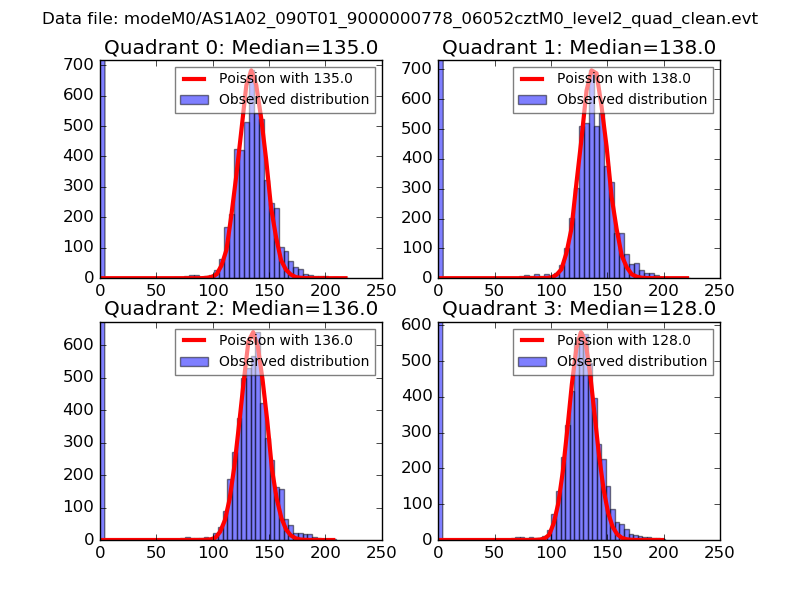
| Comparison with Poisson distribution Blue bars denote a histogram of data divided into 1 sec bins. Red curve is a Poisson curve with rate = median count rate of data. |
 |
 |
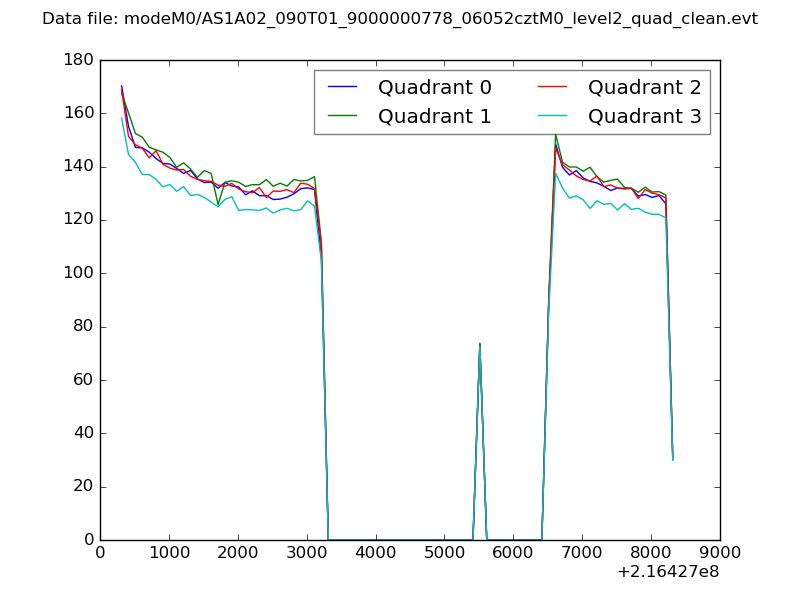
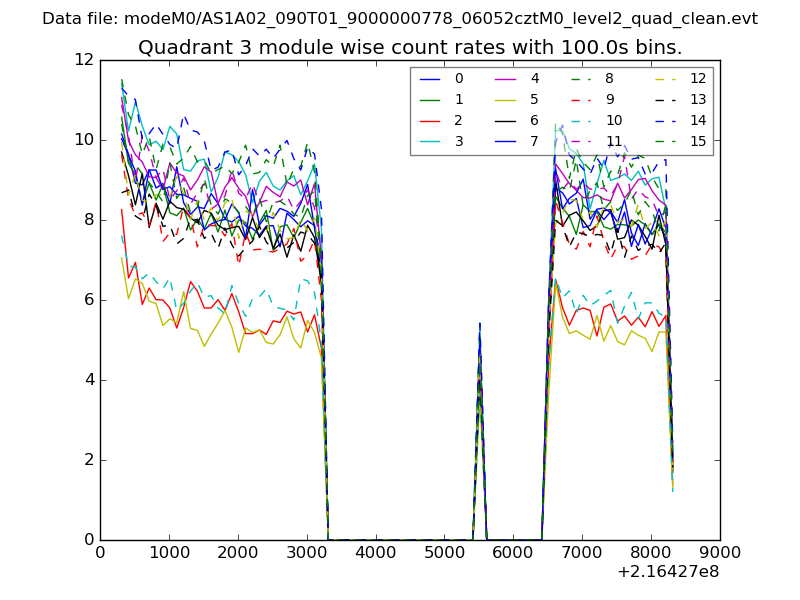
| Quadrant-wise count rates Data is divided into 100 sec bins |
 |
|
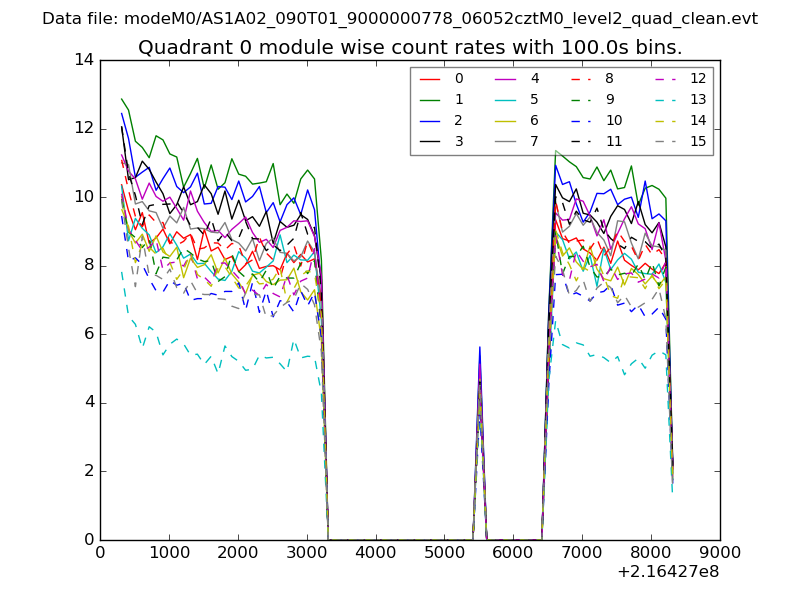
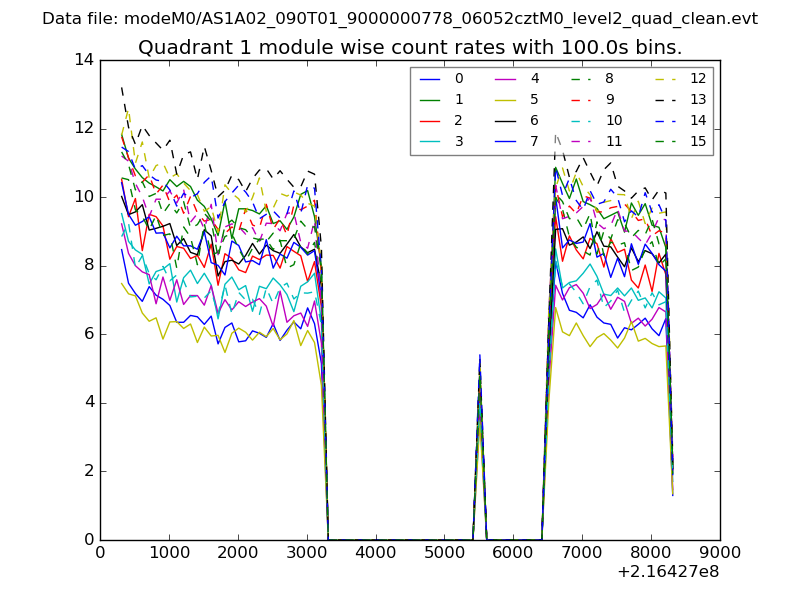
| Module-wise count rates for Quadrant A Data is divided into 100 sec bins |
 |
 |
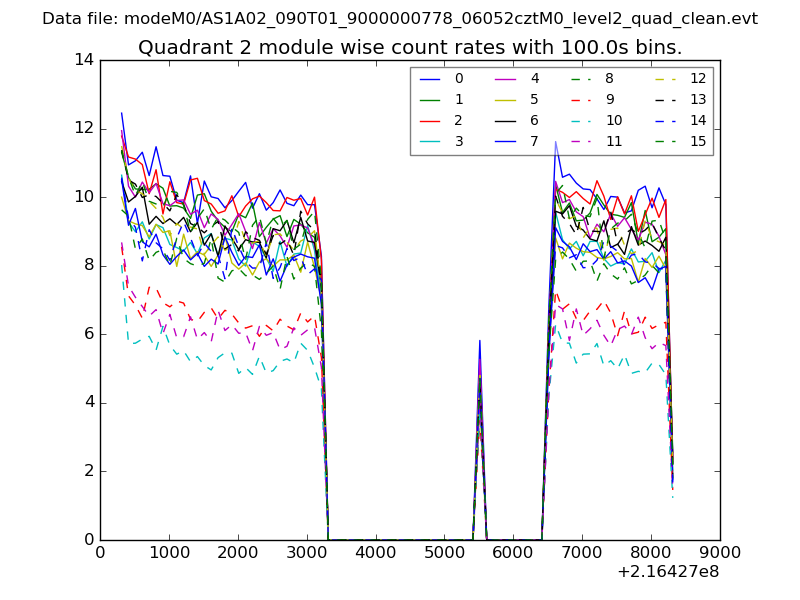
| Module-wise count rates for Quadrant B Data is divided into 100 sec bins |
 |
 |
| Module-wise count rates for Quadrant C Data is divided into 100 sec bins |
 |
 |
| Module-wise count rates for Quadrant D Data is divided into 100 sec bins |
 |
 |
| Parameter | Plot |
|---|---|
| CZT HV Monitor | 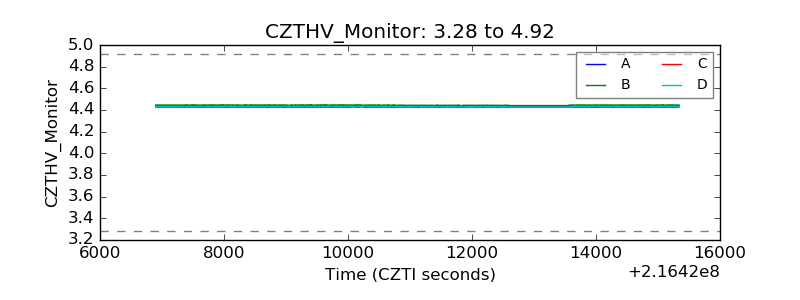 |
| D_VDD | 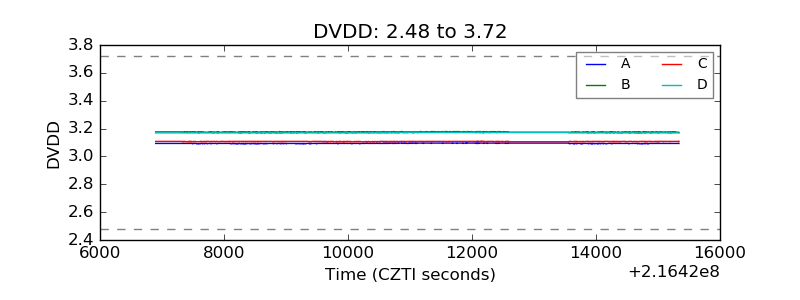 |
| Temperature 1 | 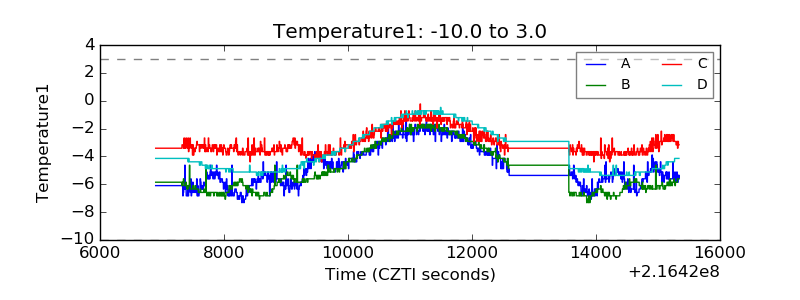 |
| Veto HV Monitor | 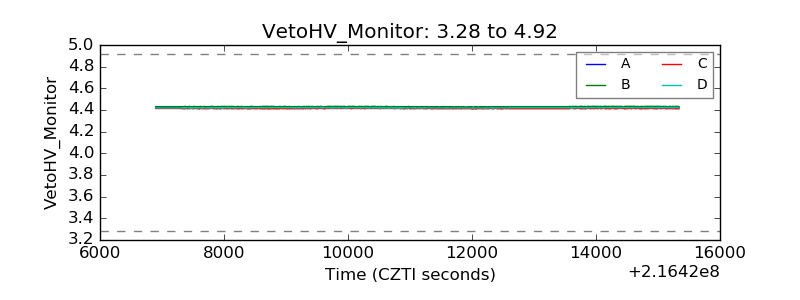 |
| Veto LLD | 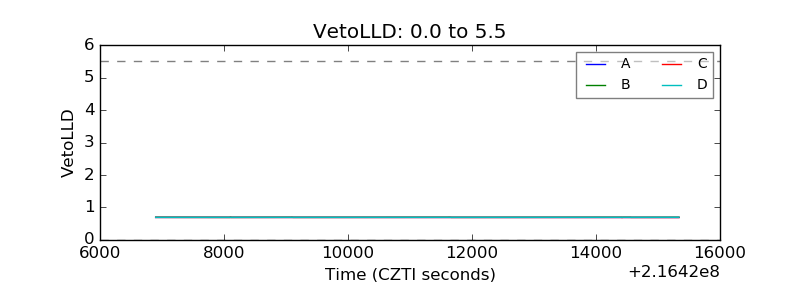 |
| Alpha Counter | 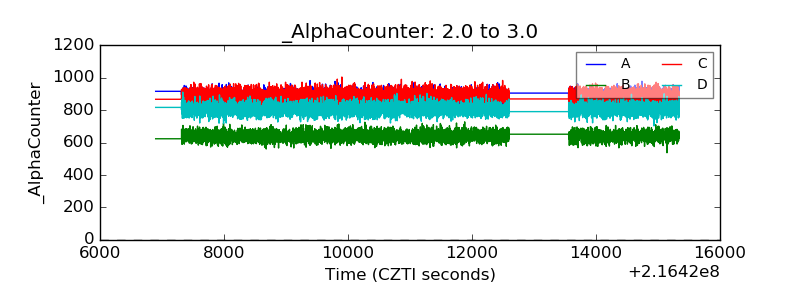 |
| _CPM_Rate | 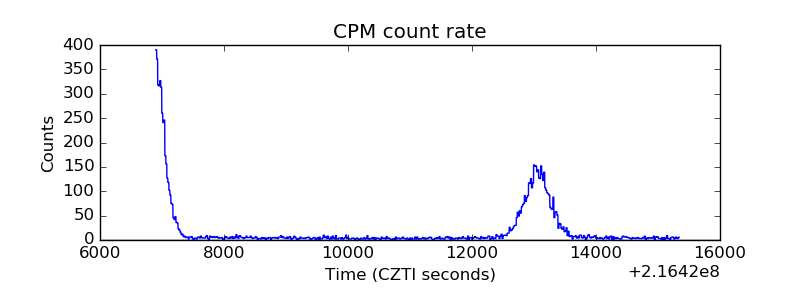 |
| CZT Counter | 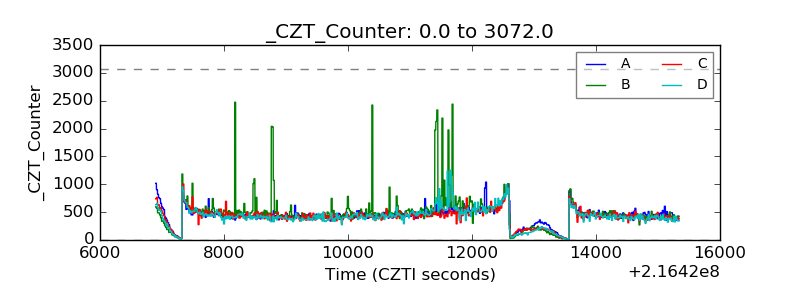 |
| +2.5 Volts monitor |  |
| +5 Volts monitor | 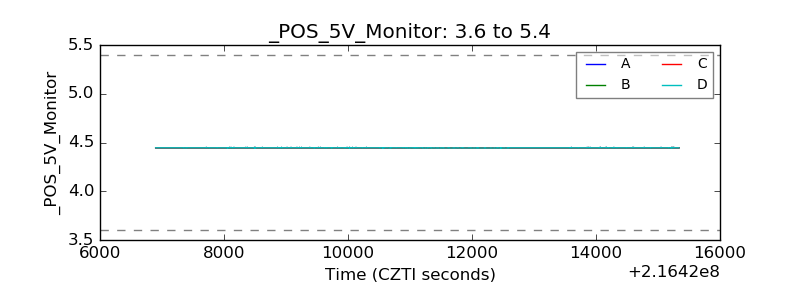 |
| _ROLL_ROT | 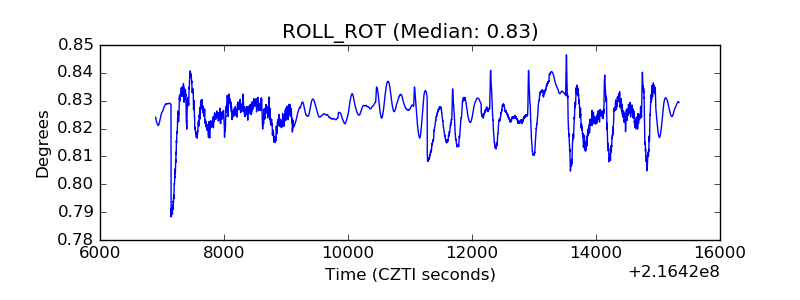 |
| _Roll_DEC | 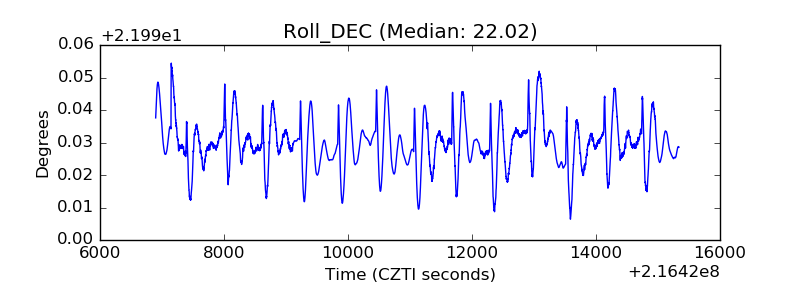 |
| _Roll_RA | 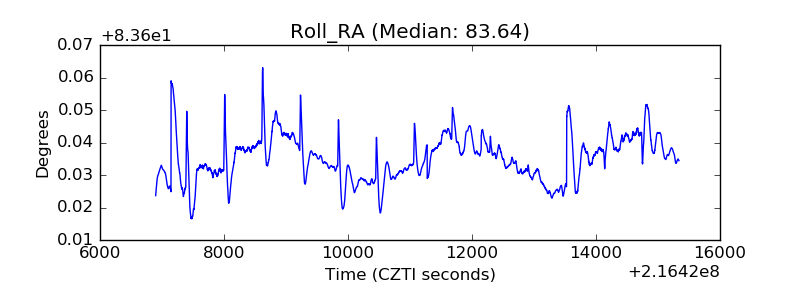 |
| Veto Counter | 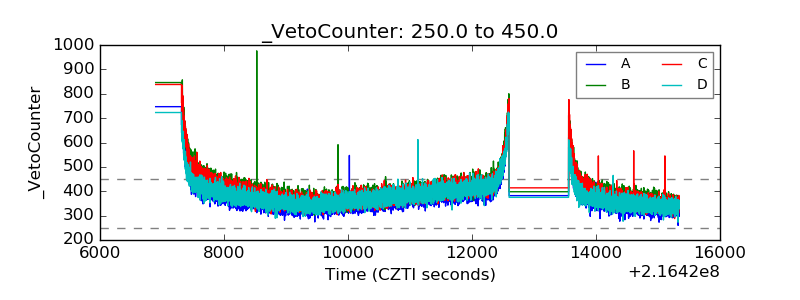 |