| Param | Original file | Final file |
|---|---|---|
| Filename | modeM0/AS1G06_024T01_9000000780cztM0_level2.fits | modeM0/AS1G06_024T01_9000000780cztM0_level2_quad_clean.evt |
| Size (bytes) | 250,024,320 | 259,871,040 |
| Size | 238.4 MB | 247.8 MB |
| Events in quadrant A | 1,481,964 | 1,546,191 |
| Events in quadrant B | 1,415,630 | 1,514,758 |
| Events in quadrant C | 1,480,506 | 1,508,335 |
| Events in quadrant D | 1,258,652 | 1,368,133 |
| Mode M9 | |||
|---|---|---|---|
| Quadrant | BADHDUFLAG | Total packets | Discarded packets |
| A | 0 | 21 | 0 |
| B | 0 | 21 | 0 |
| C | 0 | 21 | 0 |
| D | 0 | 21 | 0 |
| Mode M0 | |||
|---|---|---|---|
| Quadrant | BADHDUFLAG | Total packets | Discarded packets |
| A | 0 | 58723 | 0 |
| B | 0 | 64917 | 0 |
| C | 0 | 58010 | 0 |
| D | 0 | 62110 | 0 |
| Mode SS | |||
|---|---|---|---|
| Quadrant | BADHDUFLAG | Total packets | Discarded packets |
| A | 0 | 574 | 0 |
| B | 0 | 584 | 0 |
| C | 0 | 584 | 0 |
| D | 0 | 584 | 0 |
| Quadrant | Total seconds | Saturated seconds | Saturation percentage |
|---|---|---|---|
| A | 28095 | 440 | 1.566115% |
| B | 27848 | 1044 | 3.748923% |
| C | 28208 | 392 | 1.389677% |
| D | 28027 | 554 | 1.976665% |
Noise dominated data is calculated using 1-second bins in cleaned event files. If a bin has >2000 counts, and if more than 50% of those come from <1% of pixels, then it is considered to be noise-dominated and hence unusable.
| Quadrant | # 1 sec bins | Bins with >0 counts | Bins with >2000 counts | High rate bins dominated by noise | Noise dominated (total time) | Noise dominated (detector-on time) | Marked lightcurve |
|---|---|---|---|---|---|---|---|
| A | 47804 | 29897 | 0 | 0 | 0.00% | 0.00% |  |
| B | 47804 | 29622 | 0 | 0 | 0.00% | 0.00% |  |
| C | 47804 | 29948 | 0 | 0 | 0.00% | 0.00% |  |
| D | 47804 | 29806 | 0 | 0 | 0.00% | 0.00% |  |
Top three noisy pixels from each quadrant. If the there are fewer than three noisy pixels in the level2.evt file, extra rows are filled as -1
| Pixel properties | Quadrant properties | ||||||
|---|---|---|---|---|---|---|---|
| Quadrant | DetID | PixID | Counts | Sigma | Mean | Median | Sigma |
| A | 14 | 188 | 1451 | 10.84 | 383 | 355 | 101.1 |
| A | 0 | 29 | 1447 | 10.8 | 383 | 355 | 101.1 |
| A | 14 | 204 | 1287 | 9.22 | 383 | 355 | 101.1 |
| B | 2 | 9 | 1240 | 11.35 | 372 | 352 | 78.2 |
| B | 12 | 226 | 1057 | 9.01 | 372 | 352 | 78.2 |
| B | 14 | 254 | 1033 | 8.71 | 372 | 352 | 78.2 |
| C | 12 | 241 | 1049 | 6.44 | 390 | 359 | 107.2 |
| C | 1 | 80 | 1048 | 6.43 | 390 | 359 | 107.2 |
| C | 2 | 191 | 1013 | 6.1 | 390 | 359 | 107.2 |
| D | 3 | 31 | 984 | 6.66 | 359 | 325 | 99.0 |
| D | 3 | 14 | 983 | 6.65 | 359 | 325 | 99.0 |
| D | 11 | 82 | 944 | 6.25 | 359 | 325 | 99.0 |
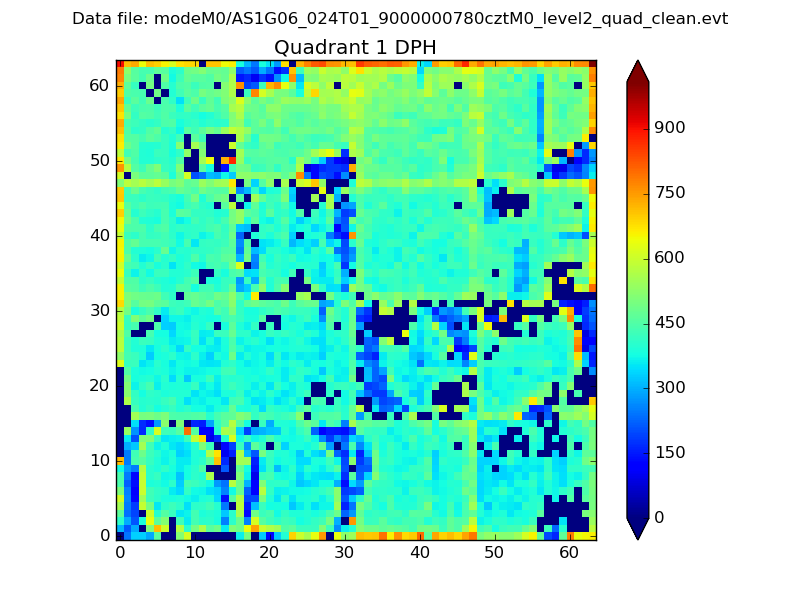
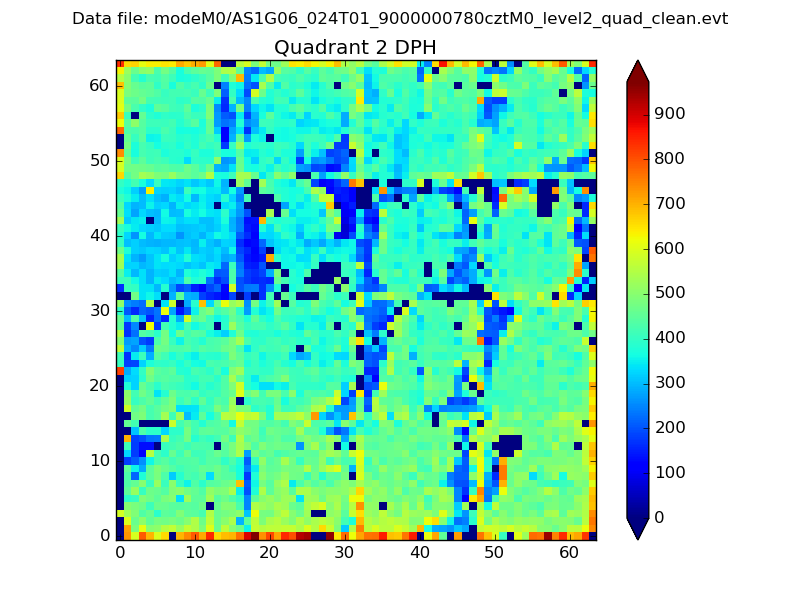
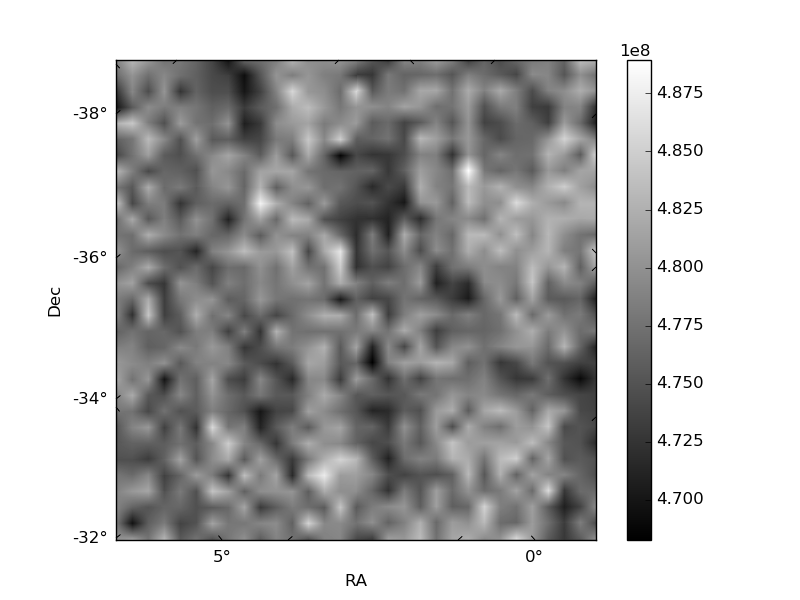
Histogram calculated using DETX and DETY for each event in the final _common_clean file
| Quadrant A |  |
 |
Quadrant B |
|---|---|---|---|
| Quadrant D |  |
 |
Quadrant C |
| Plot type | Count rate plots | Images |
|---|---|---|
| Comparison with Poisson distribution Blue bars denote a histogram of data divided into 1 sec bins. Red curve is a Poisson curve with rate = median count rate of data. |
 |
 |
| Quadrant-wise count rates Data is divided into 100 sec bins |
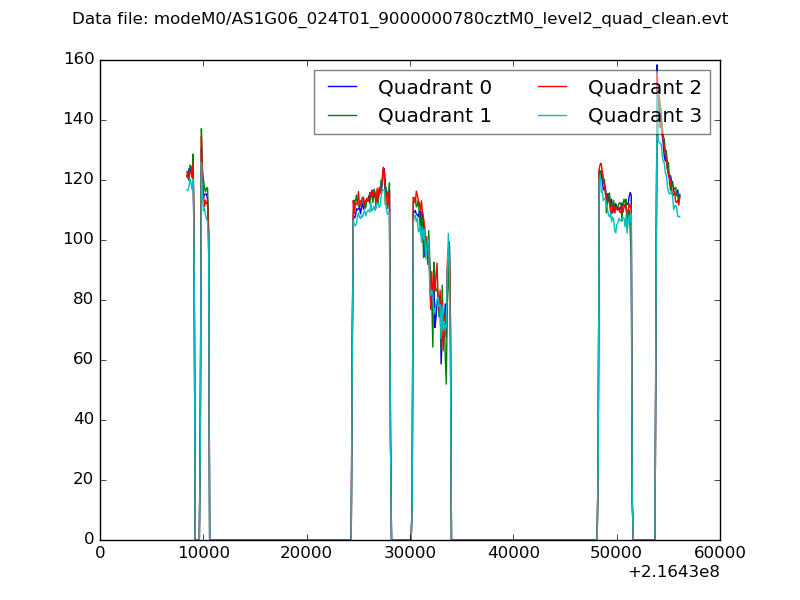 |
|
| Module-wise count rates for Quadrant A Data is divided into 100 sec bins |
 |
 |
| Module-wise count rates for Quadrant B Data is divided into 100 sec bins |
 |
 |
| Module-wise count rates for Quadrant C Data is divided into 100 sec bins |
 |
 |
| Module-wise count rates for Quadrant D Data is divided into 100 sec bins |
 |
 |
| Parameter | Plot |
|---|---|
| CZT HV Monitor | 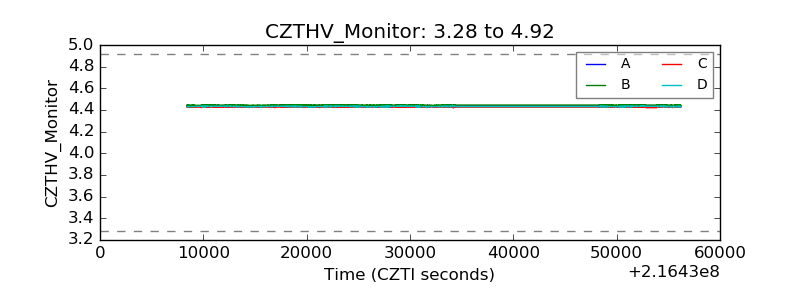 |
| D_VDD | 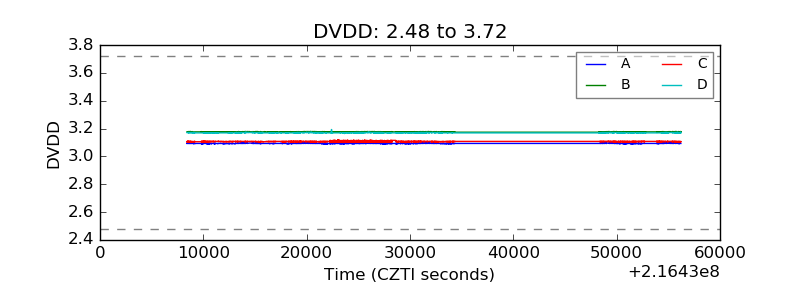 |
| Temperature 1 |  |
| Veto HV Monitor |  |
| Veto LLD | 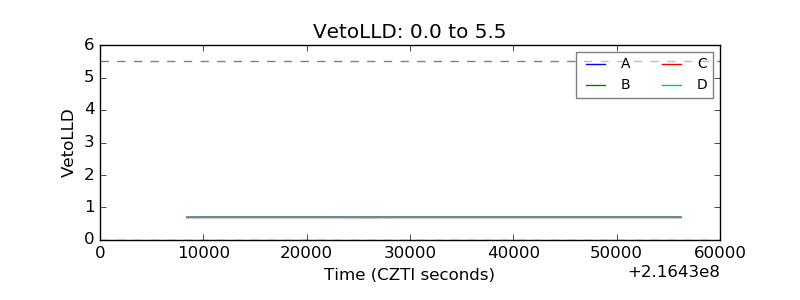 |
| Alpha Counter | 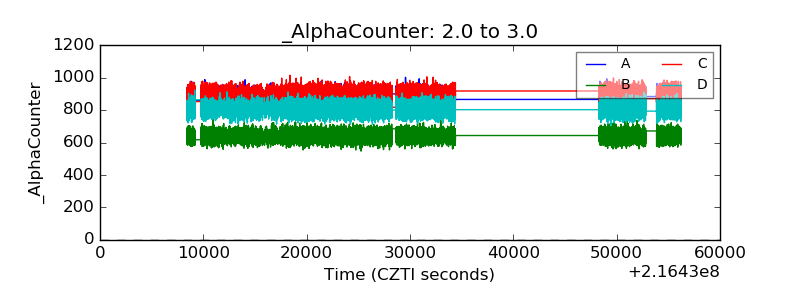 |
| _CPM_Rate |  |
| CZT Counter |  |
| +2.5 Volts monitor |  |
| +5 Volts monitor | 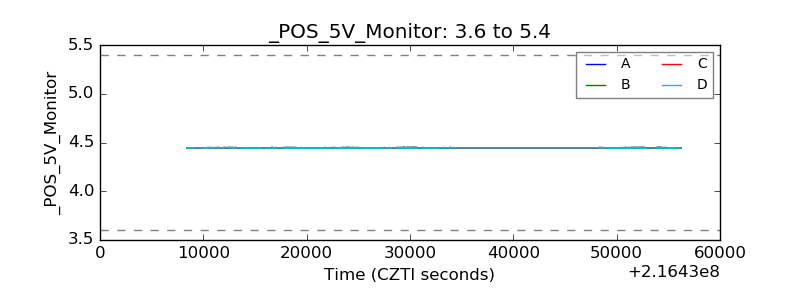 |
| _ROLL_ROT |  |
| _Roll_DEC |  |
| _Roll_RA | 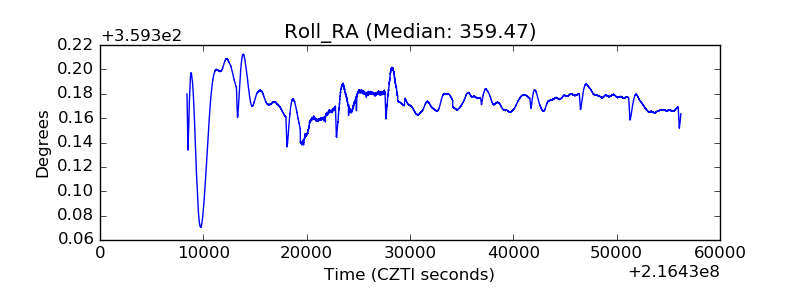 |
| Veto Counter |  |