| Param | Original file | Final file |
|---|---|---|
| Filename | modeM0/AS1G06_024T01_9000000780_06053cztM0_level2.evt | modeM0/AS1G06_024T01_9000000780_06053cztM0_level2_quad_clean.evt |
| Size (bytes) | 143,576,640 | 30,562,560 |
| Size | 136.9 MB | 29.1 MB |
| Events in quadrant A | 1,043,949 | 191,936 |
| Events in quadrant B | 1,111,847 | 195,845 |
| Events in quadrant C | 1,013,498 | 191,713 |
| Events in quadrant D | 1,025,300 | 184,913 |
| Mode M9 | |||
|---|---|---|---|
| Quadrant | BADHDUFLAG | Total packets | Discarded packets |
| A | 0 | 6 | 0 |
| B | 0 | 6 | 0 |
| C | 0 | 6 | 0 |
| D | 0 | 6 | 0 |
| Mode M0 | |||
|---|---|---|---|
| Quadrant | BADHDUFLAG | Total packets | Discarded packets |
| A | 0 | 4668 | 2 |
| B | 0 | 4761 | 1 |
| C | 0 | 4628 | 1 |
| D | 0 | 4709 | 3 |
| Mode SS | |||
|---|---|---|---|
| Quadrant | BADHDUFLAG | Total packets | Discarded packets |
| A | 0 | 46 | 0 |
| B | 0 | 46 | 0 |
| C | 0 | 46 | 0 |
| D | 0 | 46 | 0 |
| Quadrant | Total seconds | Saturated seconds | Saturation percentage |
|---|---|---|---|
| A | 2224 | 16 | 0.719424% |
| B | 2224 | 29 | 1.303957% |
| C | 2224 | 23 | 1.034173% |
| D | 2223 | 38 | 1.709402% |
Noise dominated data is calculated using 1-second bins in cleaned event files. If a bin has >2000 counts, and if more than 50% of those come from <1% of pixels, then it is considered to be noise-dominated and hence unusable.
| Quadrant | # 1 sec bins | Bins with >0 counts | Bins with >2000 counts | High rate bins dominated by noise | Noise dominated (total time) | Noise dominated (detector-on time) | Marked lightcurve |
|---|---|---|---|---|---|---|---|
| A | 2824 | 2225 | 0 | 0 | 0.00% | 0.00% | 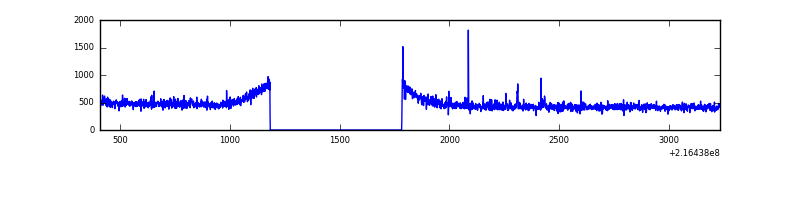 |
| B | 2824 | 2225 | 0 | 0 | 0.00% | 0.00% | 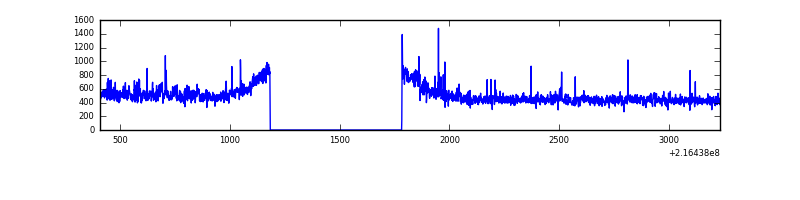 |
| C | 2824 | 2225 | 0 | 0 | 0.00% | 0.00% |  |
| D | 2824 | 2225 | 3 | 3 | 0.11% | 0.13% |  |
Top three noisy pixels from each quadrant. If the there are fewer than three noisy pixels in the level2.evt file, extra rows are filled as -1
| Pixel properties | Quadrant properties | ||||||
|---|---|---|---|---|---|---|---|
| Quadrant | DetID | PixID | Counts | Sigma | Mean | Median | Sigma |
| A | 8 | 15 | 18891 | 331.56 | 263 | 257 | 56.2 |
| A | 7 | 16 | 5674 | 96.39 | 263 | 257 | 56.2 |
| A | 10 | 1 | 2573 | 41.21 | 263 | 257 | 56.2 |
| B | 15 | 204 | 29636 | 547.0 | 269 | 263 | 53.7 |
| B | 4 | 81 | 13546 | 247.36 | 269 | 263 | 53.7 |
| B | 0 | 214 | 7623 | 137.06 | 269 | 263 | 53.7 |
| C | 9 | 54 | 2921 | 42.86 | 258 | 259 | 62.1 |
| C | 13 | 61 | 2089 | 29.46 | 258 | 259 | 62.1 |
| C | 1 | 16 | 1107 | 13.65 | 258 | 259 | 62.1 |
| D | 8 | 195 | 24481 | 375.18 | 256 | 247 | 64.6 |
| D | 12 | 221 | 13752 | 209.08 | 256 | 247 | 64.6 |
| D | 2 | 63 | 13587 | 206.52 | 256 | 247 | 64.6 |
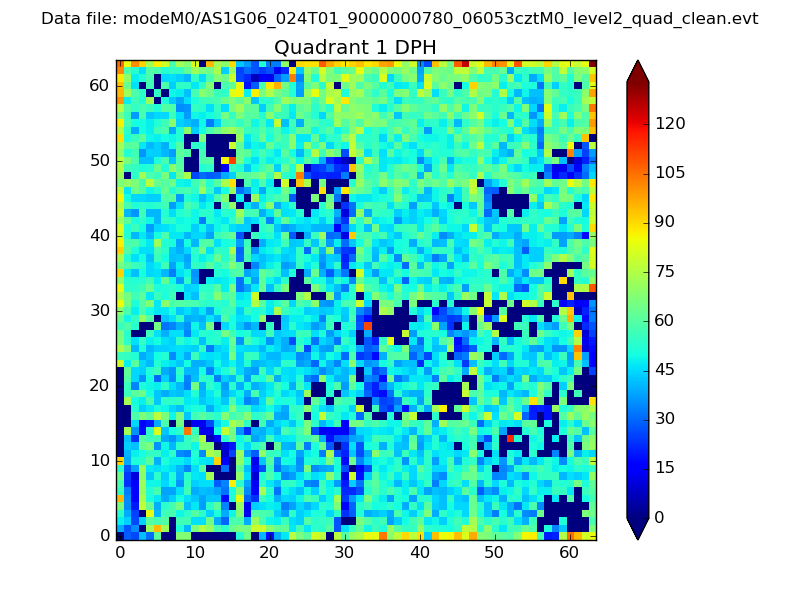
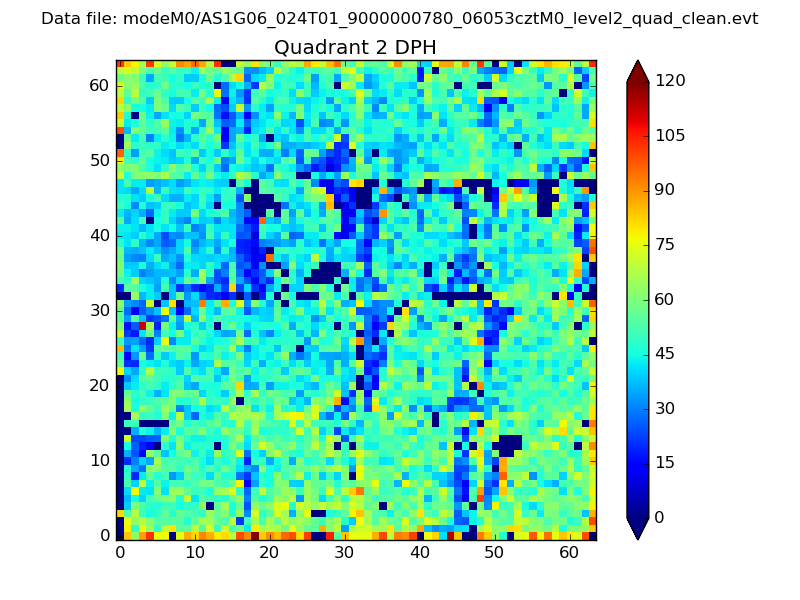
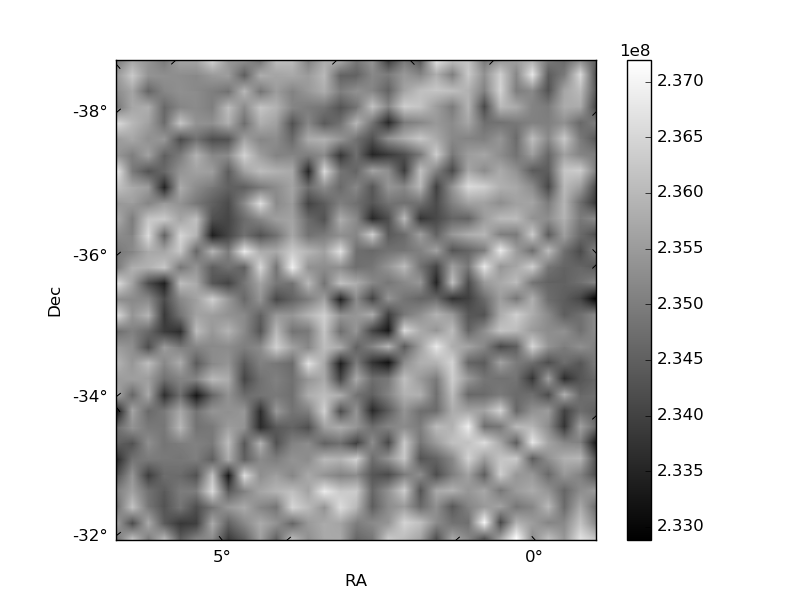
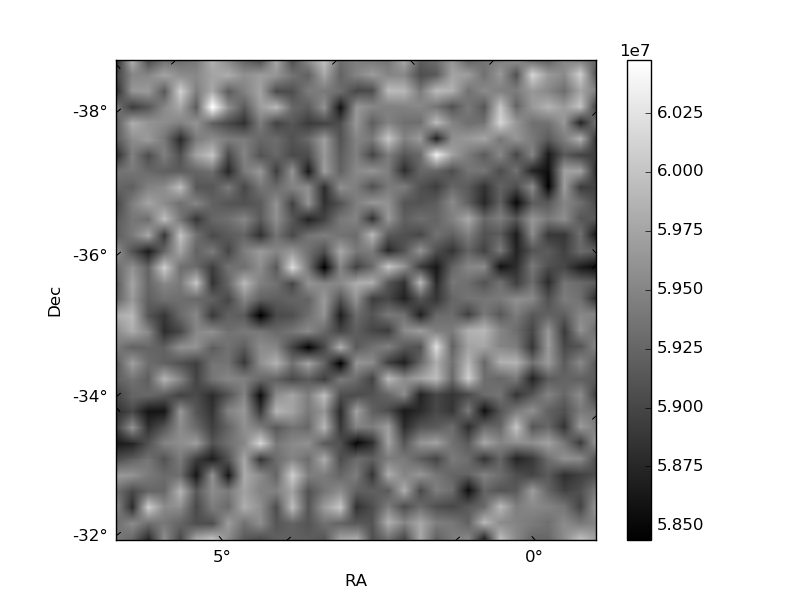
Histogram calculated using DETX and DETY for each event in the final _common_clean file
| Quadrant A | 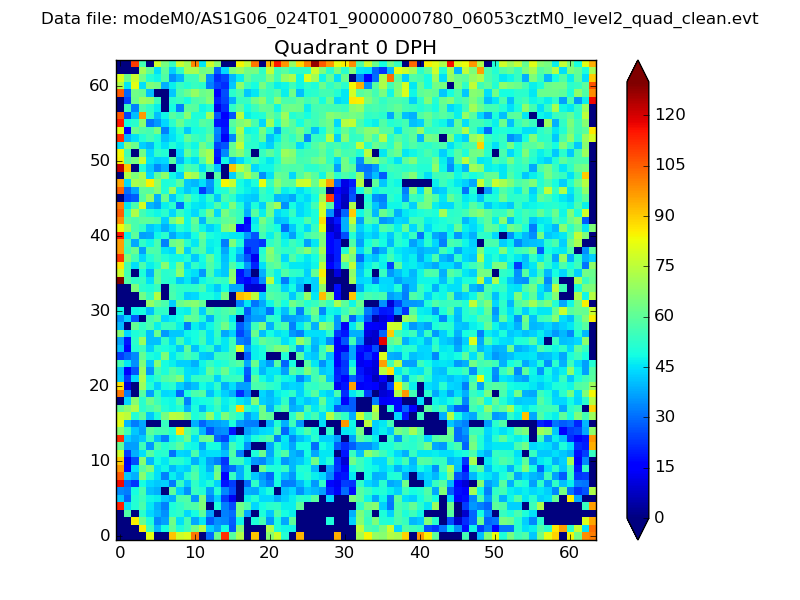 |
 |
Quadrant B |
|---|---|---|---|
| Quadrant D | 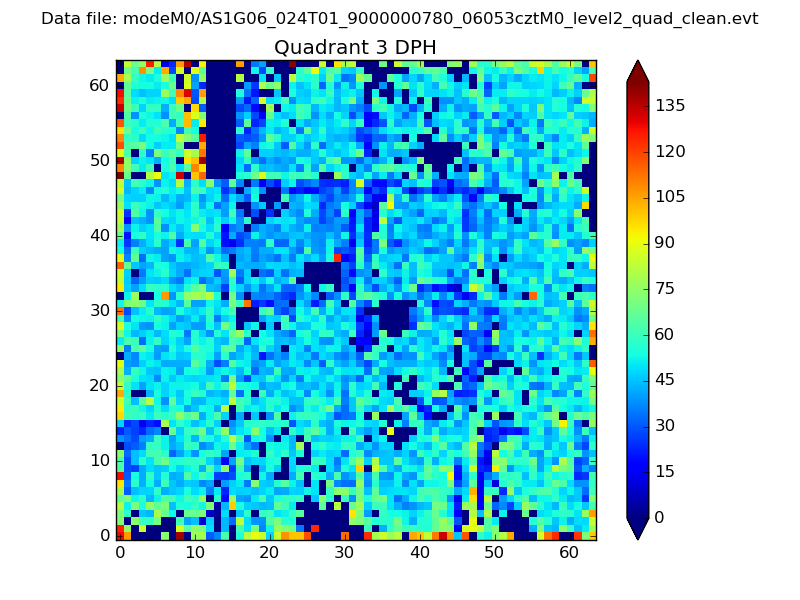 |
 |
Quadrant C |
| Plot type | Count rate plots | Images |
|---|---|---|
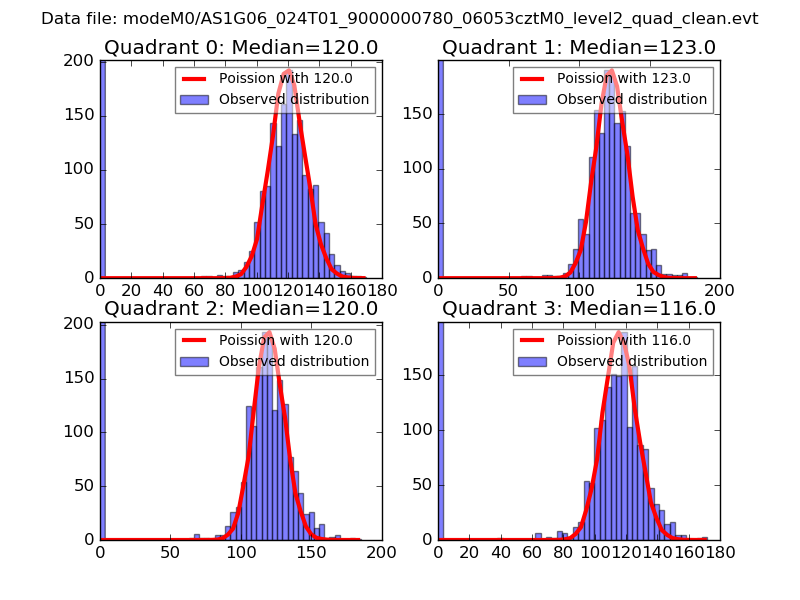
| Comparison with Poisson distribution Blue bars denote a histogram of data divided into 1 sec bins. Red curve is a Poisson curve with rate = median count rate of data. |
 |
 |
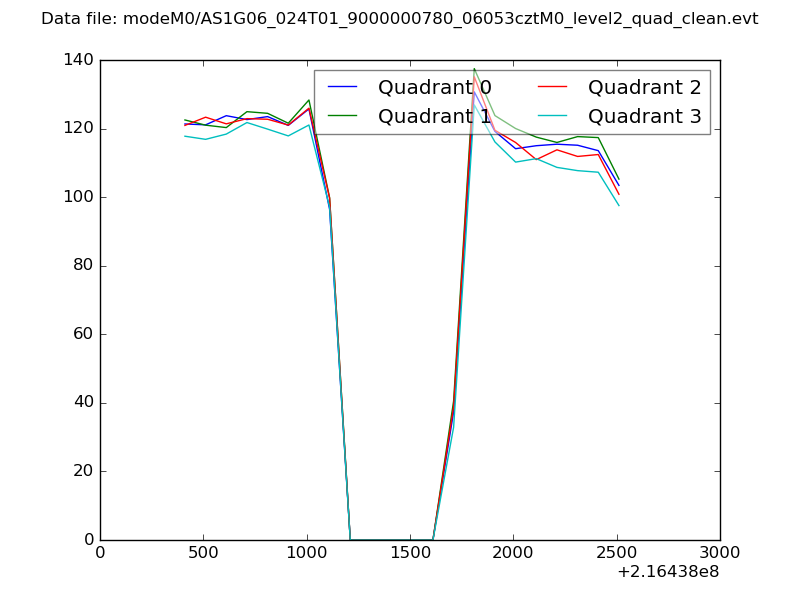
| Quadrant-wise count rates Data is divided into 100 sec bins |
 |
|
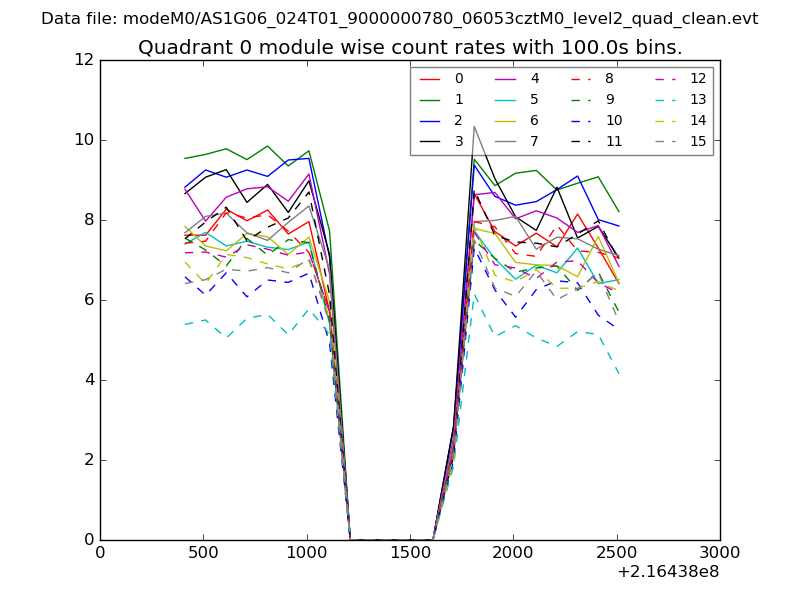
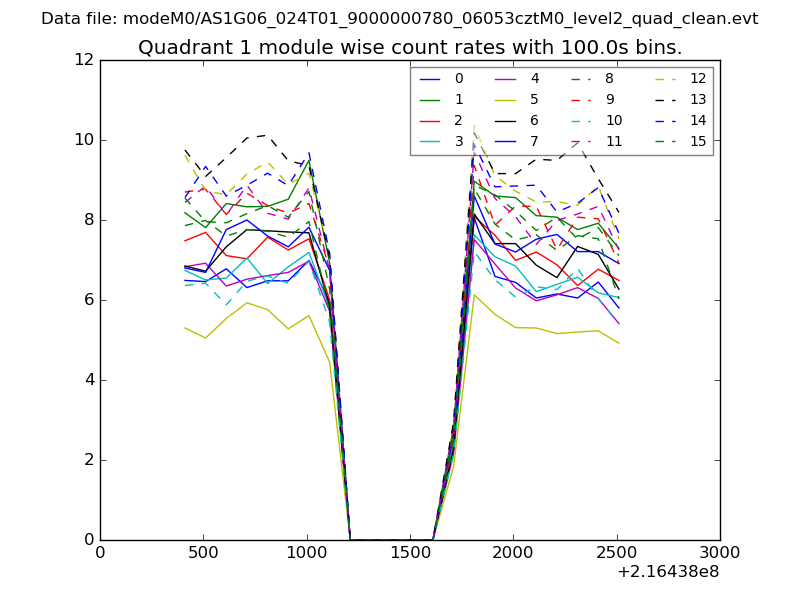
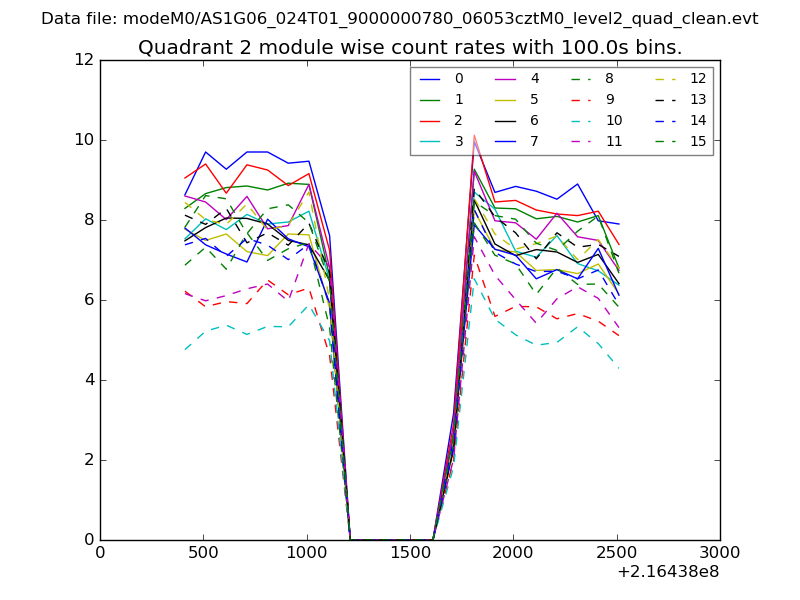
| Module-wise count rates for Quadrant A Data is divided into 100 sec bins |
 |
 |
| Module-wise count rates for Quadrant B Data is divided into 100 sec bins |
 |
 |
| Module-wise count rates for Quadrant C Data is divided into 100 sec bins |
 |
 |
| Module-wise count rates for Quadrant D Data is divided into 100 sec bins |
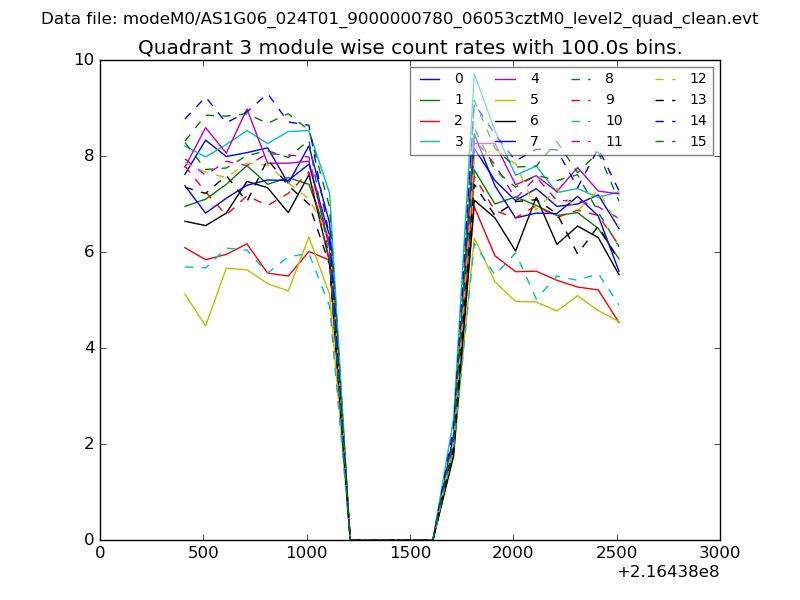 |
 |
| Parameter | Plot |
|---|---|
| CZT HV Monitor | 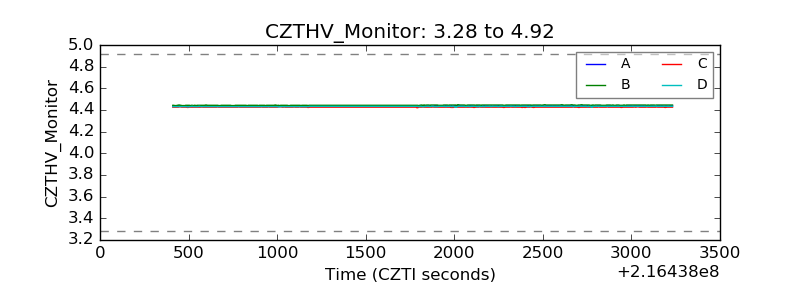 |
| D_VDD | 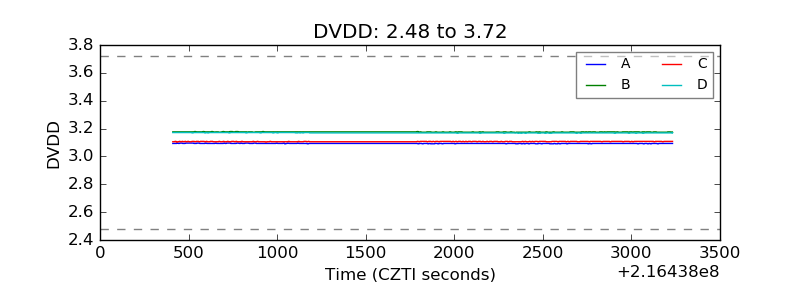 |
| Temperature 1 | 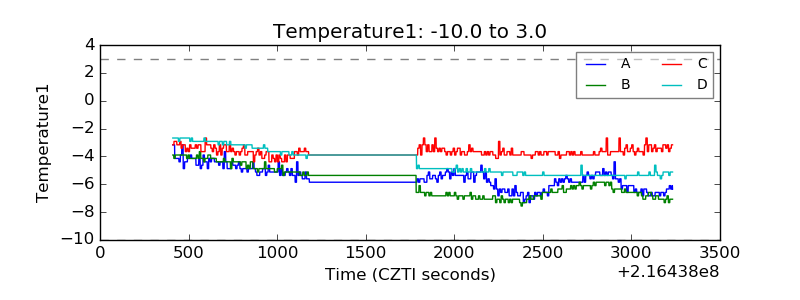 |
| Veto HV Monitor |  |
| Veto LLD | 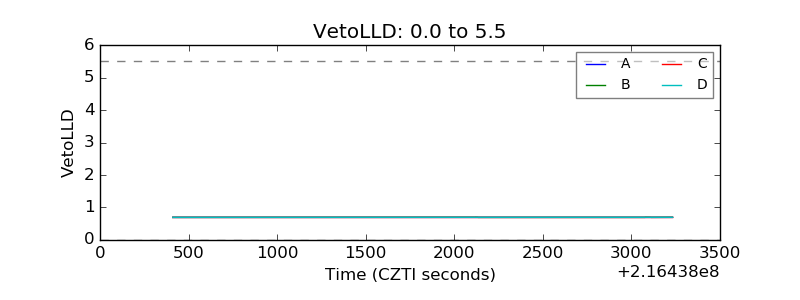 |
| Alpha Counter | 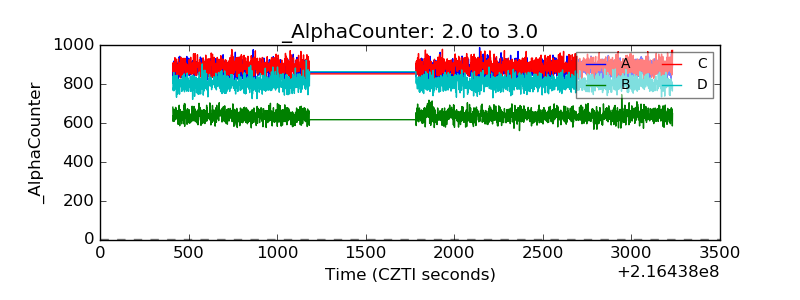 |
| _CPM_Rate | 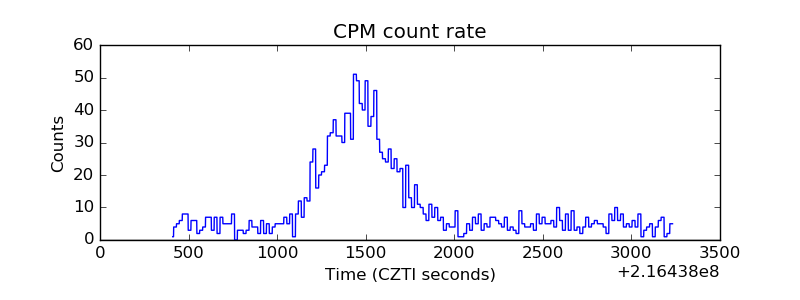 |
| CZT Counter | 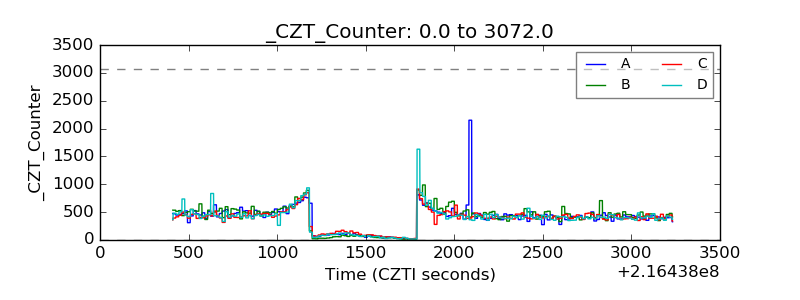 |
| +2.5 Volts monitor |  |
| +5 Volts monitor |  |
| _ROLL_ROT | 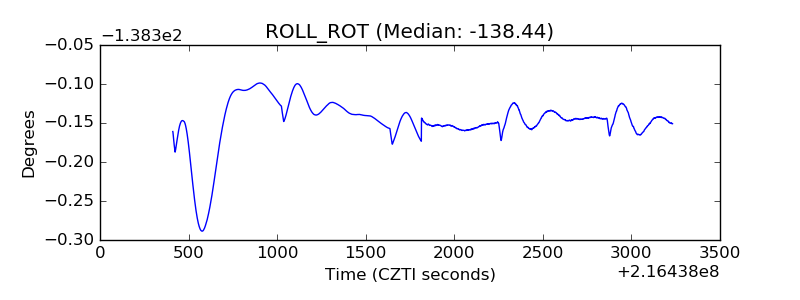 |
| _Roll_DEC | 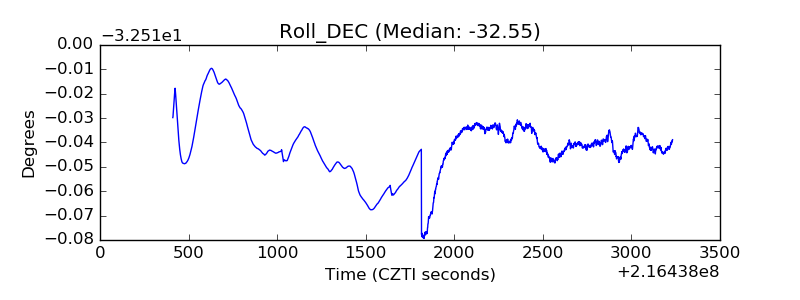 |
| _Roll_RA | 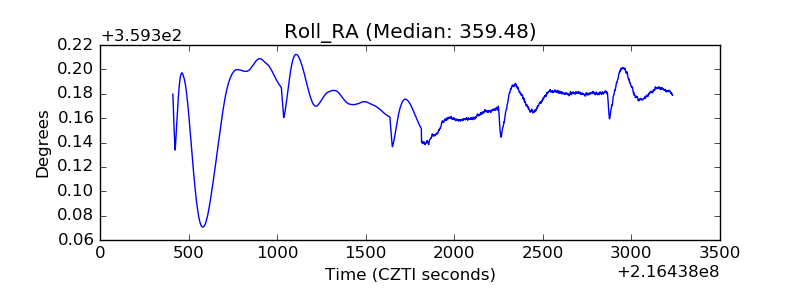 |
| Veto Counter | 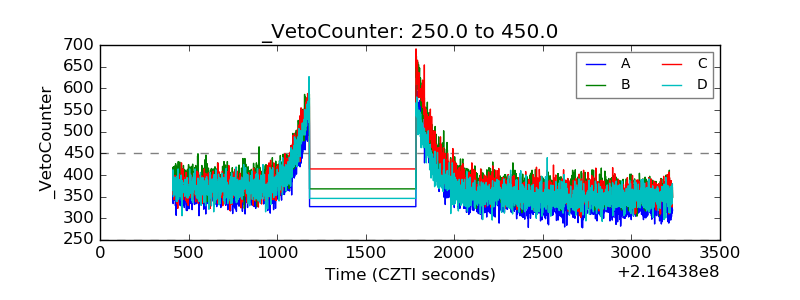 |