| Param | Original file | Final file |
|---|---|---|
| Filename | modeM0/AS1G06_024T01_9000000780_06059cztM0_level2.evt | modeM0/AS1G06_024T01_9000000780_06059cztM0_level2_quad_clean.evt |
| Size (bytes) | 719,343,360 | 143,614,080 |
| Size | 686.0 MB | 137.0 MB |
| Events in quadrant A | 5,121,253 | 906,085 |
| Events in quadrant B | 6,420,837 | 907,430 |
| Events in quadrant C | 4,706,010 | 922,488 |
| Events in quadrant D | 4,821,614 | 883,638 |
| Mode M9 | |||
|---|---|---|---|
| Quadrant | BADHDUFLAG | Total packets | Discarded packets |
| A | 0 | 16 | 1 |
| B | 0 | 16 | 1 |
| C | 0 | 16 | 0 |
| D | 0 | 16 | 1 |
| Mode M0 | |||
|---|---|---|---|
| Quadrant | BADHDUFLAG | Total packets | Discarded packets |
| A | 0 | 23329 | 1484 |
| B | 0 | 28593 | 2413 |
| C | 0 | 23034 | 1360 |
| D | 0 | 23558 | 1451 |
| Mode SS | |||
|---|---|---|---|
| Quadrant | BADHDUFLAG | Total packets | Discarded packets |
| A | 0 | 228 | 12 |
| B | 0 | 228 | 22 |
| C | 0 | 228 | 6 |
| D | 0 | 228 | 10 |
| Quadrant | Total seconds | Saturated seconds | Saturation percentage |
|---|---|---|---|
| A | 10521 | 136 | 1.292653% |
| B | 10431 | 577 | 5.531589% |
| C | 10579 | 90 | 0.850742% |
| D | 10553 | 137 | 1.298209% |
Noise dominated data is calculated using 1-second bins in cleaned event files. If a bin has >2000 counts, and if more than 50% of those come from <1% of pixels, then it is considered to be noise-dominated and hence unusable.
| Quadrant | # 1 sec bins | Bins with >0 counts | Bins with >2000 counts | High rate bins dominated by noise | Noise dominated (total time) | Noise dominated (detector-on time) | Marked lightcurve |
|---|---|---|---|---|---|---|---|
| A | 12853 | 11118 | 0 | 0 | 0.00% | 0.00% | 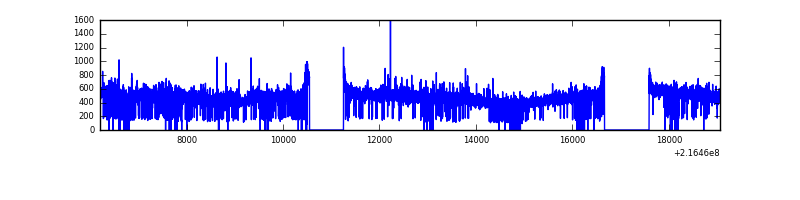 |
| B | 12853 | 11069 | 256 | 256 | 1.99% | 2.31% | 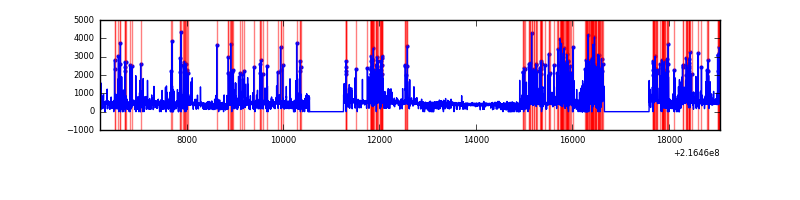 |
| C | 12853 | 11145 | 3 | 3 | 0.02% | 0.03% |  |
| D | 12853 | 11134 | 31 | 31 | 0.24% | 0.28% | 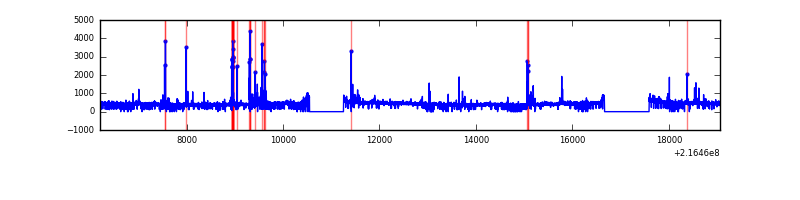 |
Top three noisy pixels from each quadrant. If the there are fewer than three noisy pixels in the level2.evt file, extra rows are filled as -1
| Pixel properties | Quadrant properties | ||||||
|---|---|---|---|---|---|---|---|
| Quadrant | DetID | PixID | Counts | Sigma | Mean | Median | Sigma |
| A | 8 | 15 | 405406 | 1610.75 | 1214 | 1187 | 251.0 |
| A | 7 | 16 | 27147 | 103.45 | 1214 | 1187 | 251.0 |
| A | 0 | 226 | 12221 | 43.97 | 1214 | 1187 | 251.0 |
| B | 3 | 64 | 1659790 | 7254.83 | 1190 | 1159 | 228.6 |
| B | 15 | 204 | 56119 | 240.39 | 1190 | 1159 | 228.6 |
| B | 0 | 214 | 50955 | 217.81 | 1190 | 1159 | 228.6 |
| C | 9 | 54 | 64186 | 229.06 | 1179 | 1185 | 275.0 |
| C | 8 | 128 | 15333 | 51.44 | 1179 | 1185 | 275.0 |
| C | 14 | 206 | 12905 | 42.61 | 1179 | 1185 | 275.0 |
| D | 2 | 14 | 86499 | 290.97 | 1181 | 1138 | 293.4 |
| D | 8 | 195 | 64618 | 216.38 | 1181 | 1138 | 293.4 |
| D | 7 | 203 | 59933 | 200.41 | 1181 | 1138 | 293.4 |
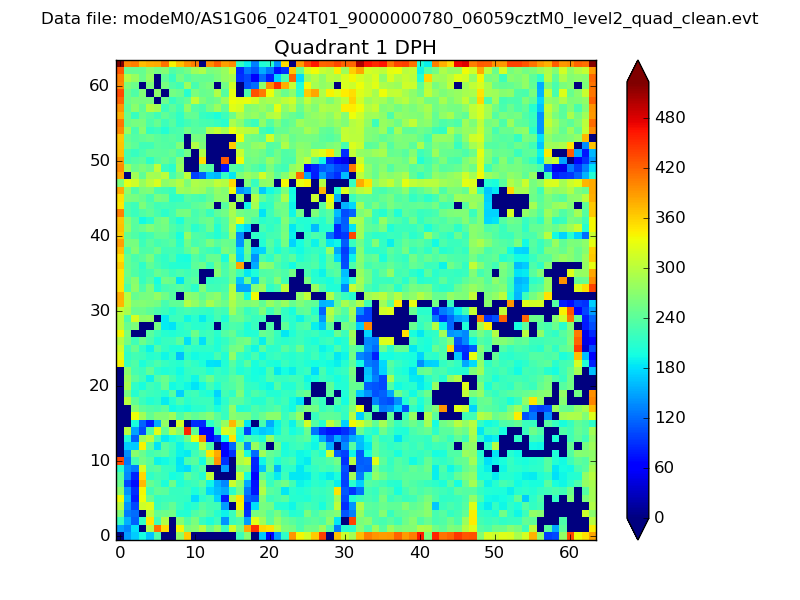
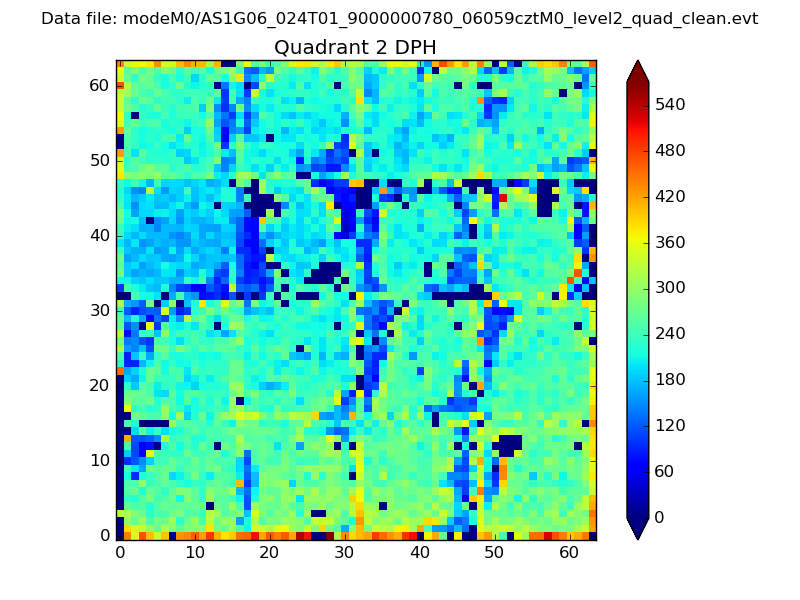
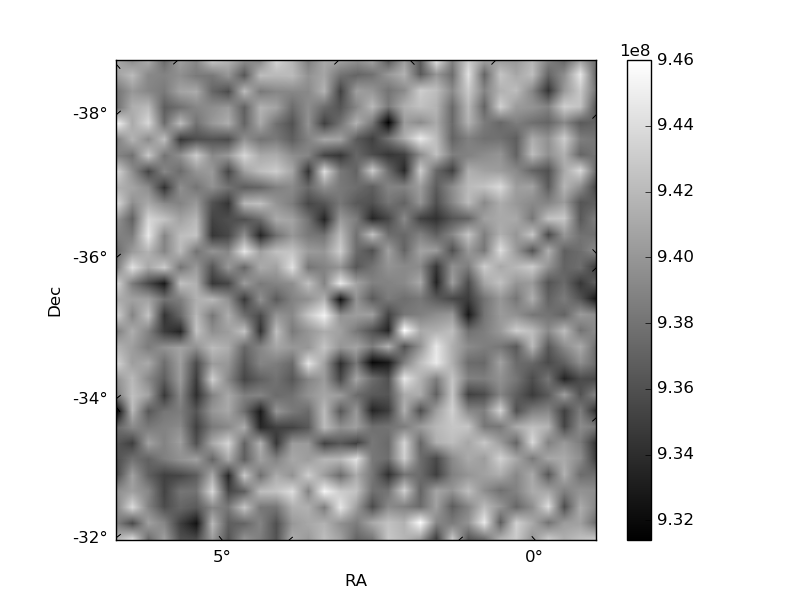
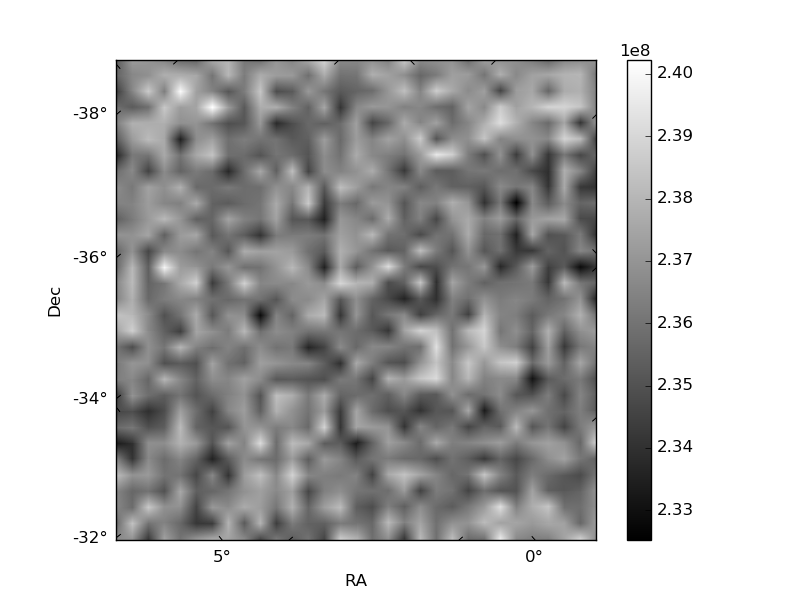
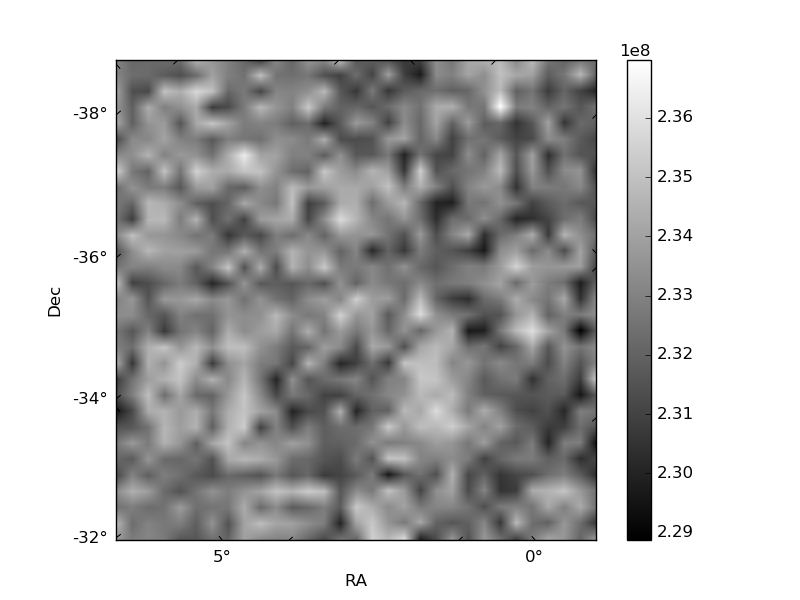
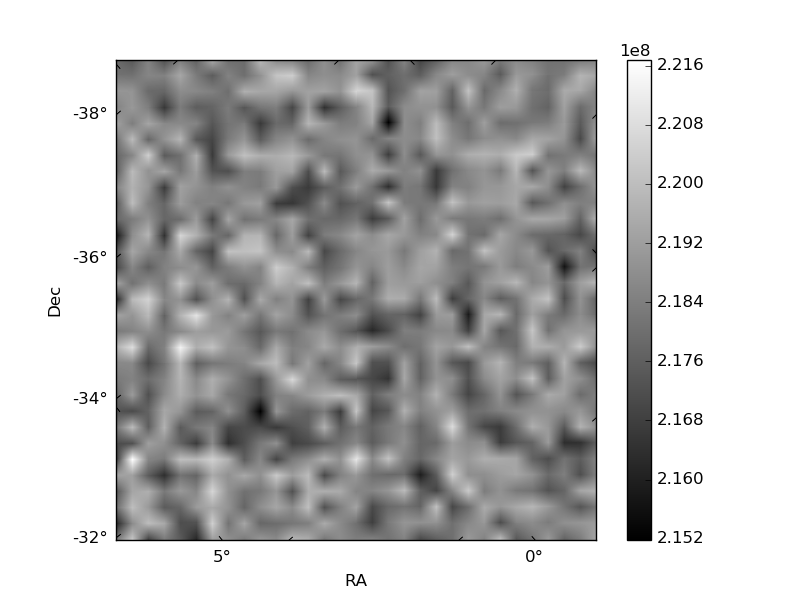
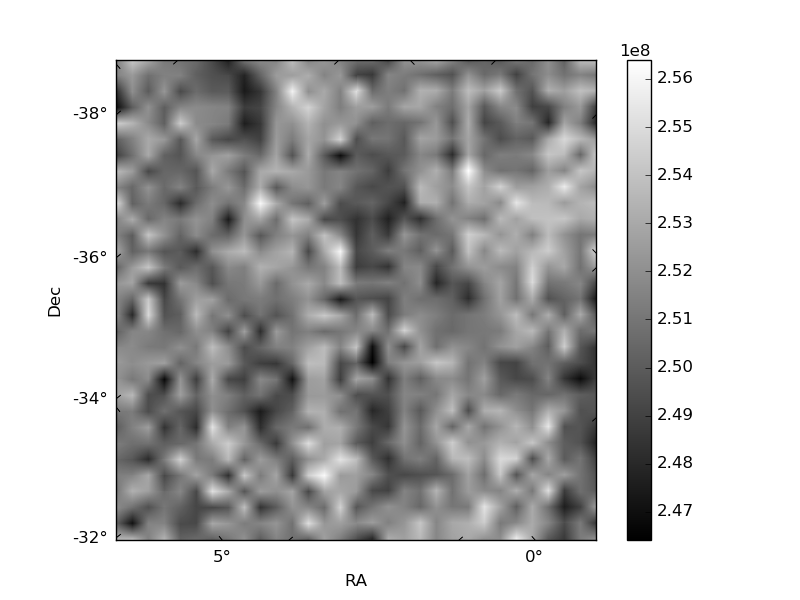
Histogram calculated using DETX and DETY for each event in the final _common_clean file
| Quadrant A | 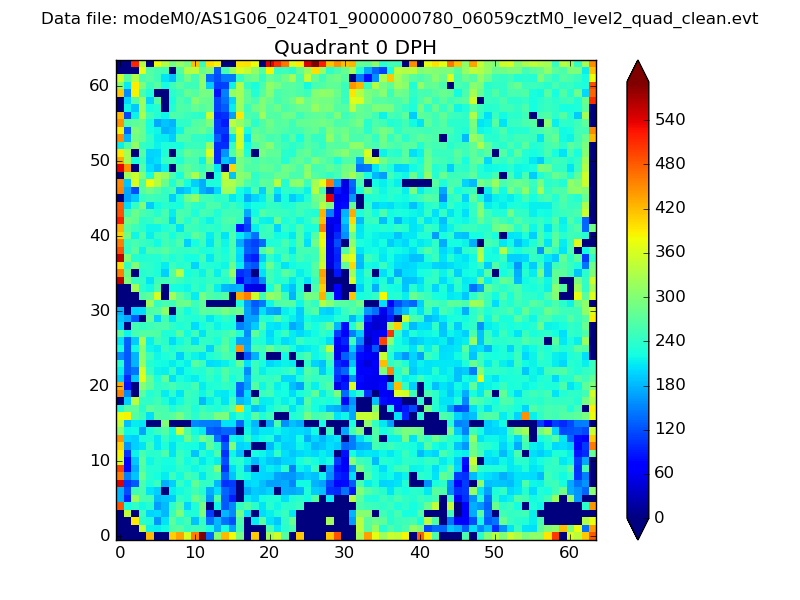 |
 |
Quadrant B |
|---|---|---|---|
| Quadrant D | 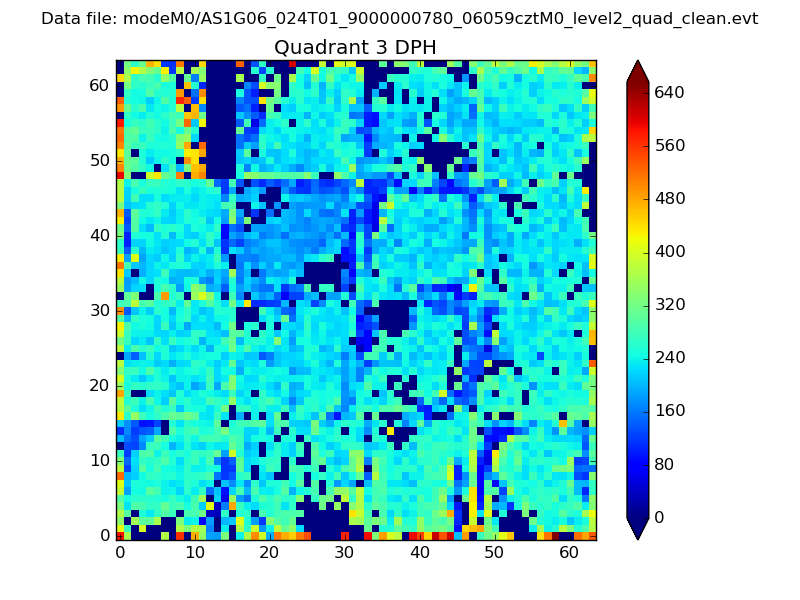 |
 |
Quadrant C |
| Plot type | Count rate plots | Images |
|---|---|---|
| Comparison with Poisson distribution Blue bars denote a histogram of data divided into 1 sec bins. Red curve is a Poisson curve with rate = median count rate of data. |
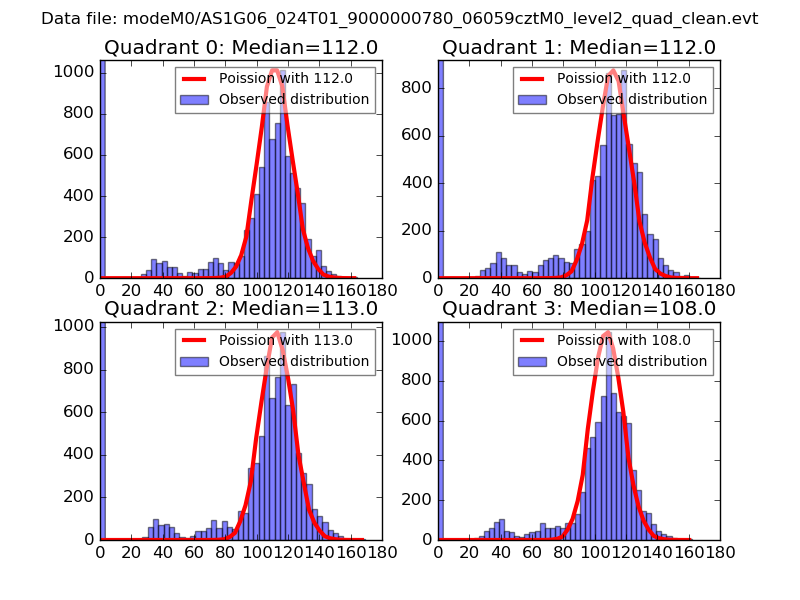 |
 |
| Quadrant-wise count rates Data is divided into 100 sec bins |
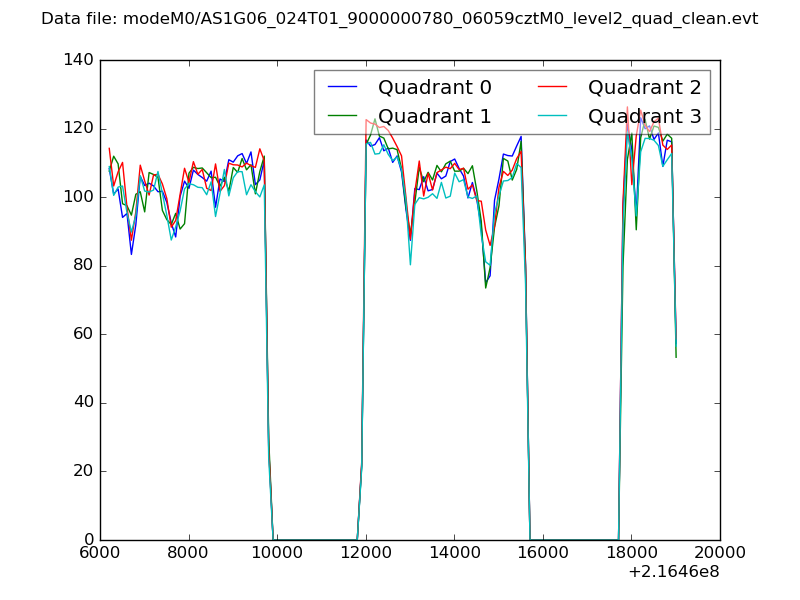 |
|
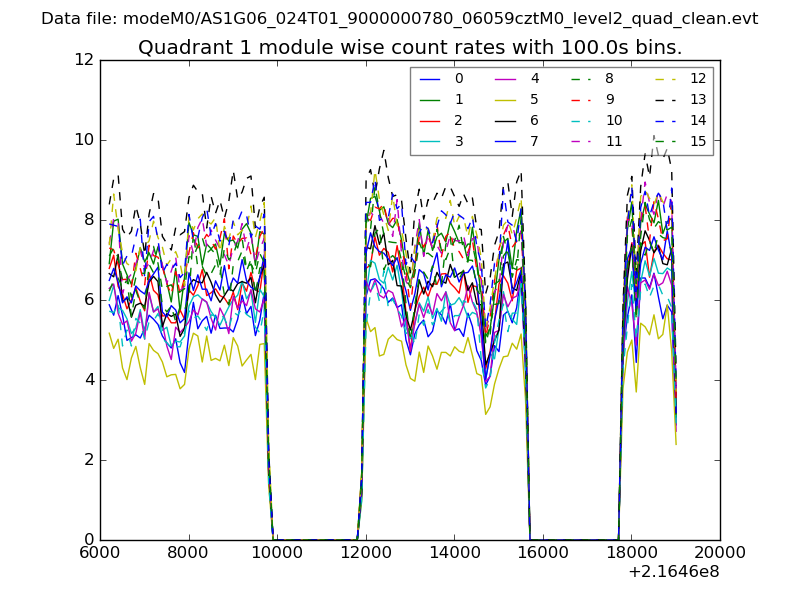
| Module-wise count rates for Quadrant A Data is divided into 100 sec bins |
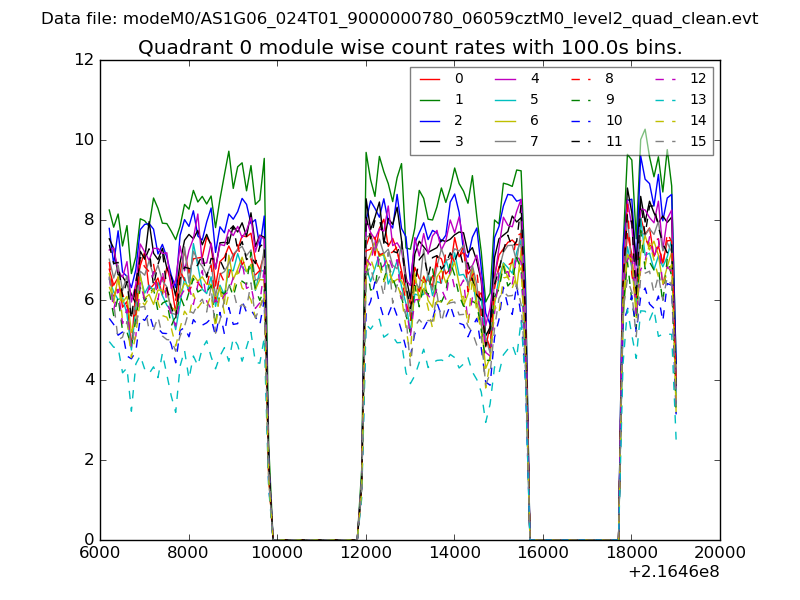 |
 |
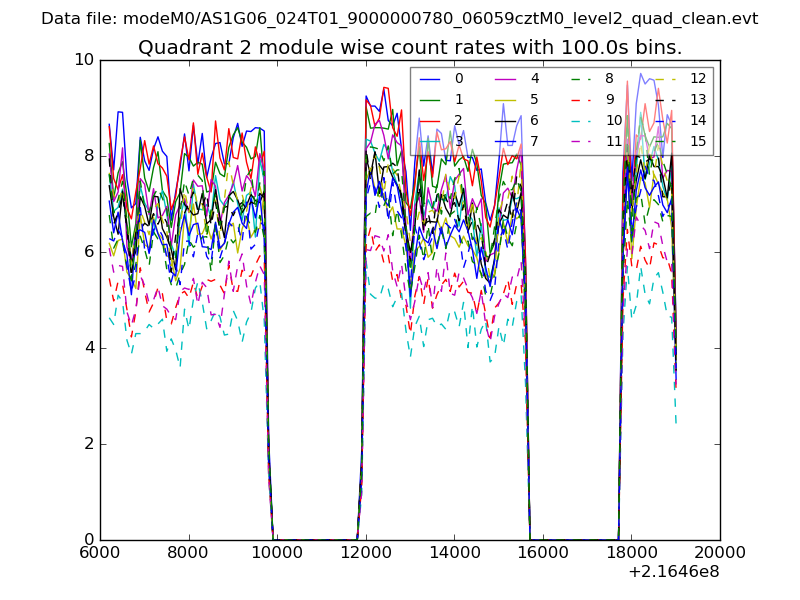
| Module-wise count rates for Quadrant B Data is divided into 100 sec bins |
 |
 |
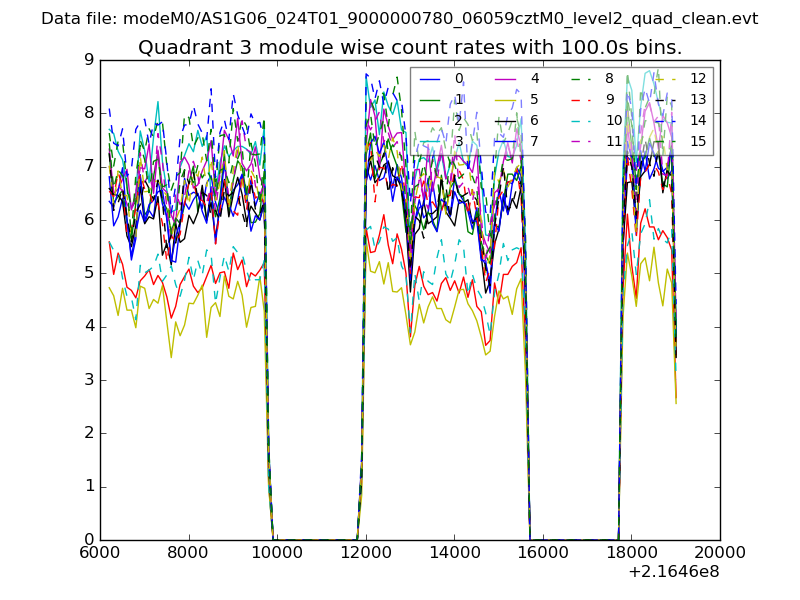
| Module-wise count rates for Quadrant C Data is divided into 100 sec bins |
 |
 |
| Module-wise count rates for Quadrant D Data is divided into 100 sec bins |
 |
 |
| Parameter | Plot |
|---|---|
| CZT HV Monitor | 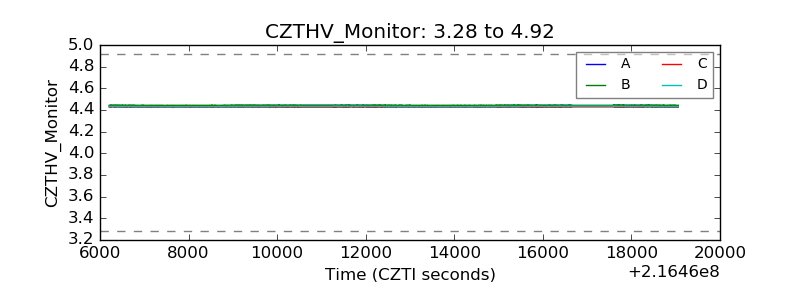 |
| D_VDD | 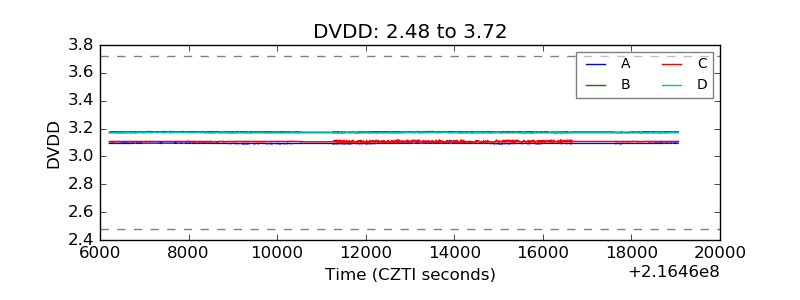 |
| Temperature 1 | 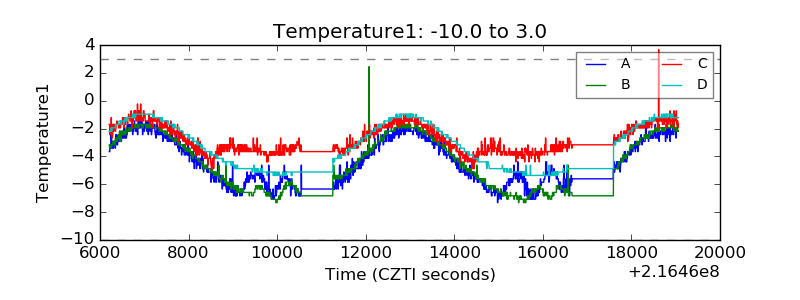 |
| Veto HV Monitor |  |
| Veto LLD |  |
| Alpha Counter | 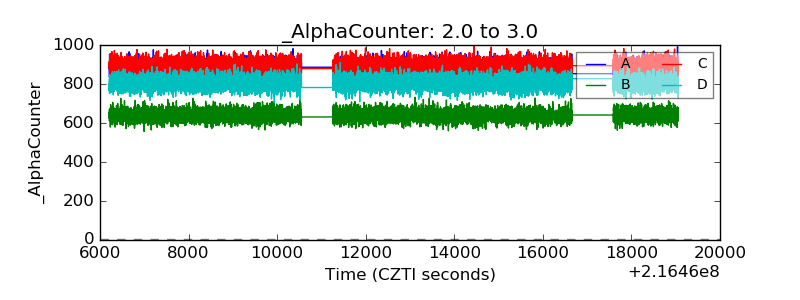 |
| _CPM_Rate | 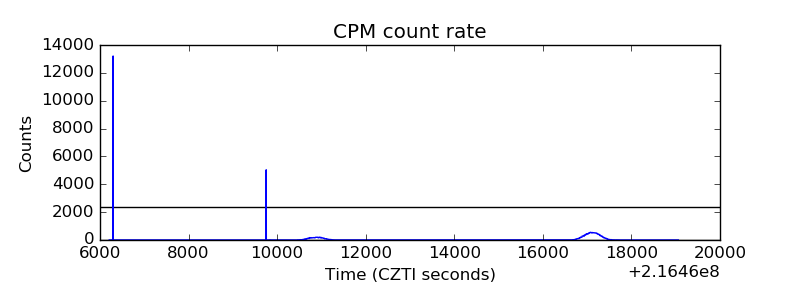 |
| CZT Counter | 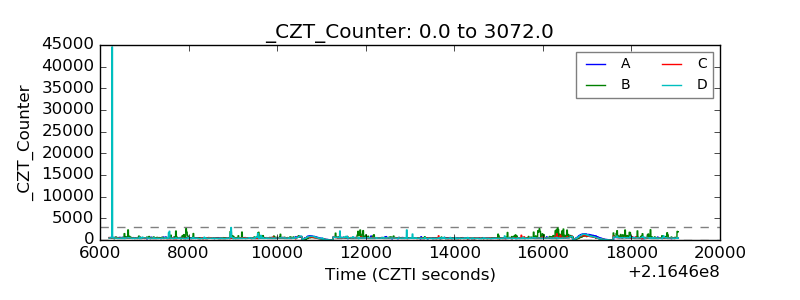 |
| +2.5 Volts monitor |  |
| +5 Volts monitor | 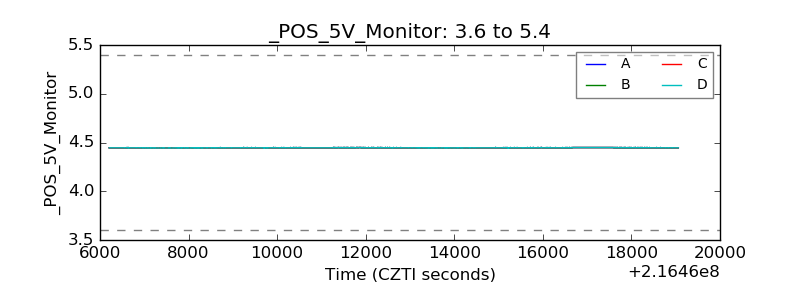 |
| _ROLL_ROT | 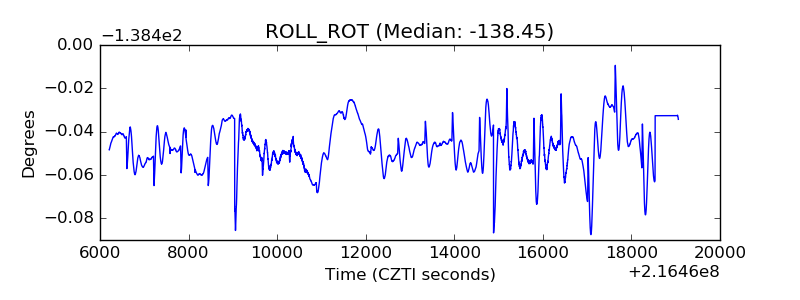 |
| _Roll_DEC | 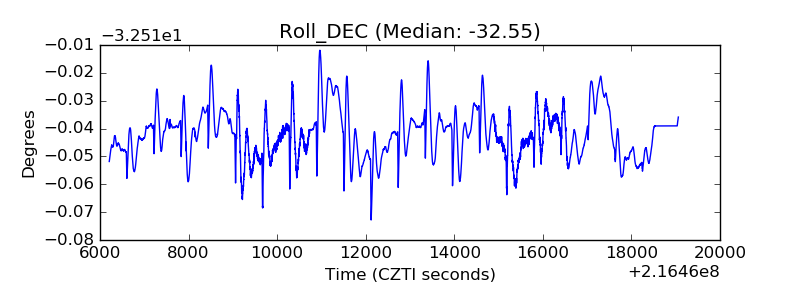 |
| _Roll_RA | 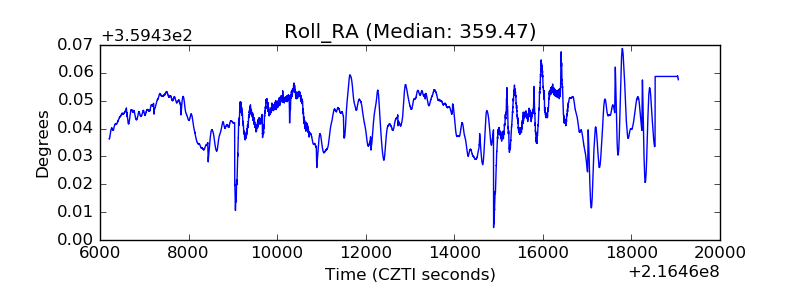 |
| Veto Counter | 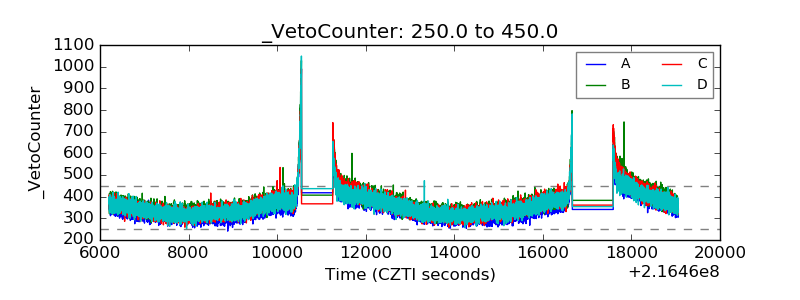 |