| Param | Original file | Final file |
|---|---|---|
| Filename | modeM0/AS1G06_024T01_9000000780_06060cztM0_level2.evt | modeM0/AS1G06_024T01_9000000780_06060cztM0_level2_quad_clean.evt |
| Size (bytes) | 1,904,253,120 | 345,790,080 |
| Size | 1.8 GB | 329.8 MB |
| Events in quadrant A | 13,318,587 | 2,149,598 |
| Events in quadrant B | 15,616,174 | 2,162,356 |
| Events in quadrant C | 12,415,300 | 2,174,127 |
| Events in quadrant D | 14,436,023 | 2,070,398 |
| Mode M9 | |||
|---|---|---|---|
| Quadrant | BADHDUFLAG | Total packets | Discarded packets |
| A | 0 | 15 | 0 |
| B | 0 | 15 | 0 |
| C | 0 | 15 | 0 |
| D | 0 | 15 | 0 |
| Mode M0 | |||
|---|---|---|---|
| Quadrant | BADHDUFLAG | Total packets | Discarded packets |
| A | 0 | 60159 | 1842 |
| B | 0 | 67792 | 2466 |
| C | 0 | 59194 | 1609 |
| D | 0 | 64169 | 1834 |
| Mode SS | |||
|---|---|---|---|
| Quadrant | BADHDUFLAG | Total packets | Discarded packets |
| A | 0 | 582 | 16 |
| B | 0 | 582 | 12 |
| C | 0 | 582 | 14 |
| D | 0 | 582 | 22 |
| Quadrant | Total seconds | Saturated seconds | Saturation percentage |
|---|---|---|---|
| A | 27818 | 515 | 1.851319% |
| B | 27796 | 1120 | 4.029357% |
| C | 27911 | 455 | 1.630182% |
| D | 27879 | 625 | 2.241831% |
Noise dominated data is calculated using 1-second bins in cleaned event files. If a bin has >2000 counts, and if more than 50% of those come from <1% of pixels, then it is considered to be noise-dominated and hence unusable.
| Quadrant | # 1 sec bins | Bins with >0 counts | Bins with >2000 counts | High rate bins dominated by noise | Noise dominated (total time) | Noise dominated (detector-on time) | Marked lightcurve |
|---|---|---|---|---|---|---|---|
| A | 44228 | 28464 | 0 | 0 | 0.00% | 0.00% | 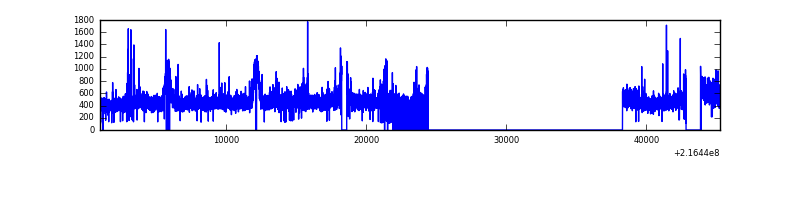 |
| B | 44228 | 28402 | 361 | 361 | 0.82% | 1.27% | 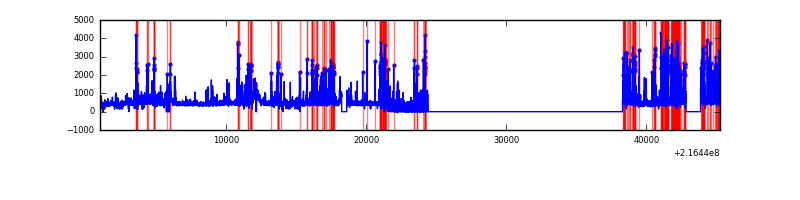 |
| C | 44228 | 28521 | 0 | 0 | 0.00% | 0.00% | 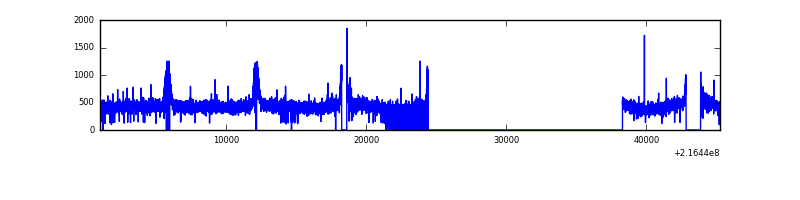 |
| D | 44228 | 28489 | 94 | 94 | 0.21% | 0.33% | 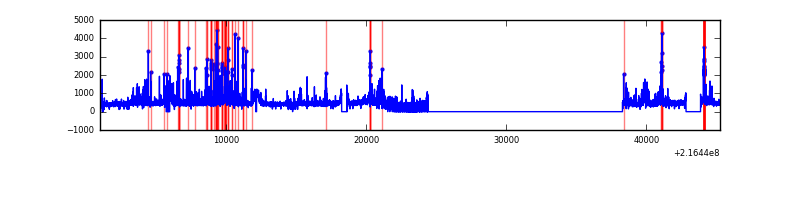 |
Top three noisy pixels from each quadrant. If the there are fewer than three noisy pixels in the level2.evt file, extra rows are filled as -1
| Pixel properties | Quadrant properties | ||||||
|---|---|---|---|---|---|---|---|
| Quadrant | DetID | PixID | Counts | Sigma | Mean | Median | Sigma |
| A | 8 | 15 | 752506 | 1132.63 | 3240 | 3166 | 661.6 |
| A | 7 | 16 | 44261 | 62.12 | 3240 | 3166 | 661.6 |
| A | 13 | 251 | 31188 | 42.36 | 3240 | 3166 | 661.6 |
| B | 3 | 64 | 2516707 | 4021.36 | 3242 | 3163 | 625.0 |
| B | 15 | 204 | 338759 | 536.91 | 3242 | 3163 | 625.0 |
| B | 0 | 214 | 69035 | 105.39 | 3242 | 3163 | 625.0 |
| C | 13 | 61 | 25150 | 29.86 | 3164 | 3179 | 735.8 |
| C | 8 | 128 | 18418 | 20.71 | 3164 | 3179 | 735.8 |
| C | 9 | 16 | 17584 | 19.58 | 3164 | 3179 | 735.8 |
| D | 12 | 221 | 750707 | 952.15 | 3162 | 3061 | 785.2 |
| D | 2 | 63 | 457763 | 579.08 | 3162 | 3061 | 785.2 |
| D | 11 | 241 | 376571 | 475.67 | 3162 | 3061 | 785.2 |
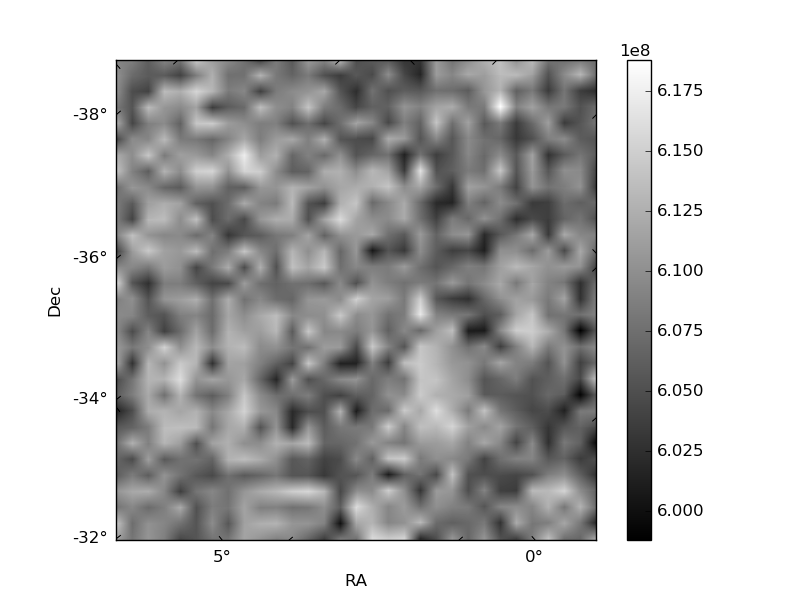
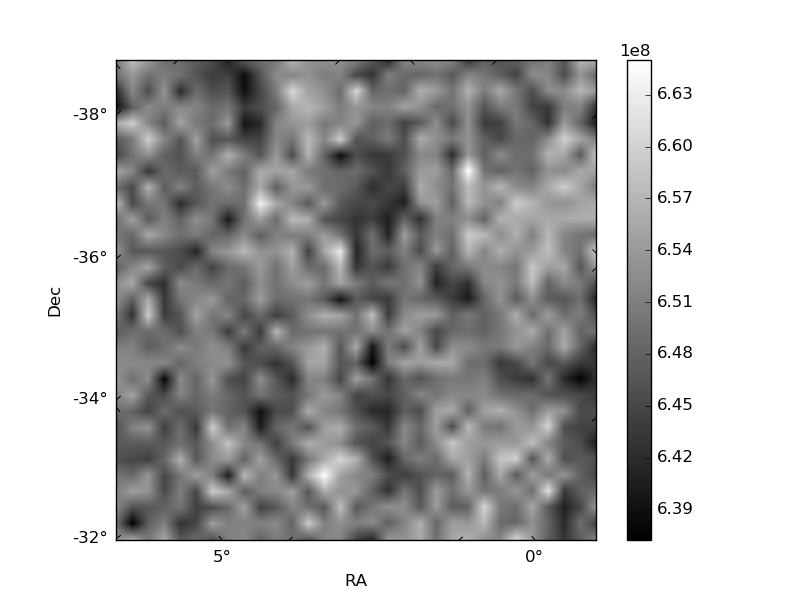
Histogram calculated using DETX and DETY for each event in the final _common_clean file
| Quadrant A | 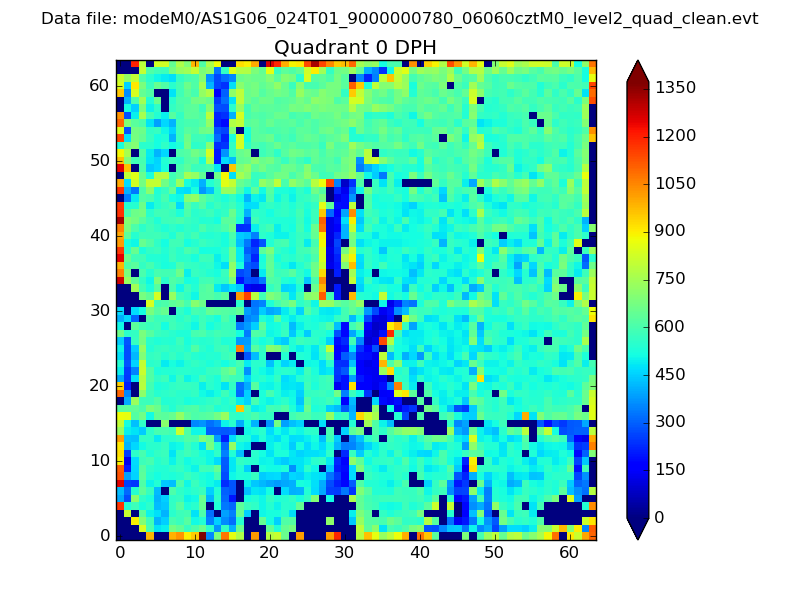 |
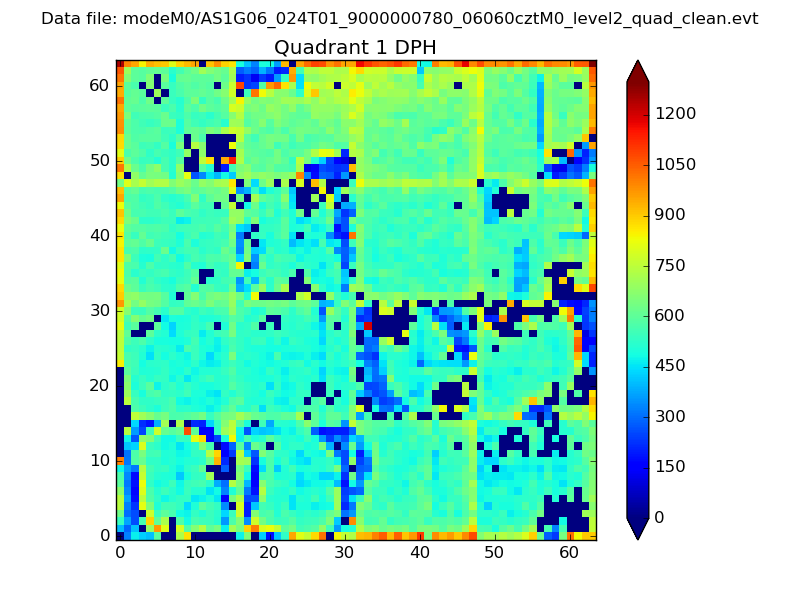 |
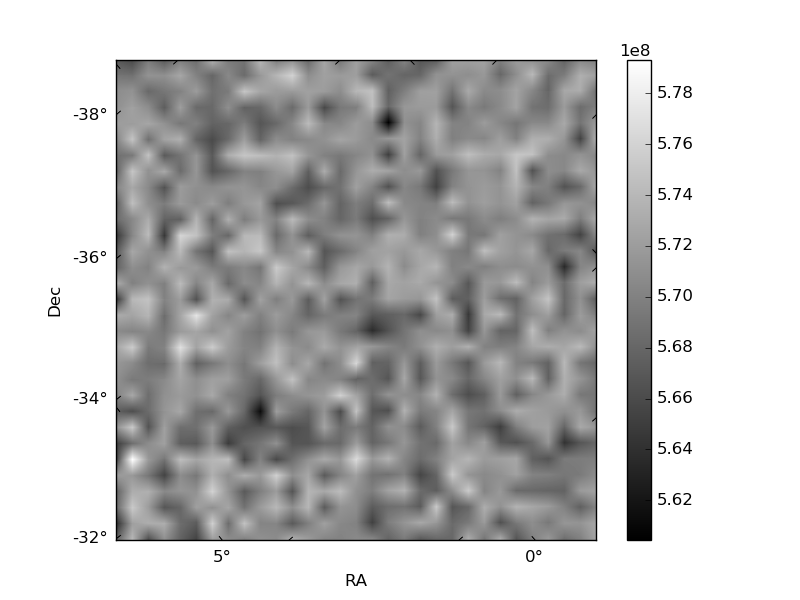
Quadrant B |
|---|---|---|---|
| Quadrant D | 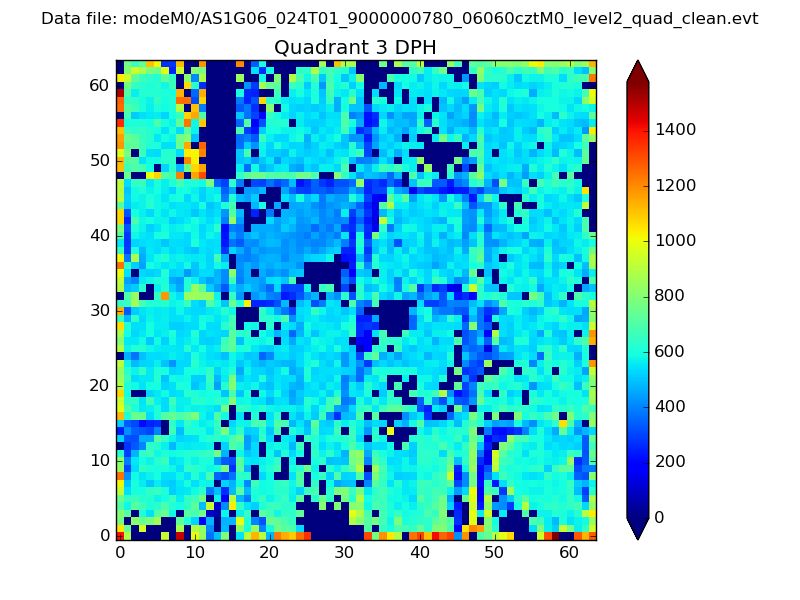 |
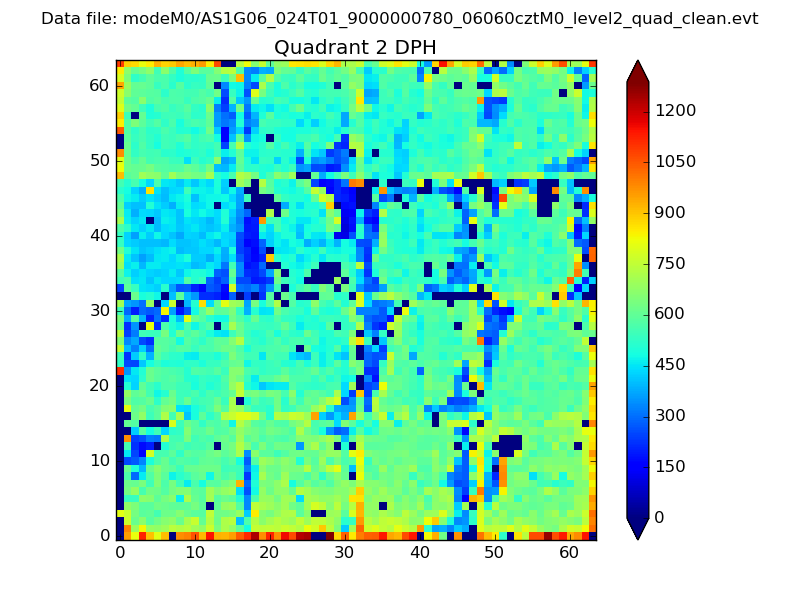 |
Quadrant C |
| Plot type | Count rate plots | Images |
|---|---|---|
| Comparison with Poisson distribution Blue bars denote a histogram of data divided into 1 sec bins. Red curve is a Poisson curve with rate = median count rate of data. |
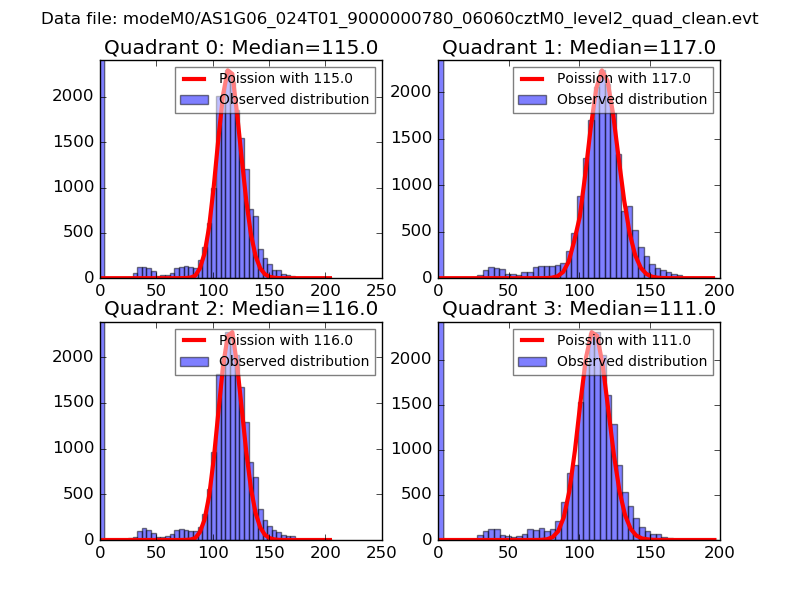 |
 |
| Quadrant-wise count rates Data is divided into 100 sec bins |
 |
|
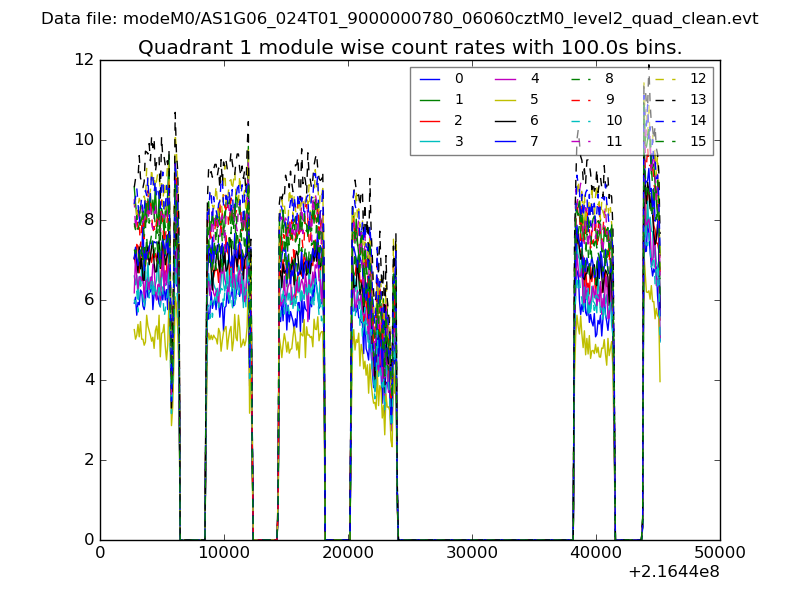
| Module-wise count rates for Quadrant A Data is divided into 100 sec bins |
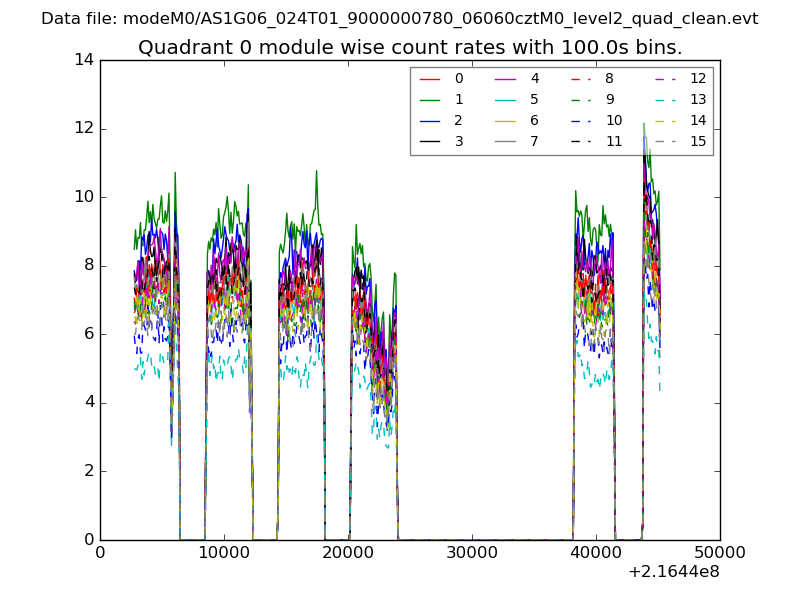 |
 |
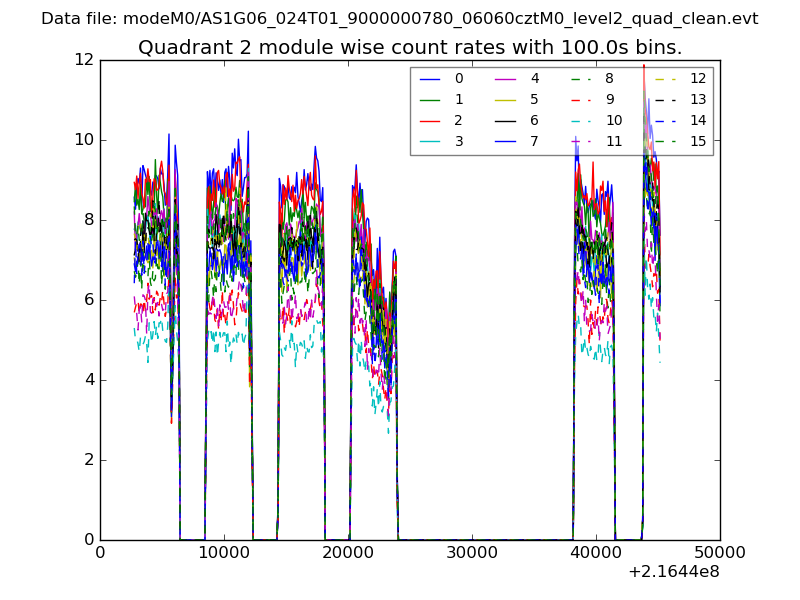
| Module-wise count rates for Quadrant B Data is divided into 100 sec bins |
 |
 |
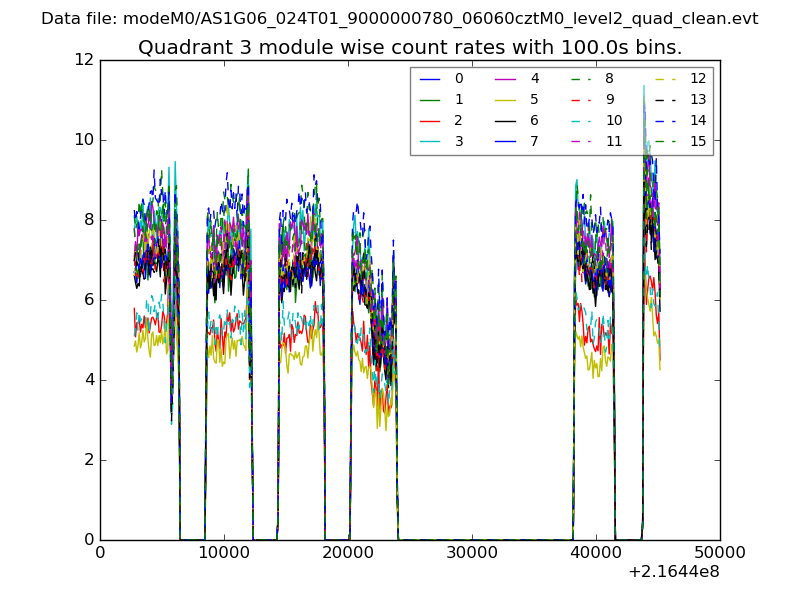
| Module-wise count rates for Quadrant C Data is divided into 100 sec bins |
 |
 |
| Module-wise count rates for Quadrant D Data is divided into 100 sec bins |
 |
 |
| Parameter | Plot |
|---|---|
| CZT HV Monitor | 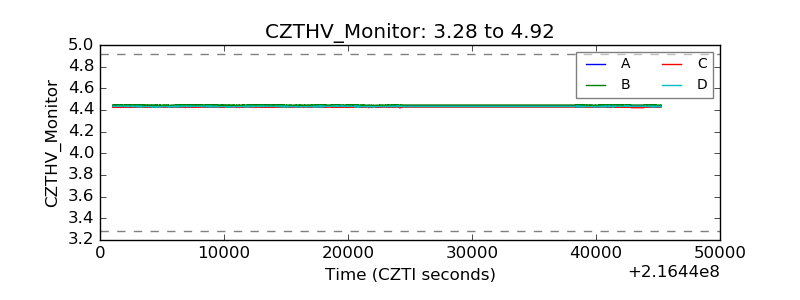 |
| D_VDD | 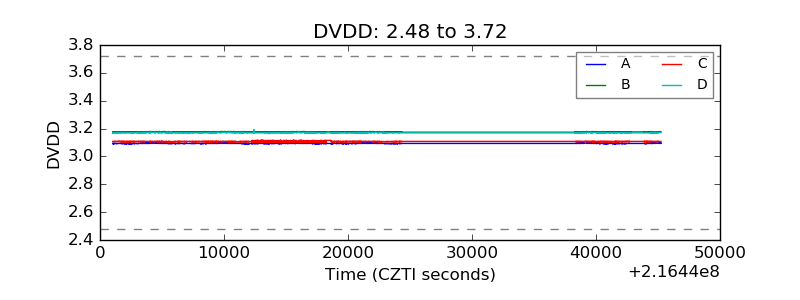 |
| Temperature 1 | 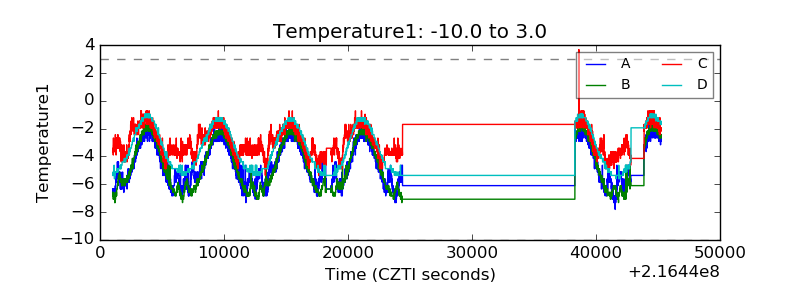 |
| Veto HV Monitor | 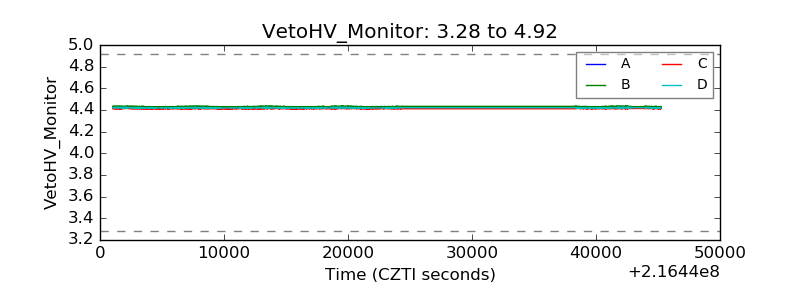 |
| Veto LLD | 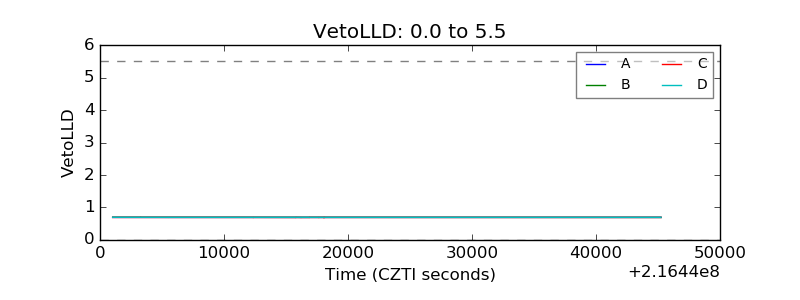 |
| Alpha Counter | 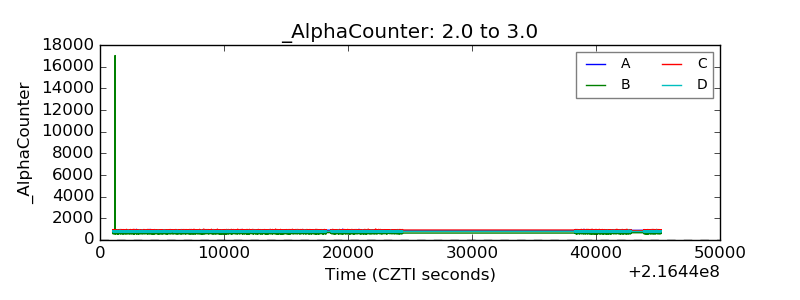 |
| _CPM_Rate | 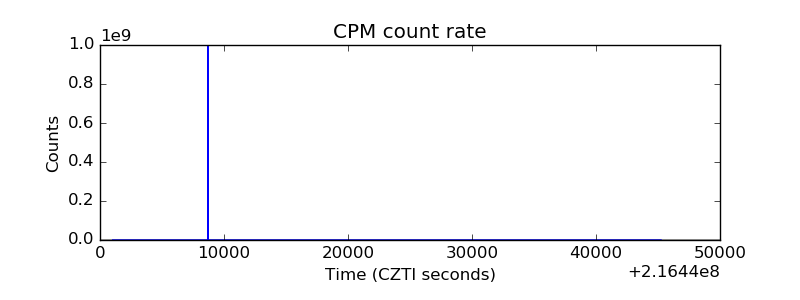 |
| CZT Counter | 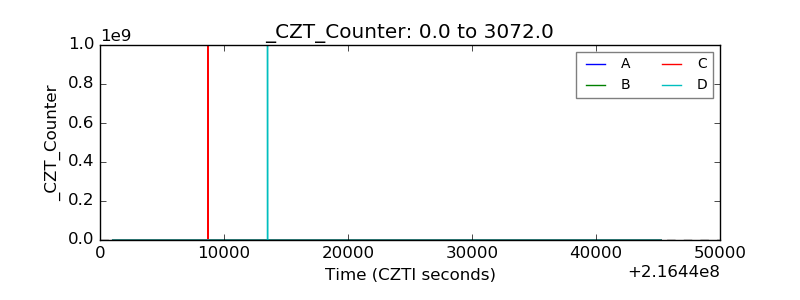 |
| +2.5 Volts monitor | 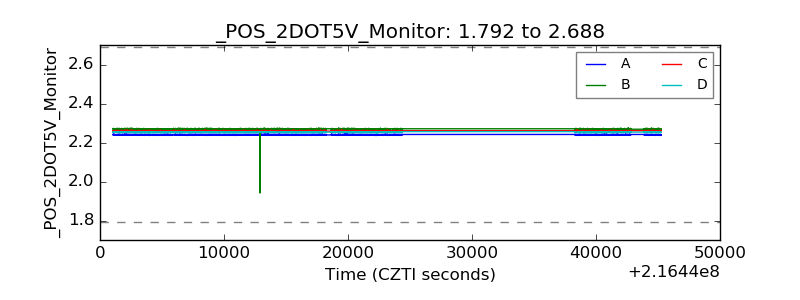 |
| +5 Volts monitor |  |
| _ROLL_ROT | 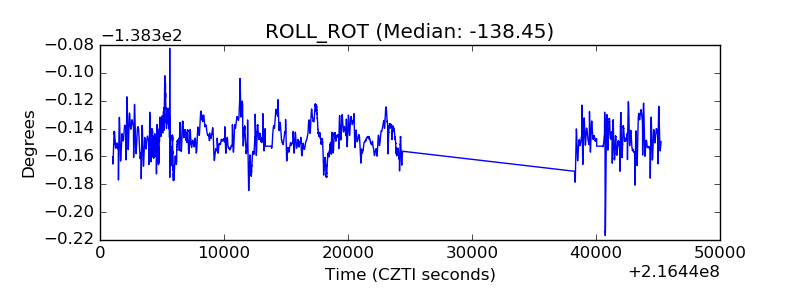 |
| _Roll_DEC | 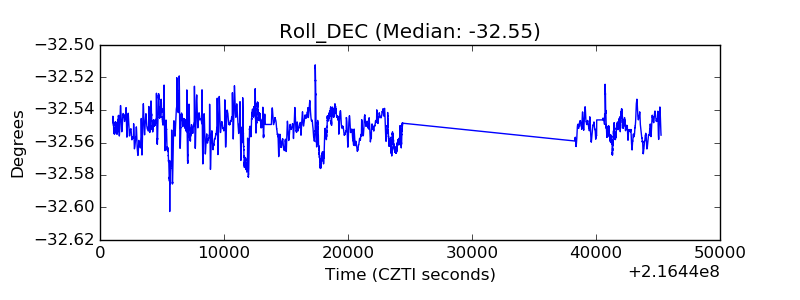 |
| _Roll_RA | 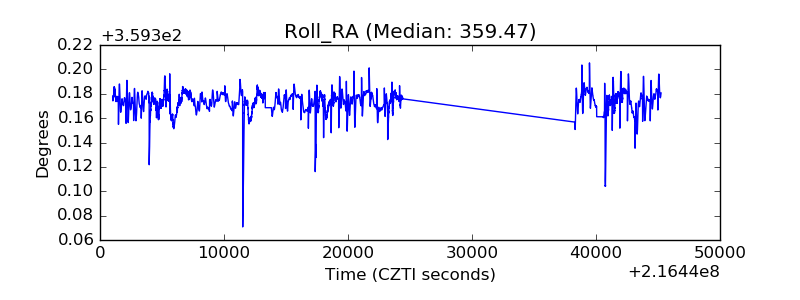 |
| Veto Counter | 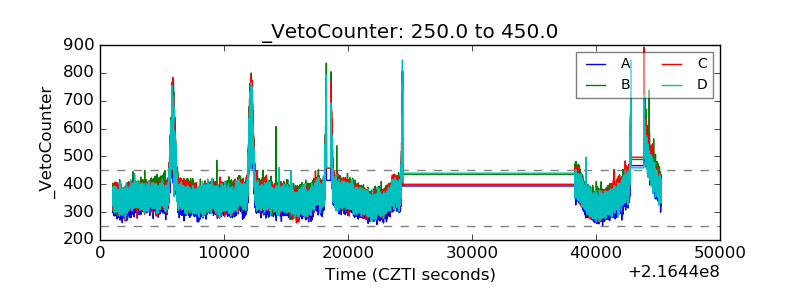 |