| Param | Original file | Final file |
|---|---|---|
| Filename | modeM0/AS1G06_024T01_9000000780_06062cztM0_level2.evt | modeM0/AS1G06_024T01_9000000780_06062cztM0_level2_quad_clean.evt |
| Size (bytes) | 162,685,440 | 42,831,360 |
| Size | 155.1 MB | 40.8 MB |
| Events in quadrant A | 1,197,454 | 287,305 |
| Events in quadrant B | 1,408,968 | 287,967 |
| Events in quadrant C | 1,006,214 | 284,764 |
| Events in quadrant D | 1,157,440 | 272,708 |
| Mode M0 | |||
|---|---|---|---|
| Quadrant | BADHDUFLAG | Total packets | Discarded packets |
| A | 0 | 5050 | 0 |
| B | 0 | 5728 | 0 |
| C | 0 | 4649 | 0 |
| D | 0 | 5027 | 0 |
| Mode SS | |||
|---|---|---|---|
| Quadrant | BADHDUFLAG | Total packets | Discarded packets |
| A | 0 | 46 | 0 |
| B | 0 | 46 | 0 |
| C | 0 | 46 | 0 |
| D | 0 | 46 | 0 |
| Quadrant | Total seconds | Saturated seconds | Saturation percentage |
|---|---|---|---|
| A | 2271 | 5 | 0.220167% |
| B | 2271 | 77 | 3.390577% |
| C | 2271 | 1 | 0.044033% |
| D | 2271 | 38 | 1.673272% |
Noise dominated data is calculated using 1-second bins in cleaned event files. If a bin has >2000 counts, and if more than 50% of those come from <1% of pixels, then it is considered to be noise-dominated and hence unusable.
| Quadrant | # 1 sec bins | Bins with >0 counts | Bins with >2000 counts | High rate bins dominated by noise | Noise dominated (total time) | Noise dominated (detector-on time) | Marked lightcurve |
|---|---|---|---|---|---|---|---|
| A | 2271 | 2271 | 0 | 0 | 0.00% | 0.00% | 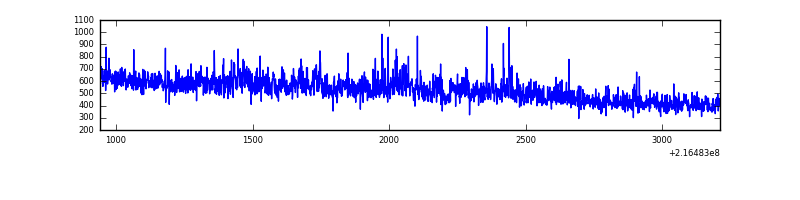 |
| B | 2271 | 2271 | 48 | 48 | 2.11% | 2.11% | 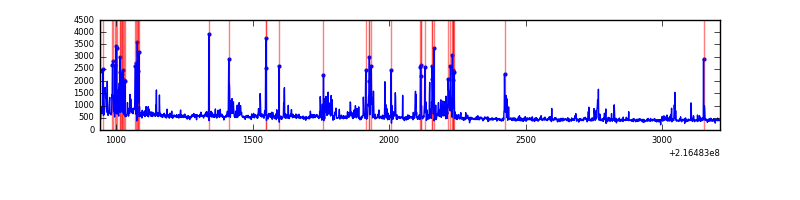 |
| C | 2271 | 2271 | 0 | 0 | 0.00% | 0.00% | 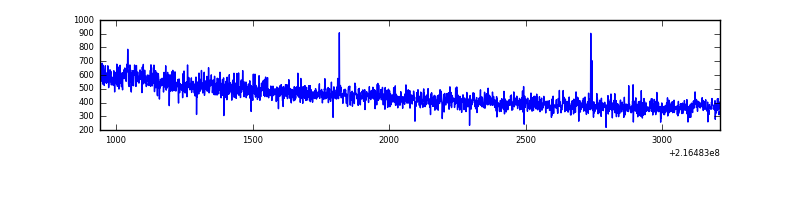 |
| D | 2271 | 2271 | 22 | 22 | 0.97% | 0.97% | 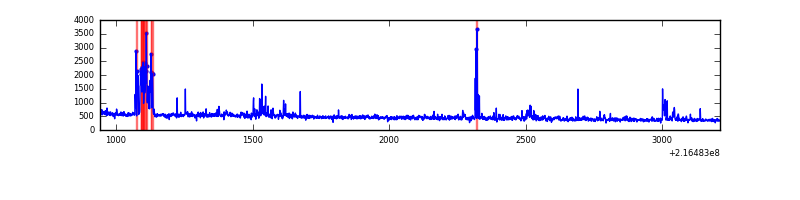 |
Top three noisy pixels from each quadrant. If the there are fewer than three noisy pixels in the level2.evt file, extra rows are filled as -1
| Pixel properties | Quadrant properties | ||||||
|---|---|---|---|---|---|---|---|
| Quadrant | DetID | PixID | Counts | Sigma | Mean | Median | Sigma |
| A | 8 | 15 | 139519 | 2395.19 | 274 | 270 | 58.1 |
| A | 0 | 226 | 2692 | 41.66 | 274 | 270 | 58.1 |
| A | 12 | 194 | 2635 | 40.68 | 274 | 270 | 58.1 |
| B | 3 | 64 | 304827 | 5683.9 | 270 | 264 | 53.6 |
| B | 0 | 219 | 20669 | 380.81 | 270 | 264 | 53.6 |
| B | 4 | 81 | 14104 | 258.29 | 270 | 264 | 53.6 |
| C | 9 | 54 | 4172 | 63.87 | 256 | 257 | 61.3 |
| C | 13 | 61 | 2073 | 29.62 | 256 | 257 | 61.3 |
| C | 9 | 16 | 1425 | 19.05 | 256 | 257 | 61.3 |
| D | 2 | 206 | 74136 | 1130.14 | 258 | 250 | 65.4 |
| D | 12 | 221 | 44772 | 681.0 | 258 | 250 | 65.4 |
| D | 2 | 14 | 16606 | 250.18 | 258 | 250 | 65.4 |
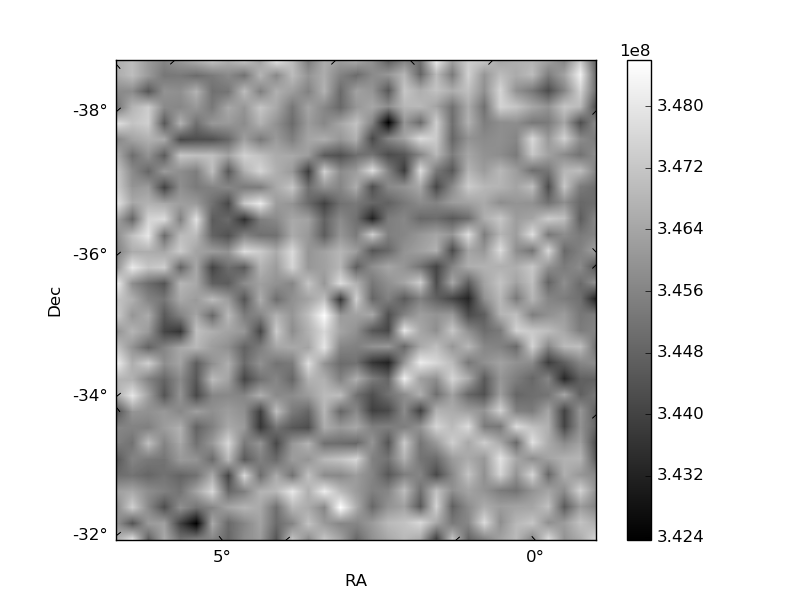
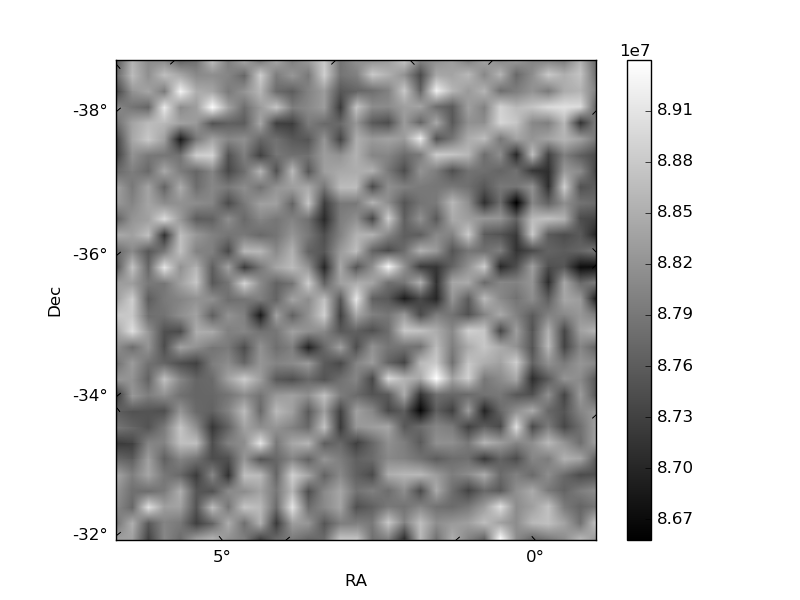
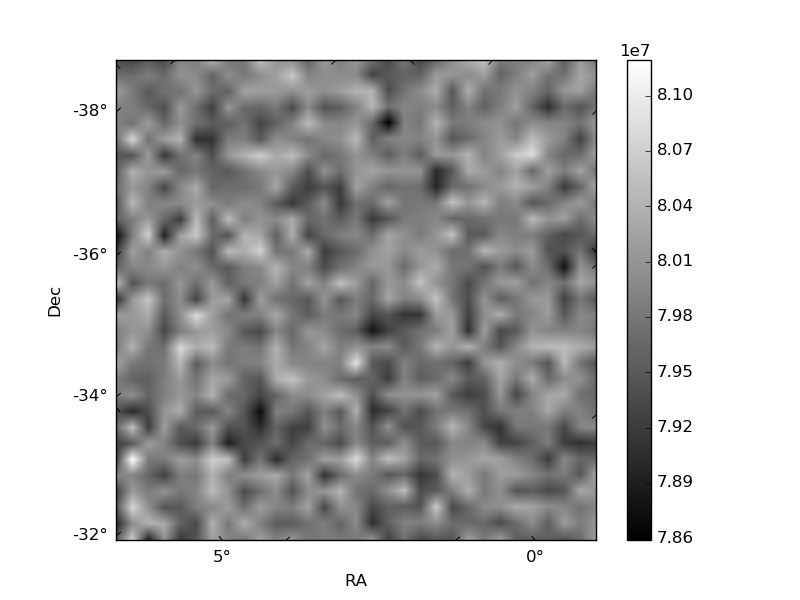
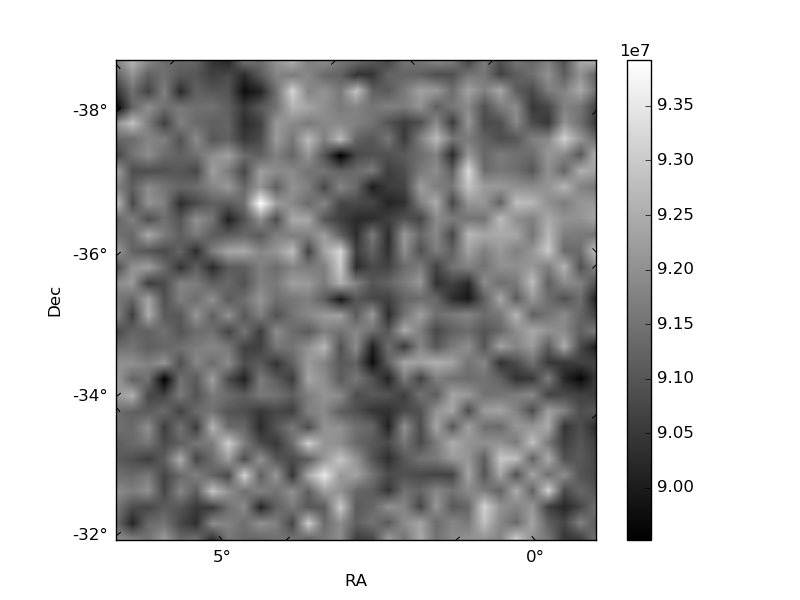
Histogram calculated using DETX and DETY for each event in the final _common_clean file
| Quadrant A | 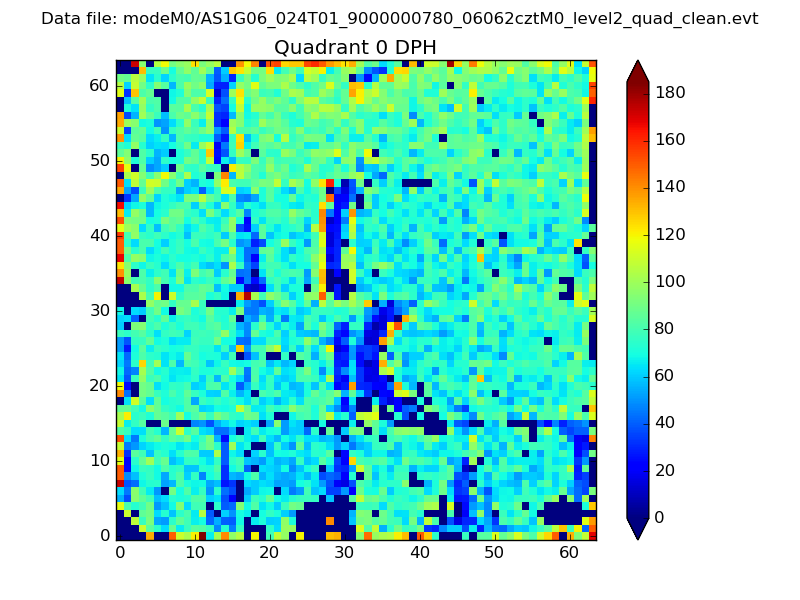 |
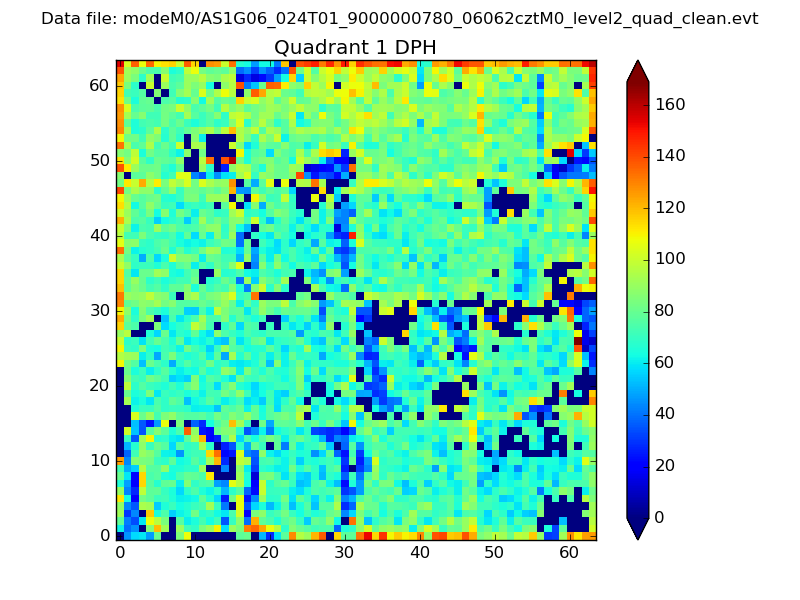 |
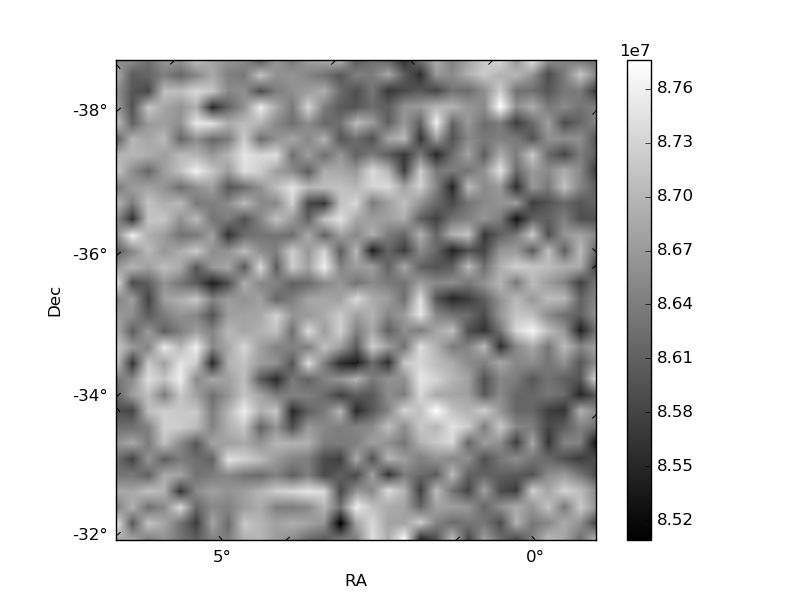
Quadrant B |
|---|---|---|---|
| Quadrant D | 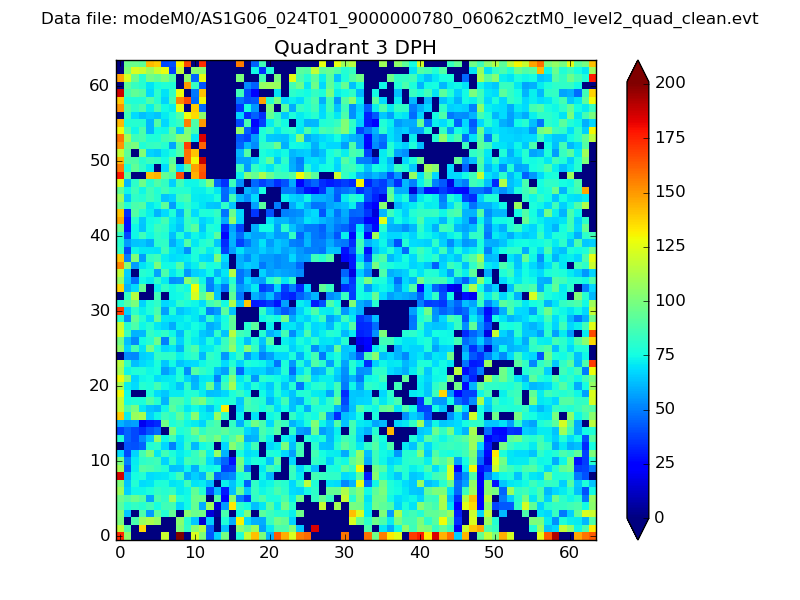 |
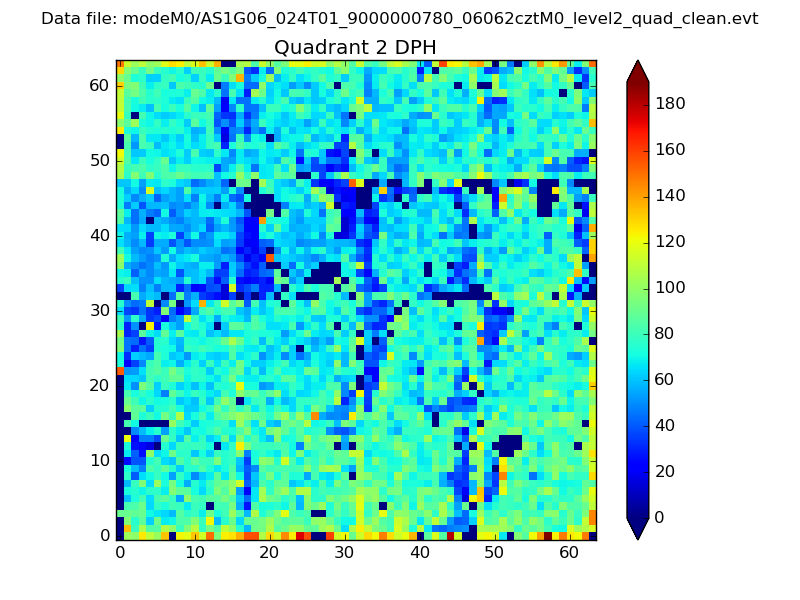 |
Quadrant C |
| Plot type | Count rate plots | Images |
|---|---|---|
| Comparison with Poisson distribution Blue bars denote a histogram of data divided into 1 sec bins. Red curve is a Poisson curve with rate = median count rate of data. |
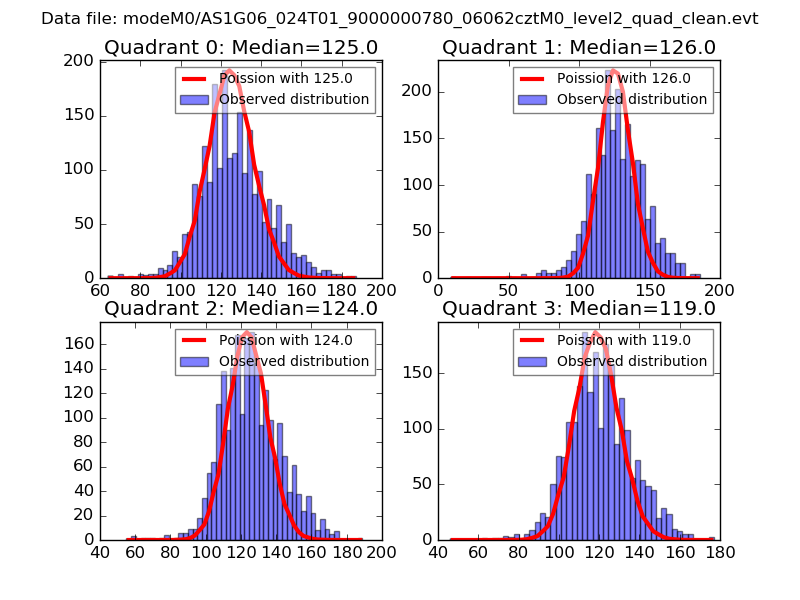 |
 |
| Quadrant-wise count rates Data is divided into 100 sec bins |
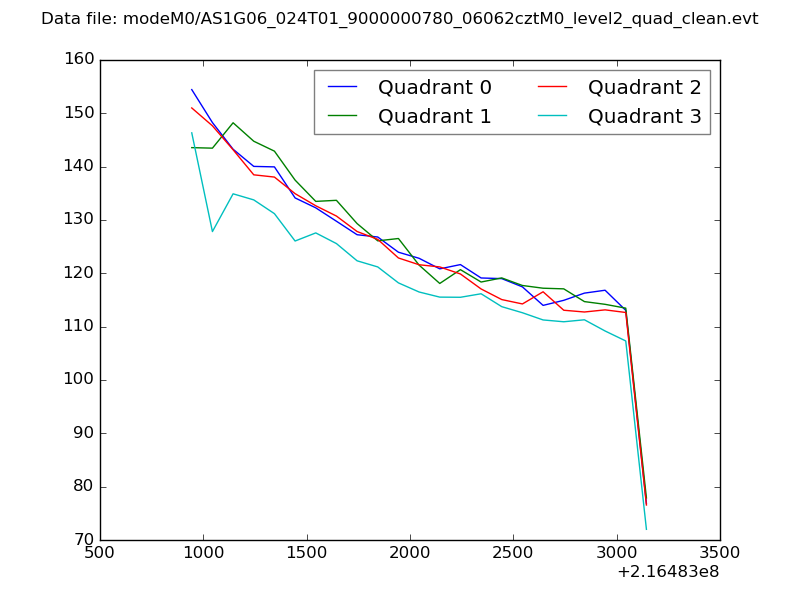 |
|
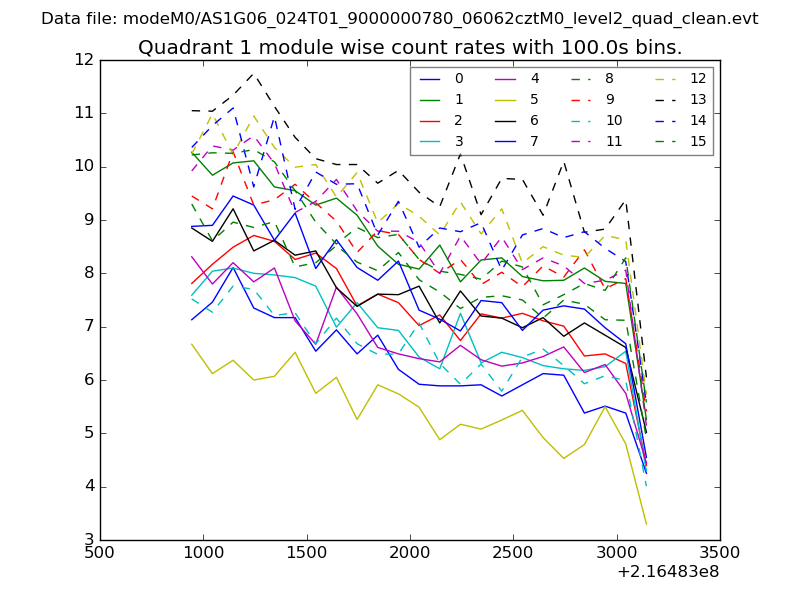
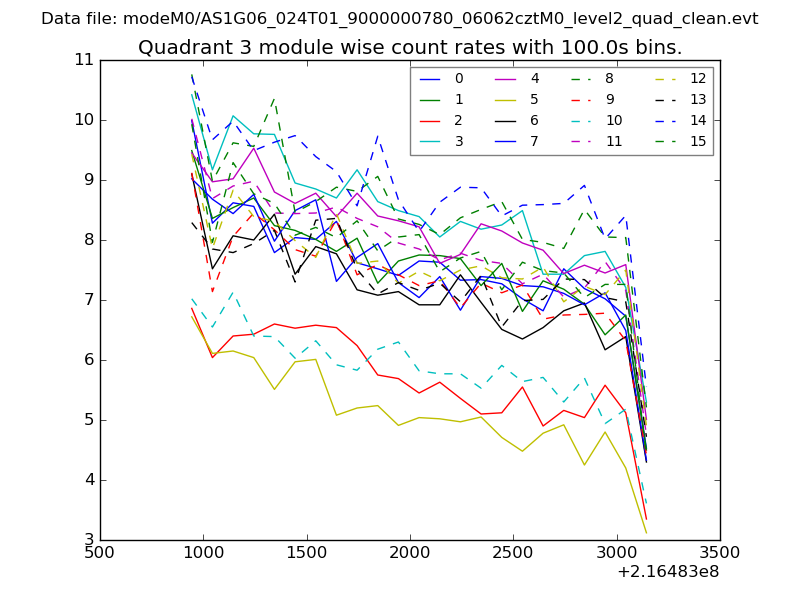
| Module-wise count rates for Quadrant A Data is divided into 100 sec bins |
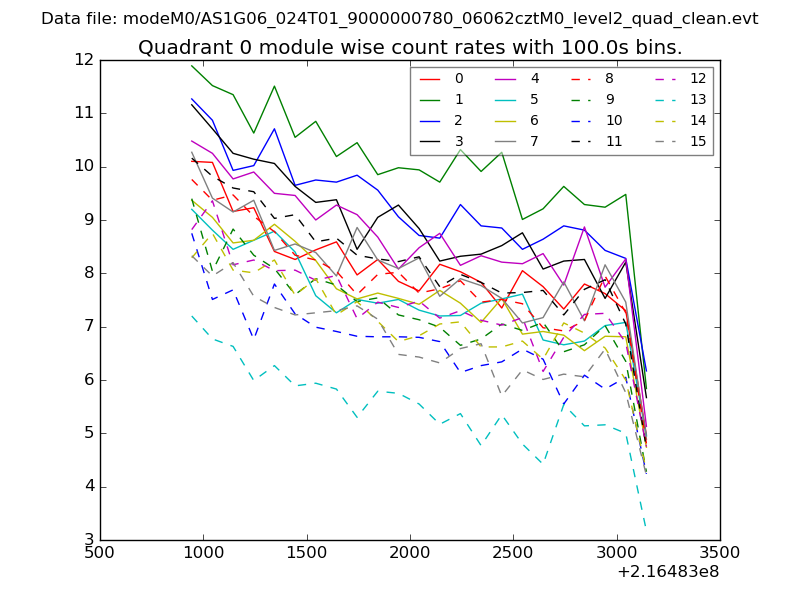 |
 |
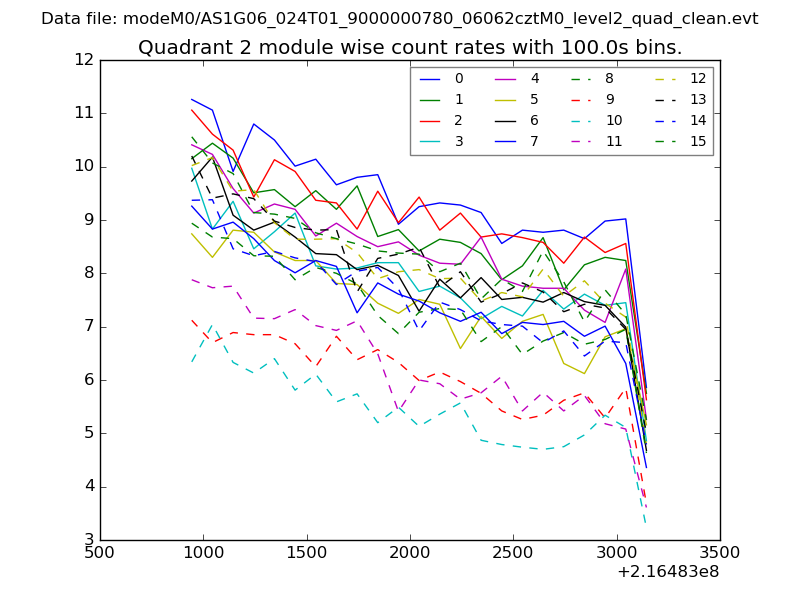
| Module-wise count rates for Quadrant B Data is divided into 100 sec bins |
 |
 |
| Module-wise count rates for Quadrant C Data is divided into 100 sec bins |
 |
 |
| Module-wise count rates for Quadrant D Data is divided into 100 sec bins |
 |
 |
| Parameter | Plot |
|---|---|
| CZT HV Monitor | 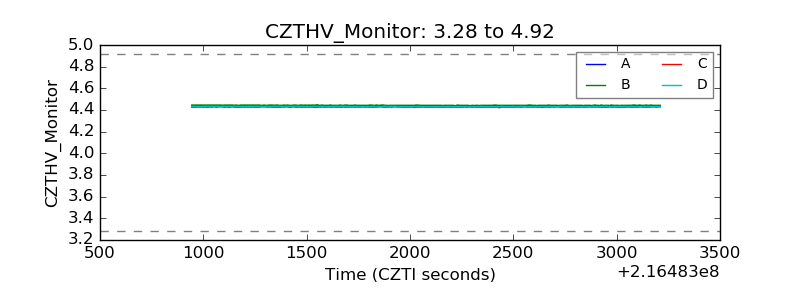 |
| D_VDD | 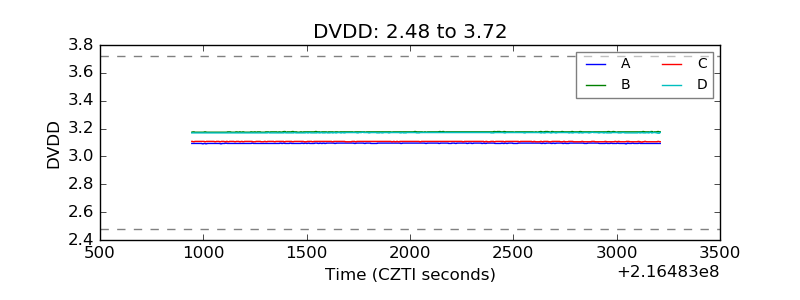 |
| Temperature 1 | 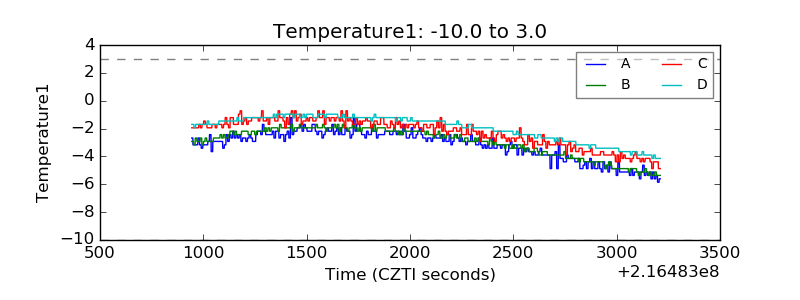 |
| Veto HV Monitor | 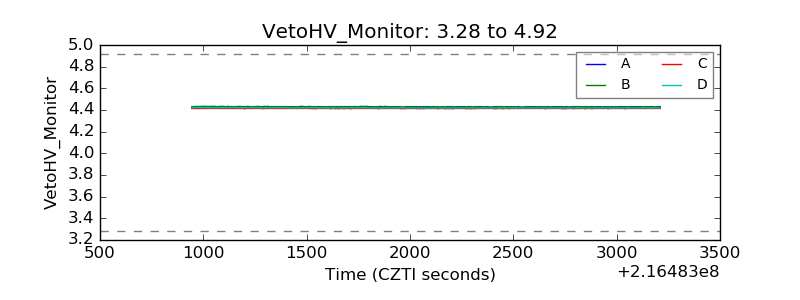 |
| Veto LLD | 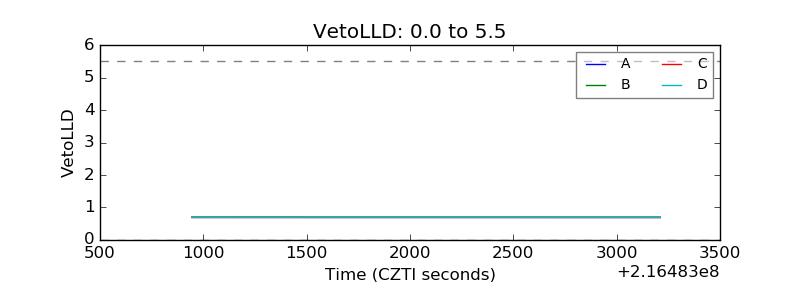 |
| Alpha Counter | 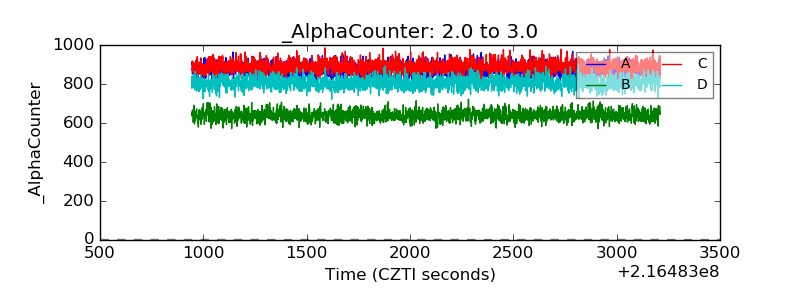 |
| _CPM_Rate | 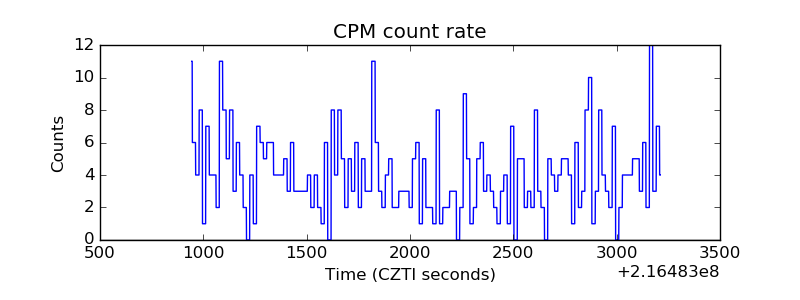 |
| CZT Counter | 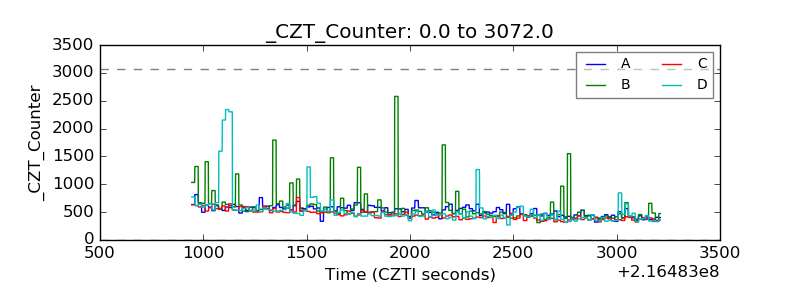 |
| +2.5 Volts monitor |  |
| +5 Volts monitor | 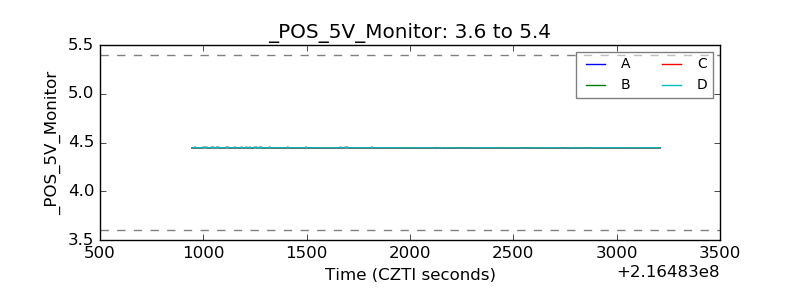 |
| _ROLL_ROT | 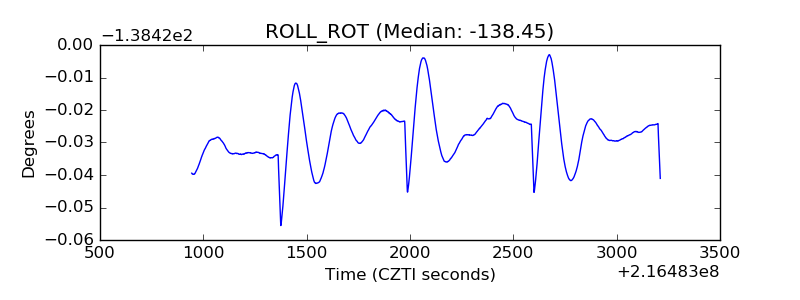 |
| _Roll_DEC | 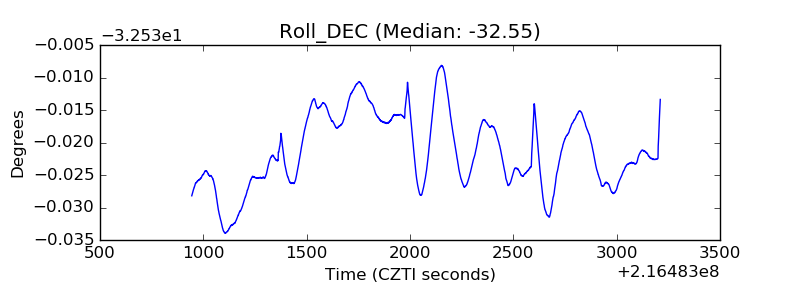 |
| _Roll_RA | 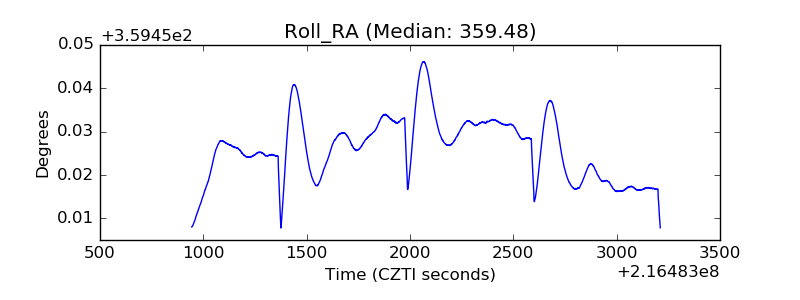 |
| Veto Counter | 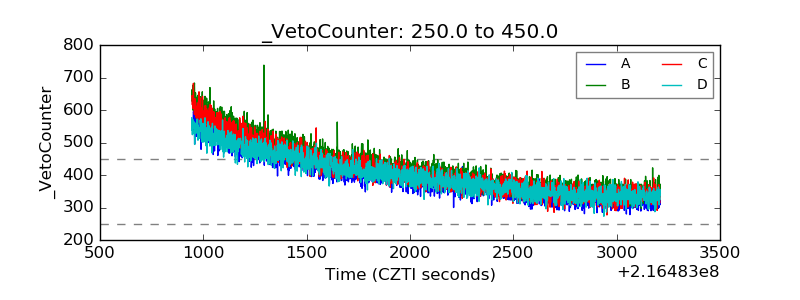 |