| Param | Original file | Final file |
|---|---|---|
| Filename | modeM0/AS1G06_130T01_9000000782cztM0_level2.fits | modeM0/AS1G06_130T01_9000000782cztM0_level2_quad_clean.evt |
| Size (bytes) | 414,077,760 | 575,262,720 |
| Size | 394.9 MB | 548.6 MB |
| Events in quadrant A | 2,470,730 | 3,729,470 |
| Events in quadrant B | 2,386,764 | 3,732,462 |
| Events in quadrant C | 2,433,894 | 3,543,690 |
| Events in quadrant D | 2,089,226 | 3,259,843 |
| Mode SS | |||
|---|---|---|---|
| Quadrant | BADHDUFLAG | Total packets | Discarded packets |
| A | 0 | 940 | 0 |
| B | 0 | 940 | 0 |
| C | 0 | 940 | 0 |
| D | 0 | 940 | 0 |
| Mode M9 | |||
|---|---|---|---|
| Quadrant | BADHDUFLAG | Total packets | Discarded packets |
| A | 0 | 71 | 0 |
| B | 0 | 71 | 0 |
| C | 0 | 71 | 0 |
| D | 0 | 71 | 0 |
| Mode M0 | |||
|---|---|---|---|
| Quadrant | BADHDUFLAG | Total packets | Discarded packets |
| A | 0 | 97505 | 0 |
| B | 0 | 107961 | 0 |
| C | 0 | 99480 | 0 |
| D | 0 | 108084 | 0 |
| Quadrant | Total seconds | Saturated seconds | Saturation percentage |
|---|---|---|---|
| A | 46014 | 574 | 1.247446% |
| B | 46012 | 1410 | 3.064418% |
| C | 46013 | 1009 | 2.192859% |
| D | 46013 | 1065 | 2.314563% |
Noise dominated data is calculated using 1-second bins in cleaned event files. If a bin has >2000 counts, and if more than 50% of those come from <1% of pixels, then it is considered to be noise-dominated and hence unusable.
| Quadrant | # 1 sec bins | Bins with >0 counts | Bins with >2000 counts | High rate bins dominated by noise | Noise dominated (total time) | Noise dominated (detector-on time) | Marked lightcurve |
|---|---|---|---|---|---|---|---|
| A | 53049 | 46012 | 0 | 0 | 0.00% | 0.00% | 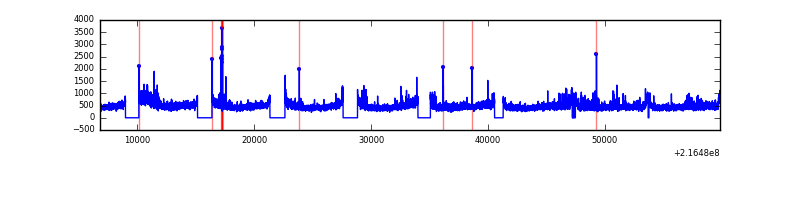 |
| B | 53048 | 46003 | 0 | 0 | 0.00% | 0.00% | 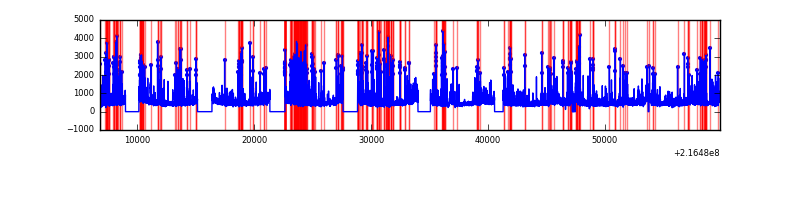 |
| C | 53049 | 46010 | 0 | 0 | 0.00% | 0.00% | 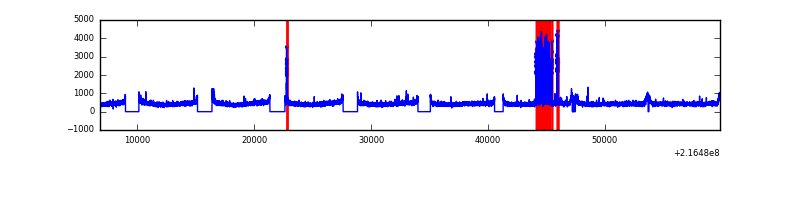 |
| D | 53049 | 46010 | 0 | 0 | 0.00% | 0.00% | 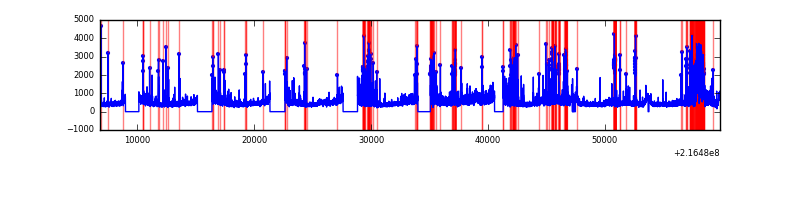 |
Top three noisy pixels from each quadrant. If the there are fewer than three noisy pixels in the level2.evt file, extra rows are filled as -1
| Pixel properties | Quadrant properties | ||||||
|---|---|---|---|---|---|---|---|
| Quadrant | DetID | PixID | Counts | Sigma | Mean | Median | Sigma |
| A | 0 | 29 | 2386 | 10.73 | 643 | 602 | 166.3 |
| A | 7 | 110 | 2071 | 8.83 | 643 | 602 | 166.3 |
| A | 0 | 30 | 1834 | 7.41 | 643 | 602 | 166.3 |
| B | 2 | 9 | 2062 | 11.67 | 630 | 600 | 125.3 |
| B | 12 | 226 | 1679 | 8.61 | 630 | 600 | 125.3 |
| B | 14 | 254 | 1644 | 8.33 | 630 | 600 | 125.3 |
| C | 1 | 80 | 1801 | 7.04 | 642 | 594 | 171.5 |
| C | 1 | 81 | 1775 | 6.89 | 642 | 594 | 171.5 |
| C | 1 | 65 | 1709 | 6.5 | 642 | 594 | 171.5 |
| D | 3 | 14 | 1647 | 6.98 | 595 | 542 | 158.4 |
| D | 11 | 82 | 1593 | 6.64 | 595 | 542 | 158.4 |
| D | 7 | 5 | 1552 | 6.38 | 595 | 542 | 158.4 |
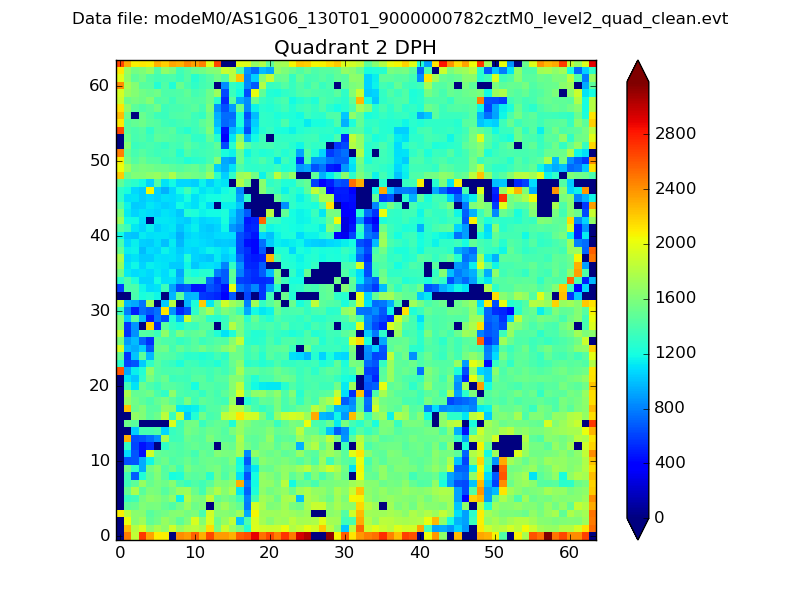
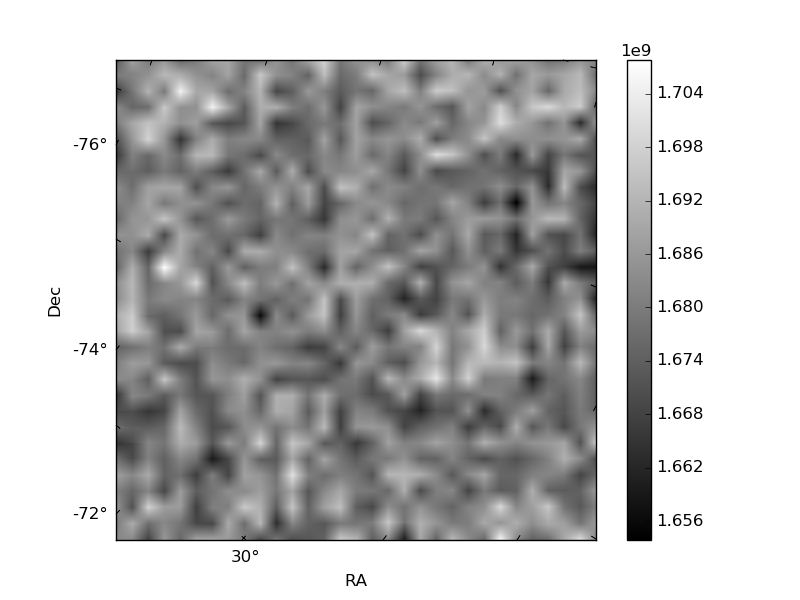
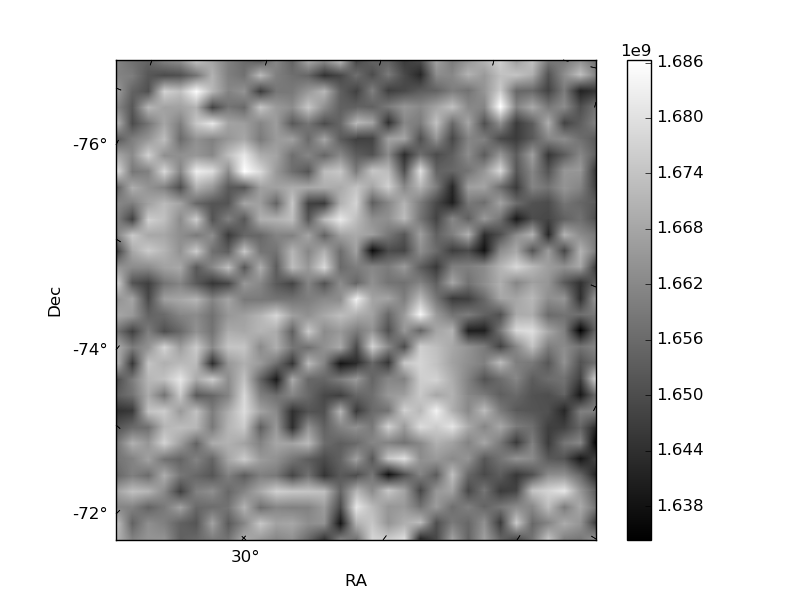
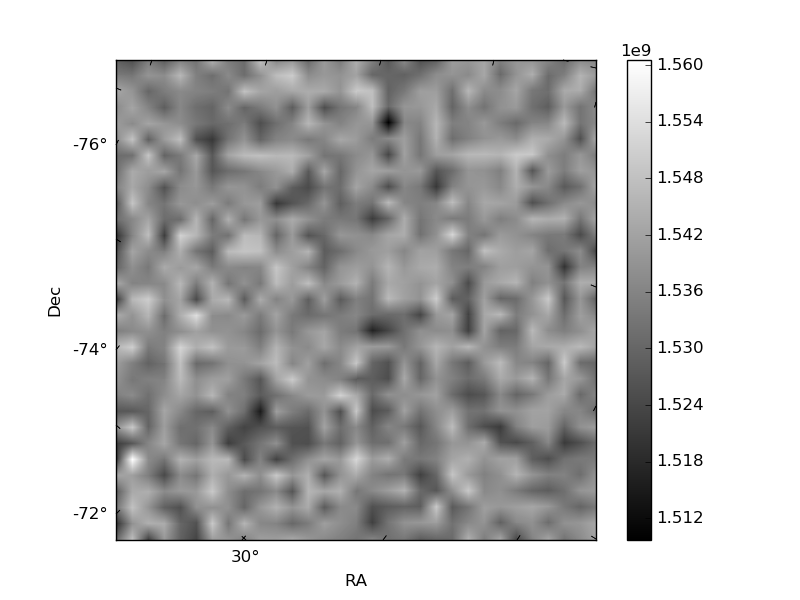
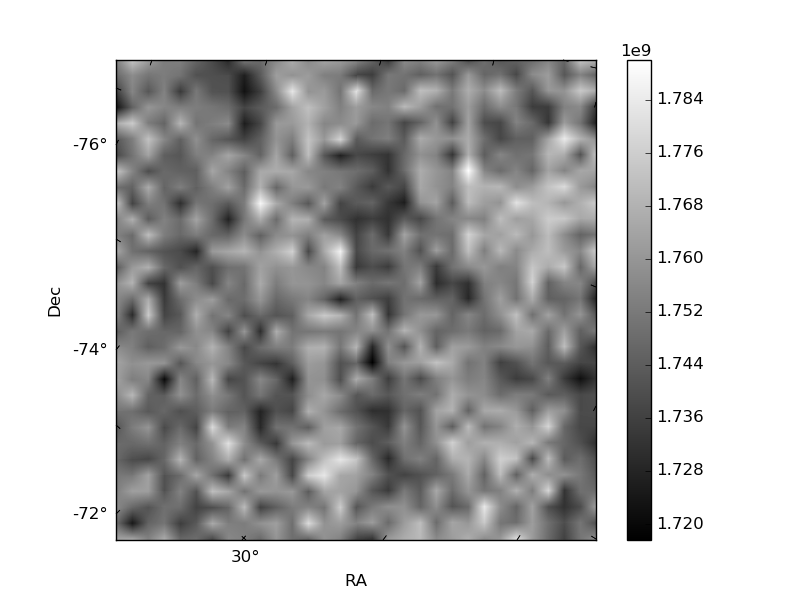
Histogram calculated using DETX and DETY for each event in the final _common_clean file
| Quadrant A | 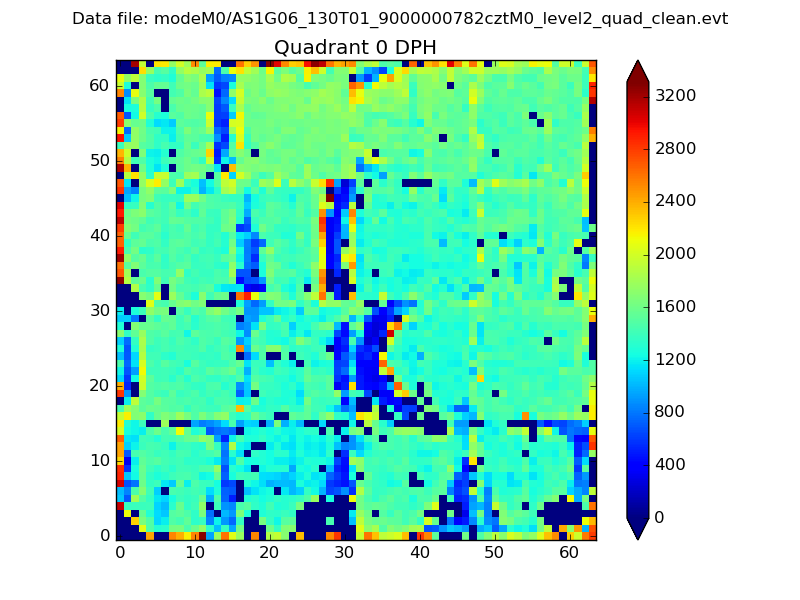 |
 |
Quadrant B |
|---|---|---|---|
| Quadrant D | 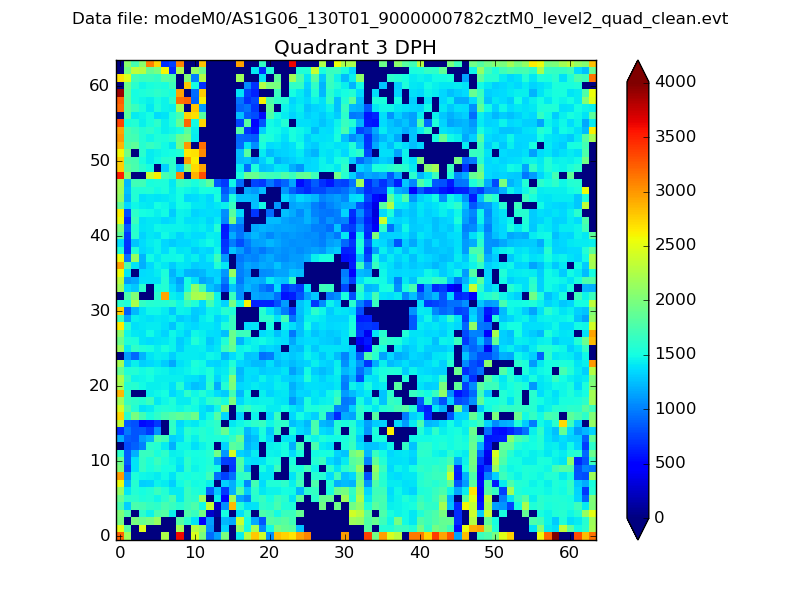 |
 |
Quadrant C |
| Plot type | Count rate plots | Images |
|---|---|---|
| Comparison with Poisson distribution Blue bars denote a histogram of data divided into 1 sec bins. Red curve is a Poisson curve with rate = median count rate of data. |
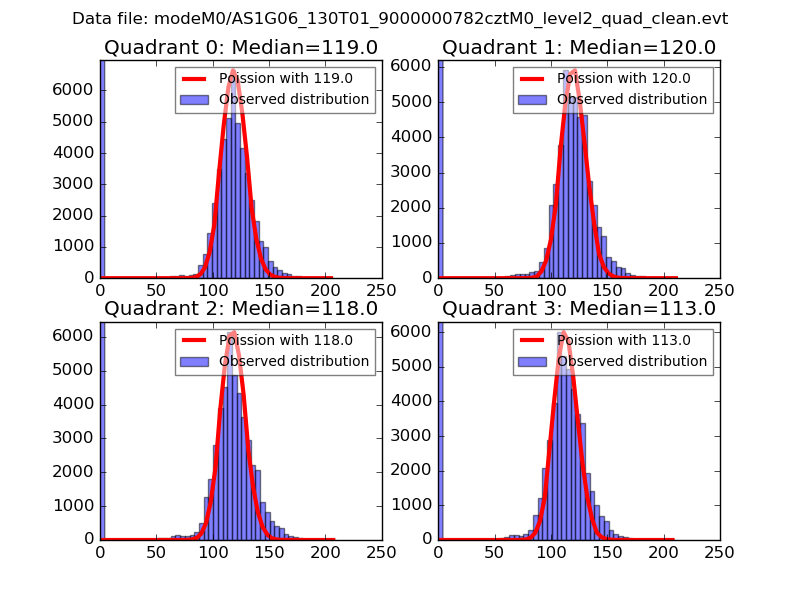 |
 |
| Quadrant-wise count rates Data is divided into 100 sec bins |
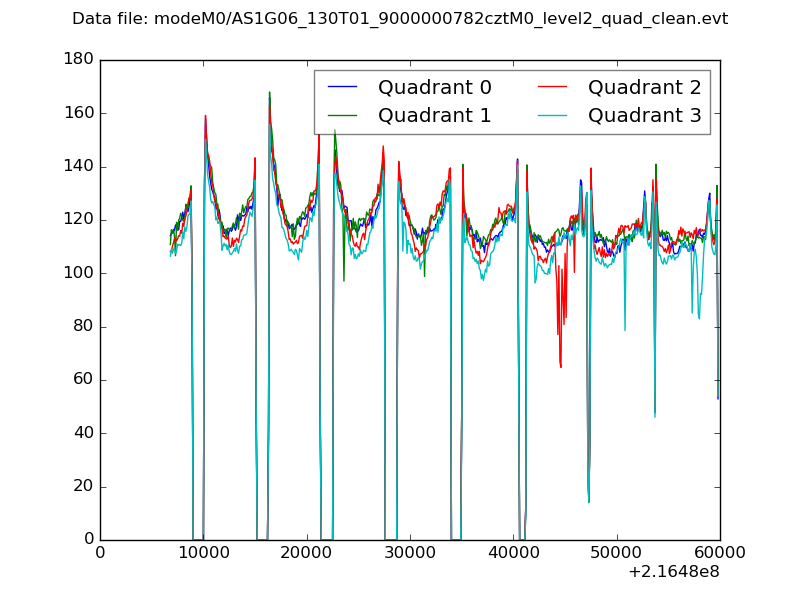 |
|
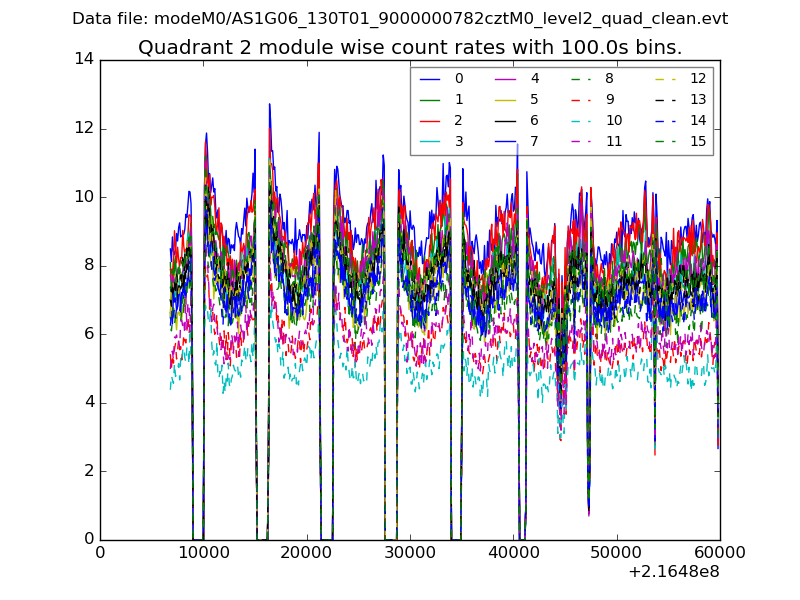
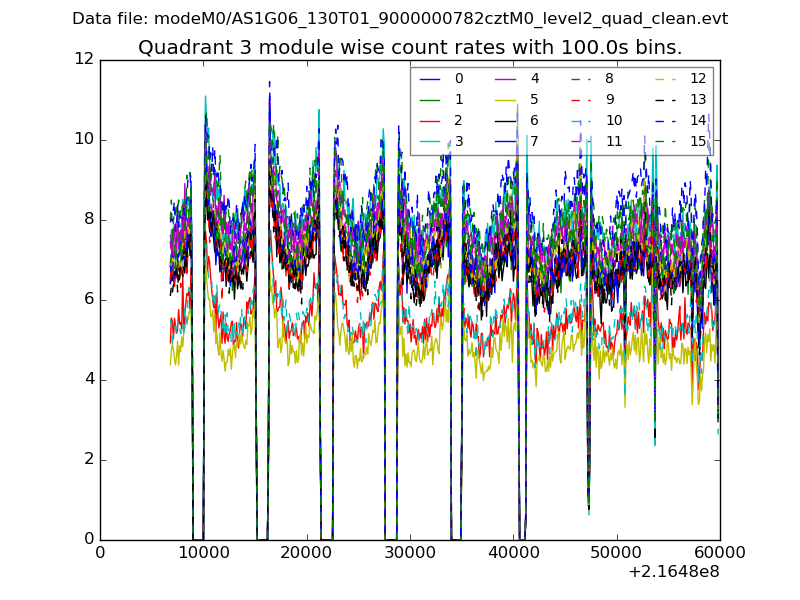
| Module-wise count rates for Quadrant A Data is divided into 100 sec bins |
 |
 |
| Module-wise count rates for Quadrant B Data is divided into 100 sec bins |
 |
 |
| Module-wise count rates for Quadrant C Data is divided into 100 sec bins |
 |
 |
| Module-wise count rates for Quadrant D Data is divided into 100 sec bins |
 |
 |
| Parameter | Plot |
|---|---|
| CZT HV Monitor |  |
| D_VDD | 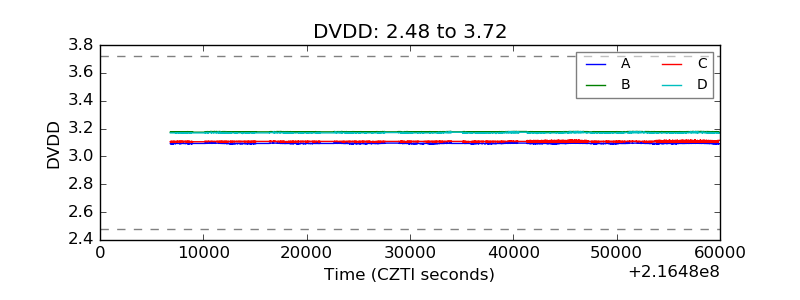 |
| Temperature 1 | 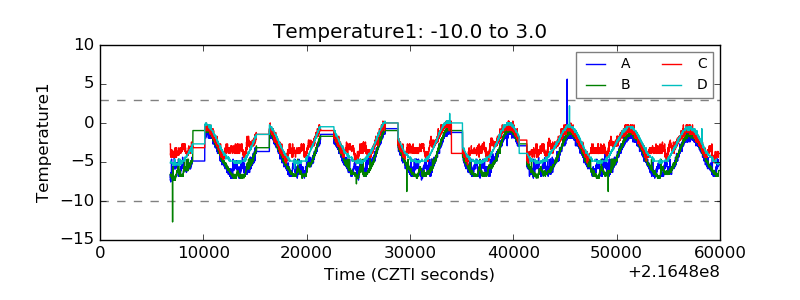 |
| Veto HV Monitor |  |
| Veto LLD | 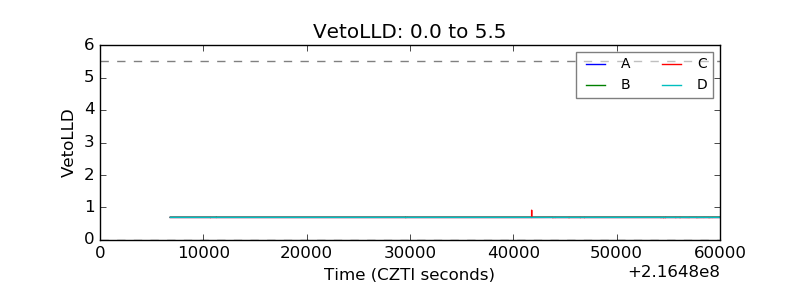 |
| Alpha Counter | 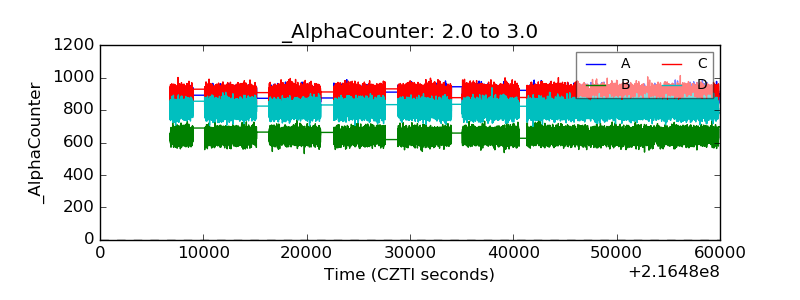 |
| _CPM_Rate |  |
| CZT Counter | 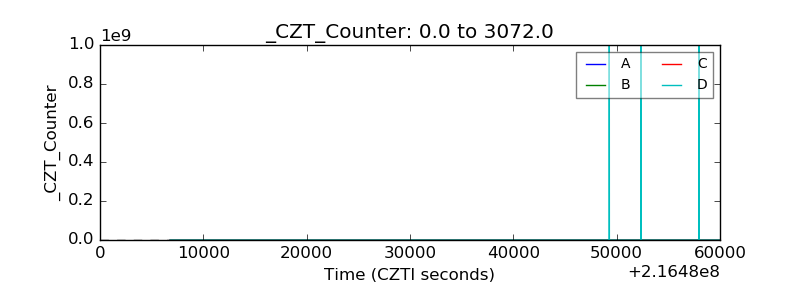 |
| +2.5 Volts monitor |  |
| +5 Volts monitor |  |
| _ROLL_ROT |  |
| _Roll_DEC | 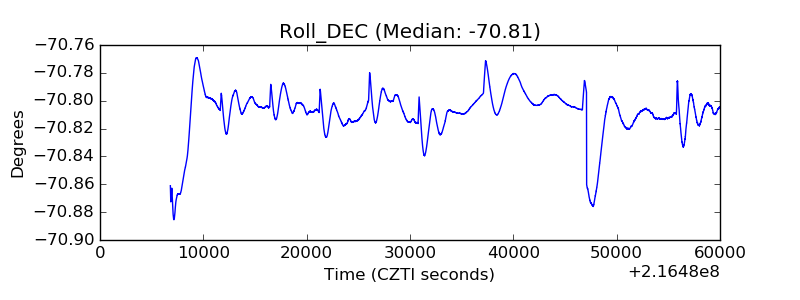 |
| _Roll_RA | 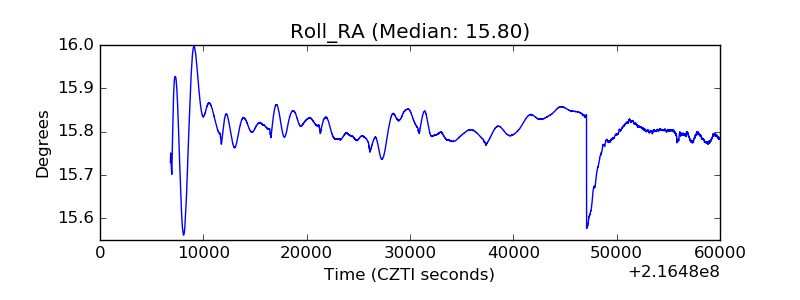 |
| Veto Counter | 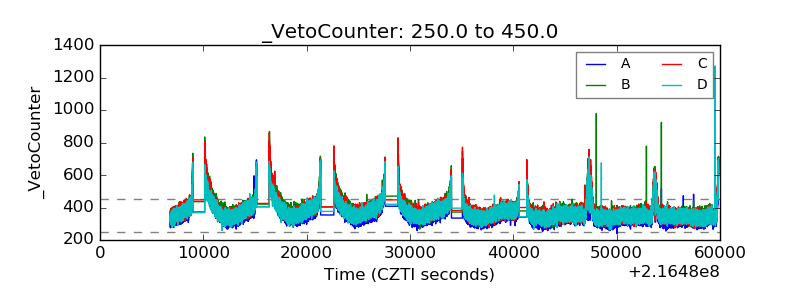 |