| Param | Original file | Final file |
|---|---|---|
| Filename | modeM0/AS1G06_130T01_9000000782_06062cztM0_level2.evt | modeM0/AS1G06_130T01_9000000782_06062cztM0_level2_quad_clean.evt |
| Size (bytes) | 272,450,880 | 69,883,200 |
| Size | 259.8 MB | 66.6 MB |
| Events in quadrant A | 2,149,397 | 468,681 |
| Events in quadrant B | 2,353,269 | 472,463 |
| Events in quadrant C | 1,699,230 | 466,317 |
| Events in quadrant D | 1,797,074 | 447,744 |
| Mode SS | |||
|---|---|---|---|
| Quadrant | BADHDUFLAG | Total packets | Discarded packets |
| A | 0 | 74 | 0 |
| B | 0 | 74 | 0 |
| C | 0 | 74 | 0 |
| D | 0 | 74 | 0 |
| Mode M9 | |||
|---|---|---|---|
| Quadrant | BADHDUFLAG | Total packets | Discarded packets |
| A | 0 | 12 | 0 |
| B | 0 | 12 | 0 |
| C | 0 | 12 | 0 |
| D | 0 | 12 | 0 |
| Mode M0 | |||
|---|---|---|---|
| Quadrant | BADHDUFLAG | Total packets | Discarded packets |
| A | 0 | 8955 | 2 |
| B | 0 | 9492 | 1 |
| C | 0 | 7634 | 3 |
| D | 0 | 7945 | 1 |
| Quadrant | Total seconds | Saturated seconds | Saturation percentage |
|---|---|---|---|
| A | 3695 | 56 | 1.515562% |
| B | 3695 | 156 | 4.221922% |
| C | 3694 | 29 | 0.785057% |
| D | 3695 | 42 | 1.136671% |
Noise dominated data is calculated using 1-second bins in cleaned event files. If a bin has >2000 counts, and if more than 50% of those come from <1% of pixels, then it is considered to be noise-dominated and hence unusable.
| Quadrant | # 1 sec bins | Bins with >0 counts | Bins with >2000 counts | High rate bins dominated by noise | Noise dominated (total time) | Noise dominated (detector-on time) | Marked lightcurve |
|---|---|---|---|---|---|---|---|
| A | 4845 | 3695 | 1 | 1 | 0.02% | 0.03% | 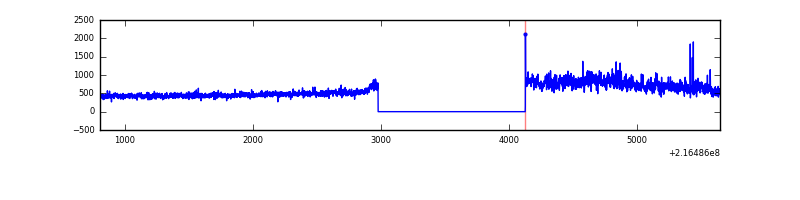 |
| B | 4845 | 3695 | 73 | 73 | 1.51% | 1.98% | 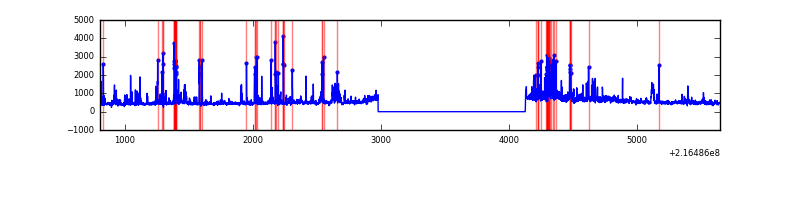 |
| C | 4845 | 3696 | 0 | 0 | 0.00% | 0.00% |  |
| D | 4845 | 3696 | 7 | 7 | 0.14% | 0.19% | 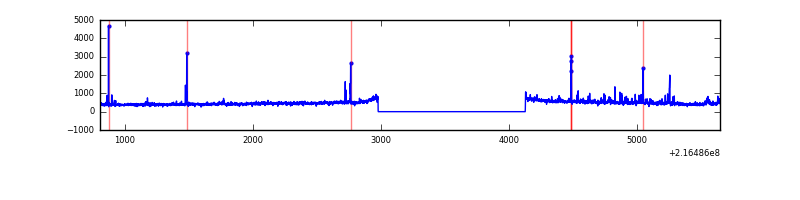 |
Top three noisy pixels from each quadrant. If the there are fewer than three noisy pixels in the level2.evt file, extra rows are filled as -1
| Pixel properties | Quadrant properties | ||||||
|---|---|---|---|---|---|---|---|
| Quadrant | DetID | PixID | Counts | Sigma | Mean | Median | Sigma |
| A | 8 | 15 | 438452 | 4757.15 | 443 | 434 | 92.1 |
| A | 12 | 194 | 4339 | 42.41 | 443 | 434 | 92.1 |
| A | 0 | 226 | 4293 | 41.91 | 443 | 434 | 92.1 |
| B | 3 | 64 | 481091 | 5599.68 | 446 | 436 | 85.8 |
| B | 0 | 214 | 74547 | 863.4 | 446 | 436 | 85.8 |
| B | 15 | 204 | 23478 | 268.44 | 446 | 436 | 85.8 |
| C | 1 | 16 | 13974 | 135.64 | 431 | 432 | 99.8 |
| C | 13 | 61 | 3507 | 30.8 | 431 | 432 | 99.8 |
| C | 8 | 222 | 1521 | 10.91 | 431 | 432 | 99.8 |
| D | 12 | 221 | 65208 | 607.16 | 431 | 416 | 106.7 |
| D | 2 | 206 | 22144 | 203.61 | 431 | 416 | 106.7 |
| D | 13 | 169 | 21776 | 200.16 | 431 | 416 | 106.7 |
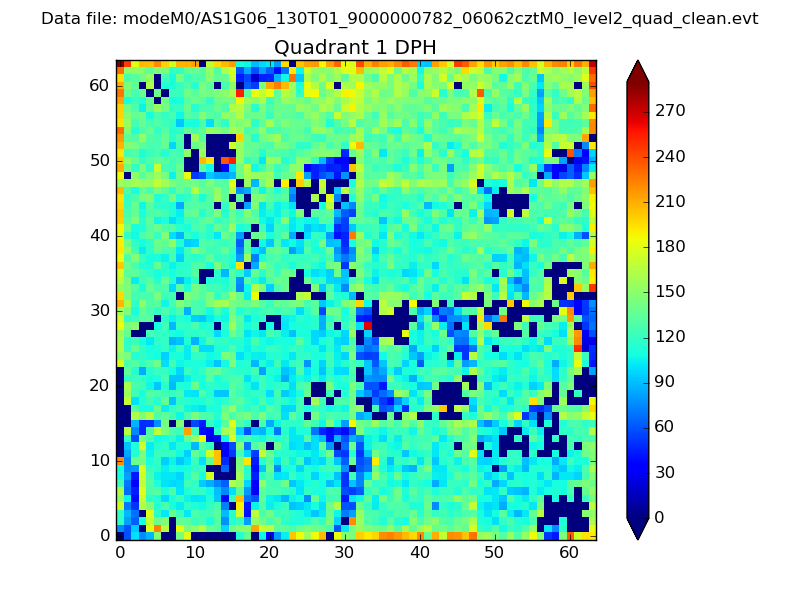
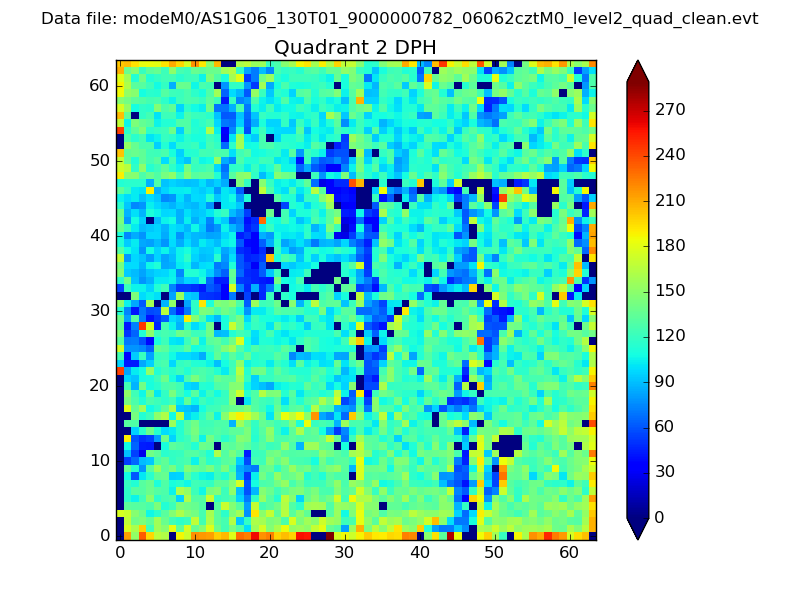
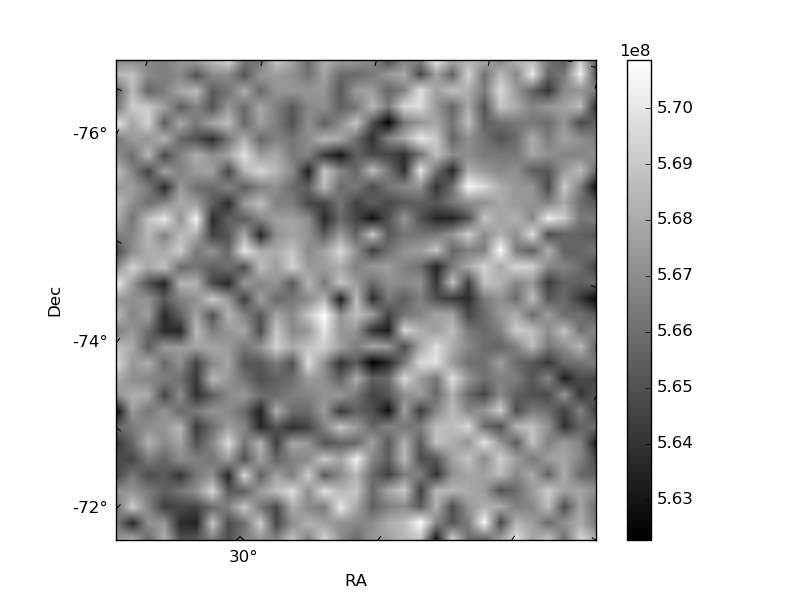
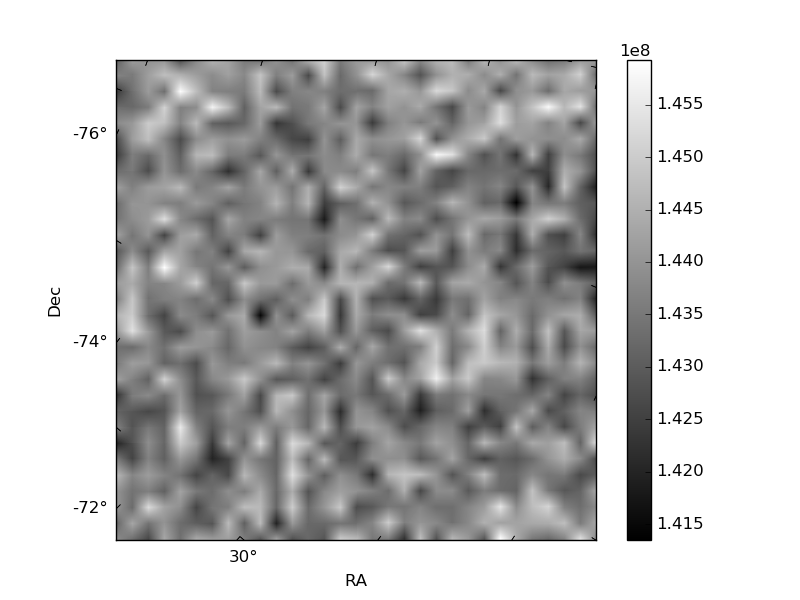
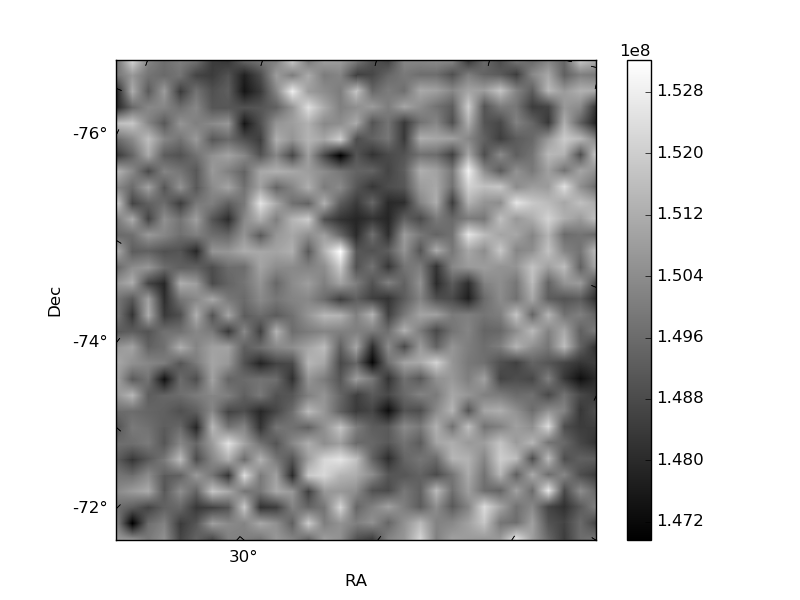
Histogram calculated using DETX and DETY for each event in the final _common_clean file
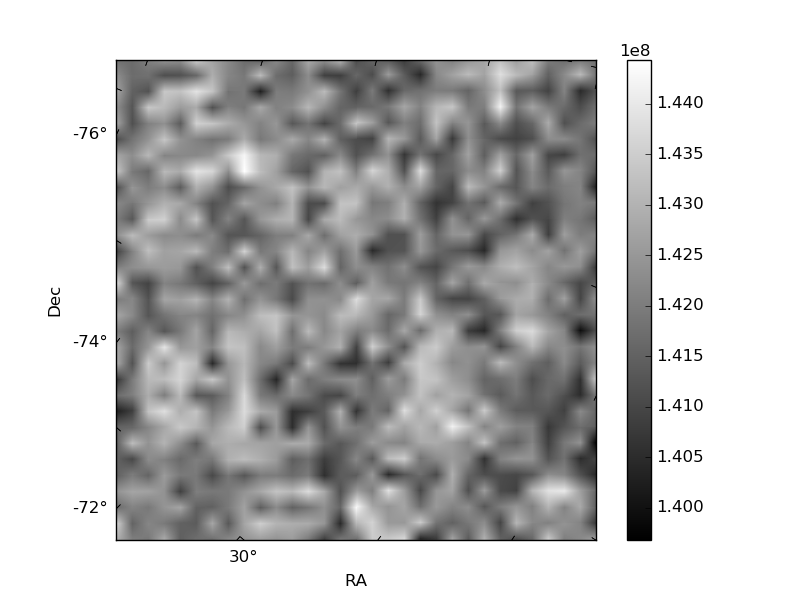
| Quadrant A | 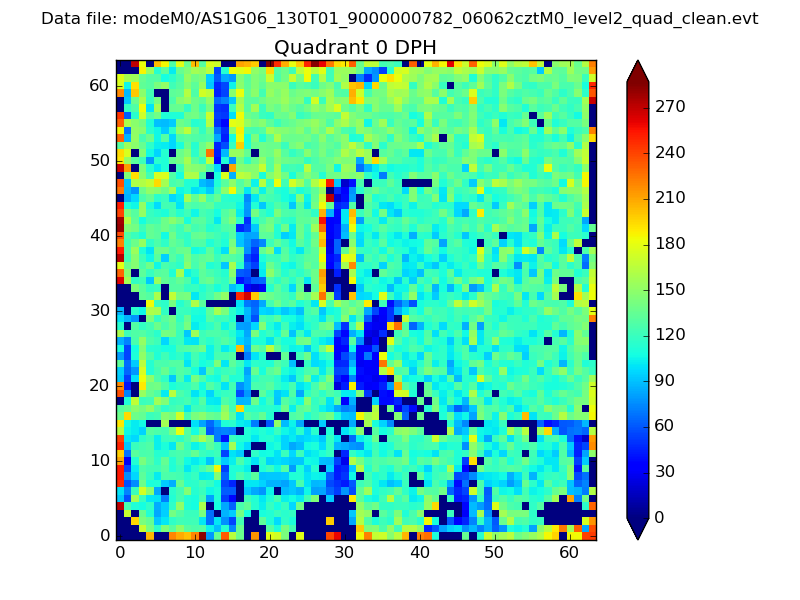 |
 |
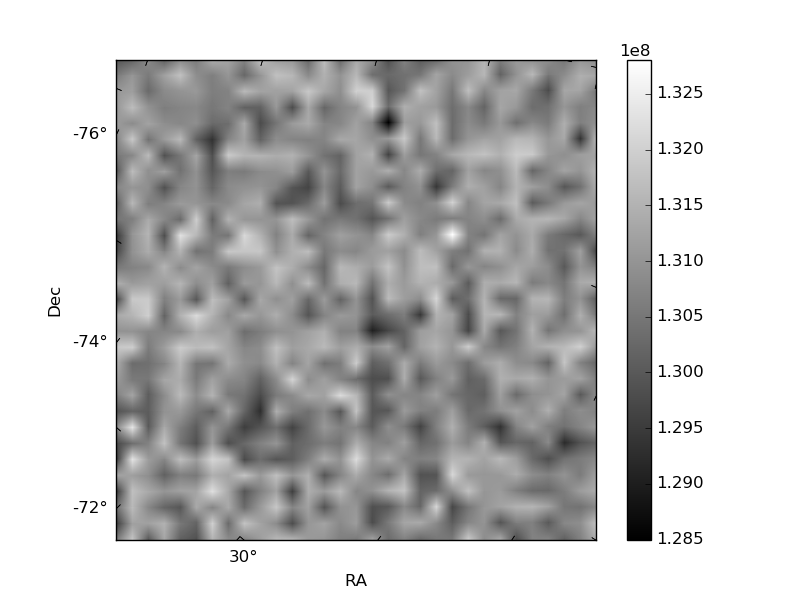
Quadrant B |
|---|---|---|---|
| Quadrant D | 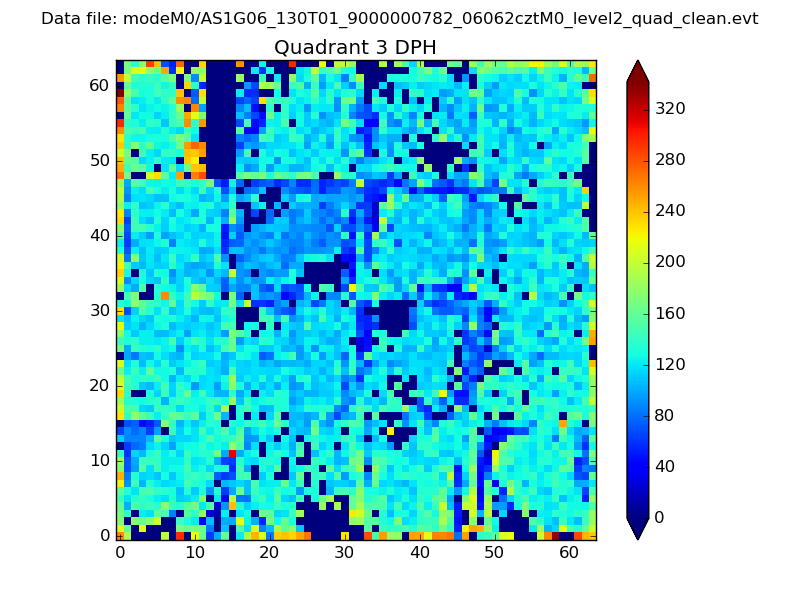 |
 |
Quadrant C |
| Plot type | Count rate plots | Images |
|---|---|---|
| Comparison with Poisson distribution Blue bars denote a histogram of data divided into 1 sec bins. Red curve is a Poisson curve with rate = median count rate of data. |
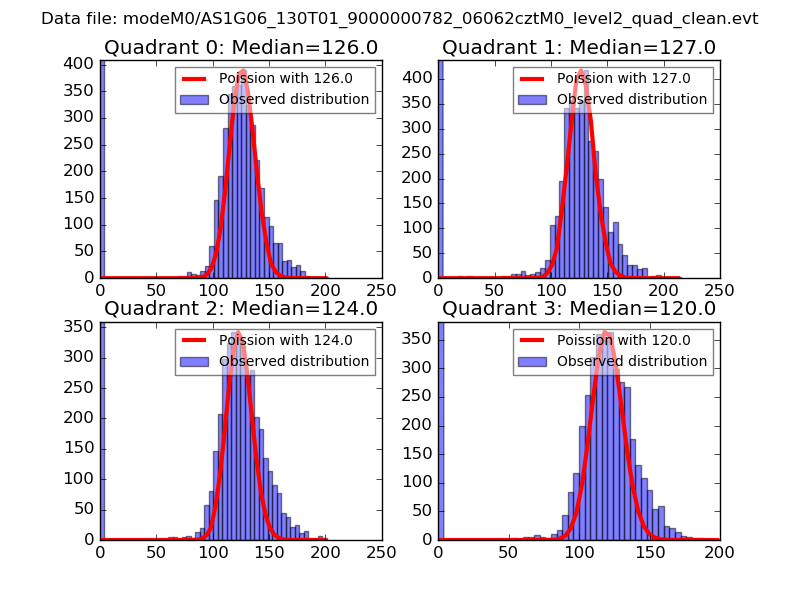 |
 |
| Quadrant-wise count rates Data is divided into 100 sec bins |
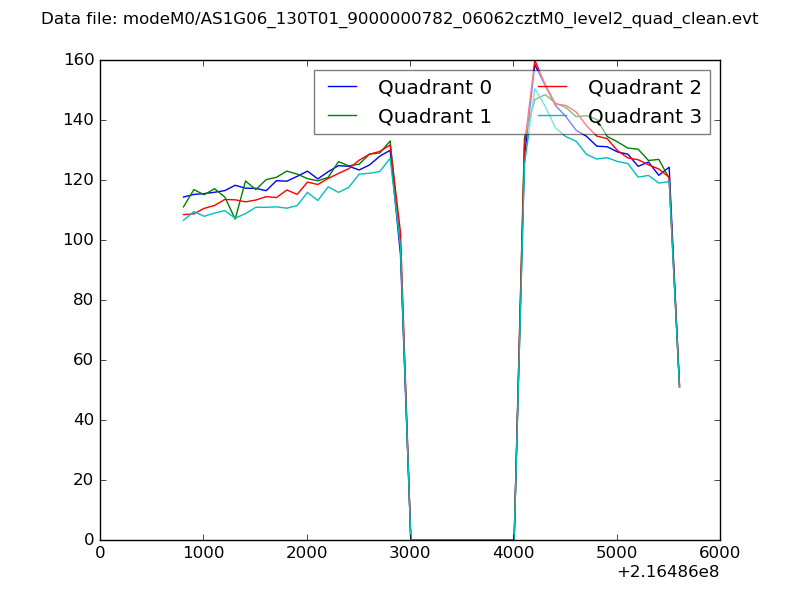 |
|
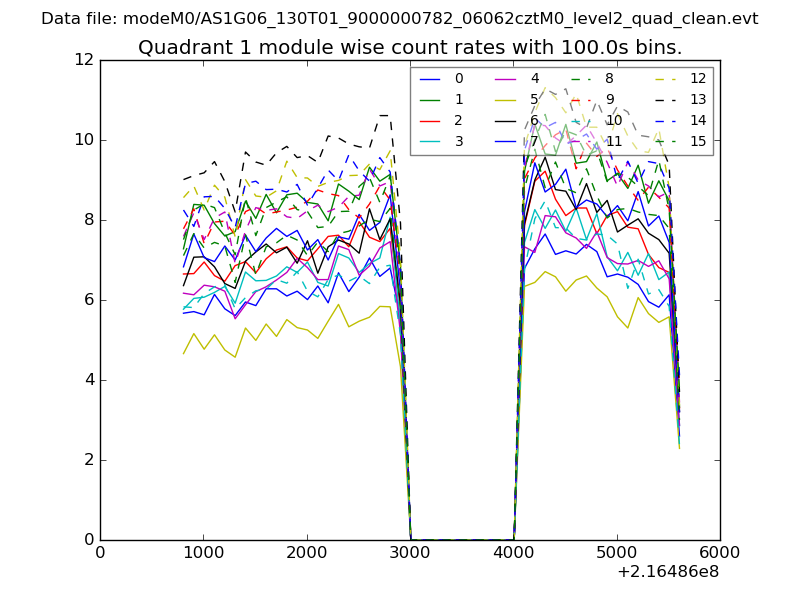
| Module-wise count rates for Quadrant A Data is divided into 100 sec bins |
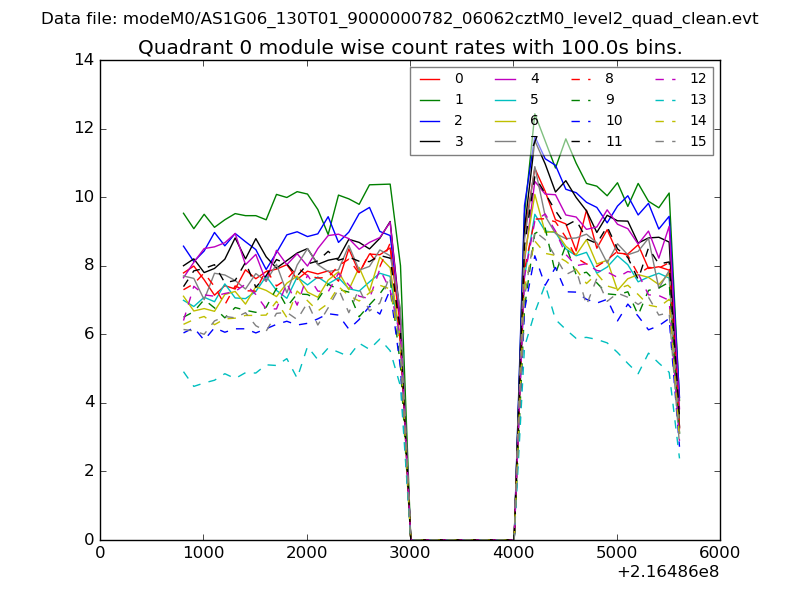 |
 |
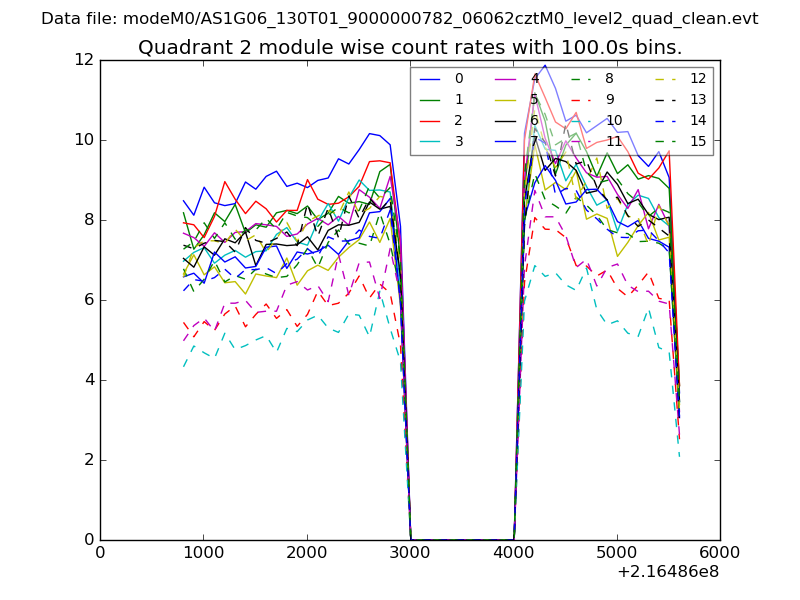
| Module-wise count rates for Quadrant B Data is divided into 100 sec bins |
 |
 |
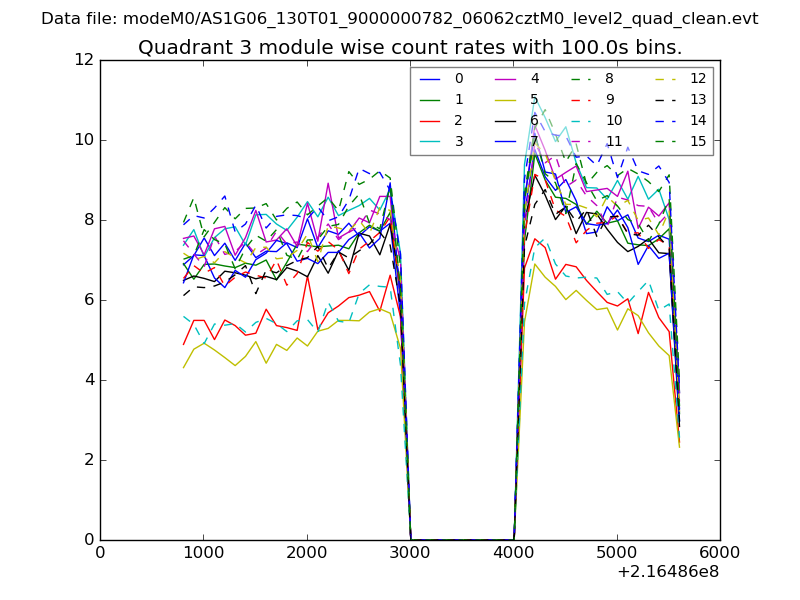
| Module-wise count rates for Quadrant C Data is divided into 100 sec bins |
 |
 |
| Module-wise count rates for Quadrant D Data is divided into 100 sec bins |
 |
 |
| Parameter | Plot |
|---|---|
| CZT HV Monitor | 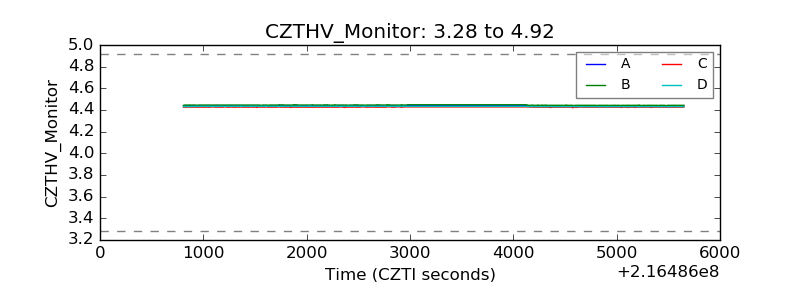 |
| D_VDD | 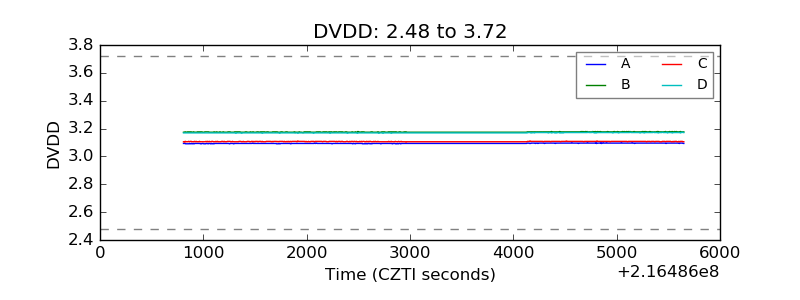 |
| Temperature 1 | 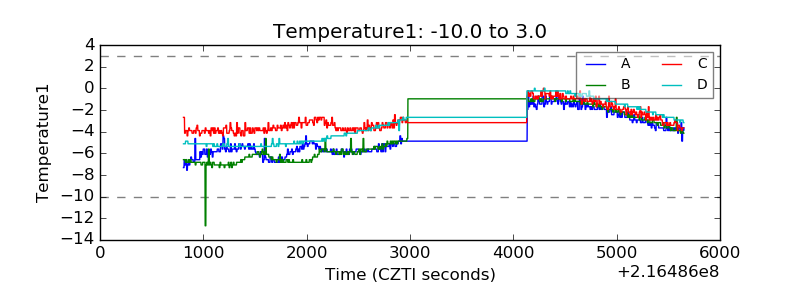 |
| Veto HV Monitor | 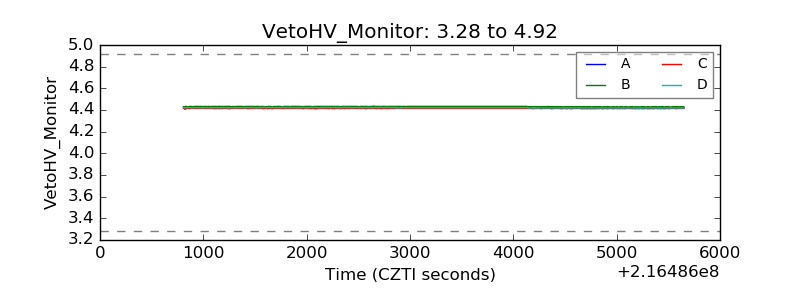 |
| Veto LLD | 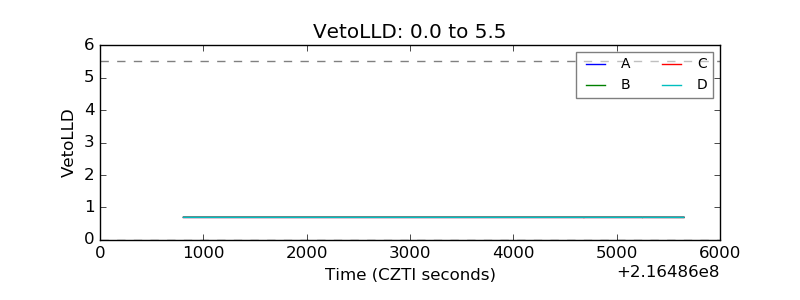 |
| Alpha Counter | 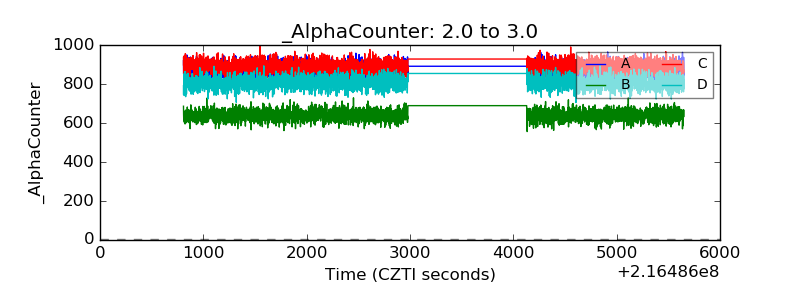 |
| _CPM_Rate | 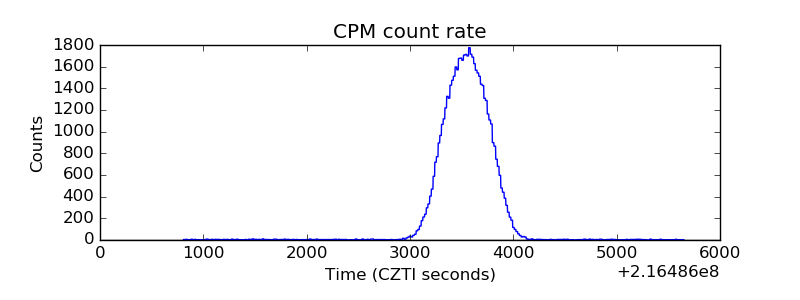 |
| CZT Counter | 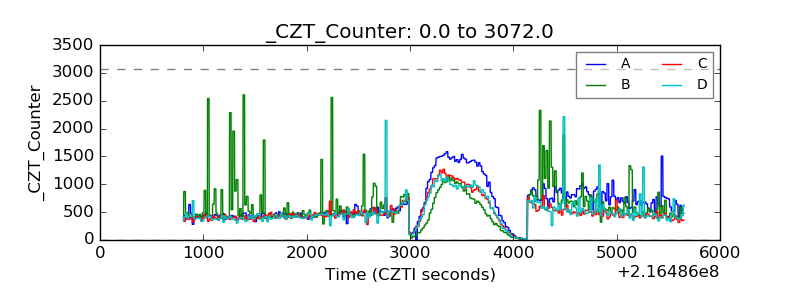 |
| +2.5 Volts monitor |  |
| +5 Volts monitor |  |
| _ROLL_ROT | 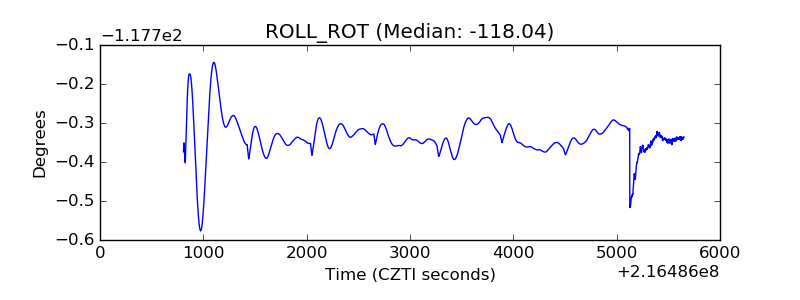 |
| _Roll_DEC | 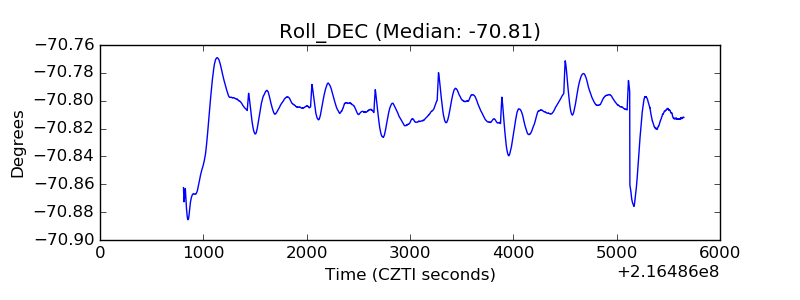 |
| _Roll_RA | 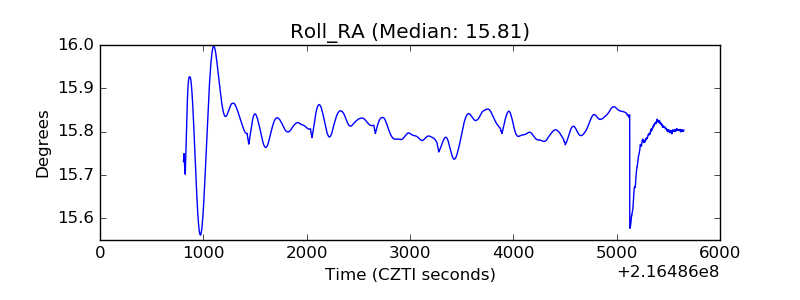 |
| Veto Counter | 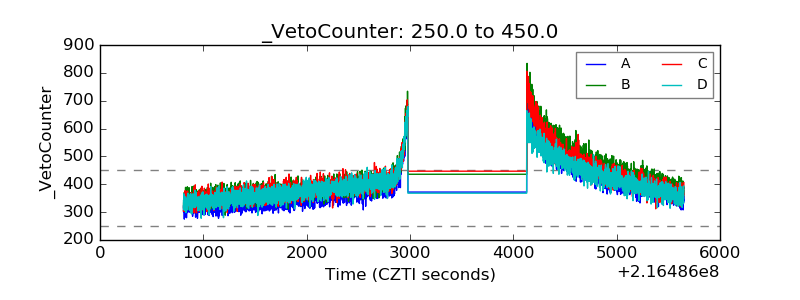 |